PERCEPTION ANALYSIS OF DESKTOP AND MOBILE
SERVICE WEBSITE
Rizqiyatul Khoiriyah
Information Systems Departement, Engineering and Informatics Faculty, Gajayana University Jl. Mertojoyo Blok L, Merjosari, Malang
ABSTRACT
The research was conducted as a qualitative study of the website to deeper explore and examine the analysis of user perception of desktop and mobile website services. This research reviewed about user perception of desktop and mobile service website used by using qualitative methods adapted to WebQual and User Experience approach. This qualitative research refered to the theoretical reference written by Creswell (2014). The expected outcome is to know the user perceptions of the available services and information in the website along with the possibility of desktop and mobile gap arising from differences in the two services. These results can be used as a service model on the website of the user experience.
Keywords: perception analysis, desktop website, mobile website, webqual, user perception
INTRODUCTION
Since it was first introduced in the mid-90s, electronic services have spread across the world in various forms. It has changed the face of business sectors from offline to online. The growth of the web has made the need for measurements related to quality like usability and accessibility of a web application. The goal is to create a website that is useful, profitable, linked to users, and accessible.
As a media, the website has the advantages to be accessed freely, without limit, wherever, whoever, and whenever. However, lately, those advantages are no longer in line with the convenience. It is because the number of mobile devices such as tablets and smartphones is rising and personal computer (desktop and notebook) is no longer in use. The website has gained immense importance not only on desktop computers but recently on mobile devices. Although device performance is getting closer to what peoplehave used from their desktop computers, many companies still offer mobile websites (Maurer & Al, 2010). Players in the world of information technology such as the news portal, blogs, social media, web companies are flocked to go mobile. Barnes & Vidgen (2006) revealed that key factors in the quality of website services could be viewed from how well it functions and how effective the users can navigate. If an organization has a troublesome website, it can build a bad image on the internet and weaken the position. Therefore, it is important that the organization can make an assessment of the quality of the website.
received by the user to be different and have caused the gap between access to desktop and mobile sites.
Altaboli and Lin (2011) made an investigation on the effects of web design factors like balance, unity and sequence (balance, unity, and sequence) which showed that these factors affected the user perception of a website. There are simplicity and the complexity factors like the visual aspect of the website including layout, clarity, homogeneity and sequence that can be user perception and psychological influence. The use of website visits is to see how well and how effectively it functions which can be a key factor in the quality of website services. When an organization with a difficult website to be used, it can build up a bad image on the internet and weaken the position of the organization. Therefore, it is important that the organization can make an assessment of the quality of theused website to find out whether it has fulfilled what is perceived by users.
There are some researches on the service quality. The three main models and service quality scale developed in this study is Servqual, ServPerf, and E-Servqual (ESQ). Moreover, used measurement model to assess the quality is the IS Success Model by DeLone and McLean where the used instruments are based on the concept that is the IS Success Model dimensional information quality, system quality and service quality (DeLone & McLean, 2003). Those three factors of the information system quality model (information quality,the system quality, and the service quality) have been adopted inseveral studies to assess various types of information system quality. Okene and Enukpere (2011) conducted a study to evaluate the websites of Delta State Polytechnics, namely Delta State Polytechnic, Ozoro and Delta State Polytechnic,Ogwashi-Uku. This study was inspired by the research conducted by Mustafa and Al-Zoua’bi mentioned above. Two online automated tools - HTML Toolbox and Web Page Analyzer were used along with a questionnaire.
Most studies use quantitative research and focus on commerce which is followed by the e-banking, education and health, firm websites and mobile portals,but only a few to explore more about the used media site (Farida, Nuryuliani, & Hermana, 2014). Therefore, this study is conducted as a qualitative research of website to explore and examine more about the analysis of user perception toward services desktop and mobile website.
Some of these studies trigger a research that aims to assess user perceptions that arise from user experience to the desktop and mobile website. Users are the key to the success or failure of the program. When the users consider the website to hamper their work, they will not use the website. From here, it can be seen how important for people to know the desires and opinions of the users.
User opinion has a link with user experience because the users can give an opinion after their experience. User experience is abbreviated as “UX”. It is probably the catchphrase that most people confuse usability with. “Perceptions and responses” of someone in the definition of user experience are similar to the concept of satisfaction in usability. Usability is important and beneficial not only to designers but also for the programmers. Moreover, usability can help the progress to achieve a good user experience, which is ultimately what most companies chase after over the years. User experience includes all of the user emotions, beliefs, preferences, perceptions, physical and psychological responses, behaviors and accomplishments that occur before, during and after using. If user experience includes all behaviors, it presumably includes the user effectiveness and efficiency. On the other words, usability is a narrower concept than UX since it only focuses on goal achievement. In contrast, UX is a consequence of the presentation, functionality, system performance, interactive behavior, and others. This essentially means that UX is an “umbrella” that encompasses many different skills needed to create a user experience, which includes human factors, design, ergonomics, Human Computer Interaction (HCI), accessibility, marketing, as well as usability (Mifsud, 2011).
of this research are to assess the user perception of desktop and mobile website services from the WebQual dimensions and user experience and to see the gap between the desktop and mobile website, and the contribution of user perception analysis on the desktop and mobile website for previous WebQual models.
METHODS
This research focuses on the concept of the quality of online services that have emerged many years ago, and it is still an interesting topic to be studied. The service quality in the online environment is important in determining the success or failure of electronic commerce. The existence of the evidence of the service quality on the delivery through the website is a very important strategic compared to the low price and a web presence. This study uses a qualitative approach with system information perspective. A qualitative approach is a process of research and understanding based on a methodology which investigates a social phenomenon and human problems. Figure 1 shows the stages of this research.
Figure1 Research Stages
Identifying problems in this research uses a case study approach considering that this aims to analyze, understand, and explore the quality of the website regarding media access to desktop and mobile. The study of literature in this research is based on the book, media, experts, or other researches. The understanding of the literature aims to compile relevant basic theory used in conducting the research on the measurement of the quality of the website of the user perception on the desktop and mobile access devices. This qualitative research refers to the theoretical reference written by Creswell (2014) entitled the research design qualitative, quantitative, and mixed approach. The Researchers create a complex picture, word study, the detailed report of the views of respondents, and conduct a study on the situation experienced. The data collection is done on the natural conditions that the subject conditions are completely untouched by the treatment which is controlled by the researcher. To ensure the validity of the data in the research, the researchers can use a technique of
Identification of the Problem
Literature Study
Qualitative Research Design
Data Collection
Analysis Data
Checking the Validity of the Results
reviews or feedback from the informants. In addition, the researchers use triangulation techniques to validate the data further.
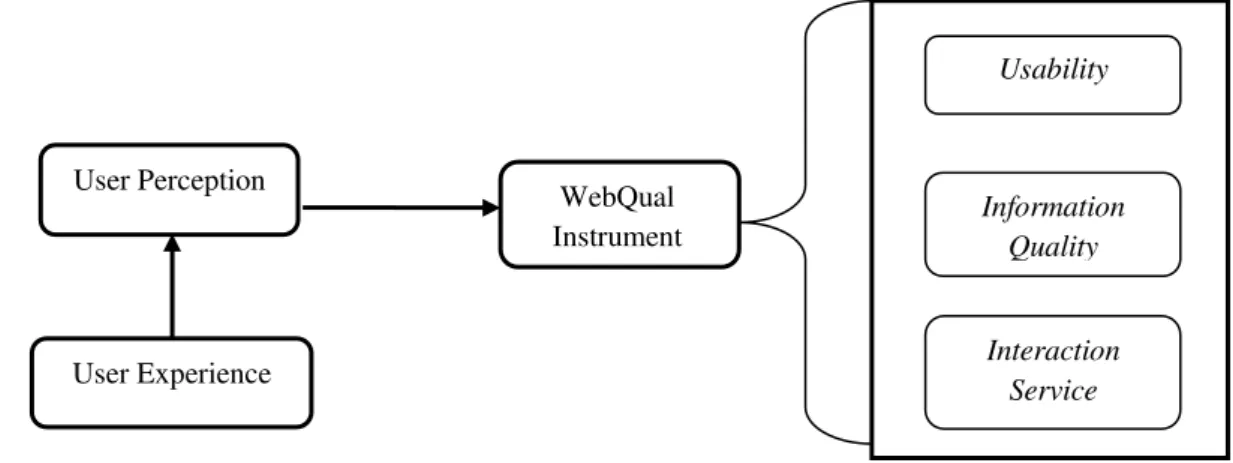
Assessment of quality of website services in this study is based on the perception of the user experience related to the model WebQual with three categories, namely domain usability, information quality and service interaction. The differences between desktop and mobile website services can be viewed from the gap between them. There are five gaps that cause the different perception regarding service quality. There are: (1) the gap between consumer expectations - perception management, (2) the gap of perception management, (3) the gap of quality specifications, (4) the gaps in delivery services, and (5) the gaps of perceived service. In general, this research model can be seen in Figure 2.
Figure 2 Research Model
The respondents are selected based on purposive sampling techniques. It means that the sample is not intended to represent the population, but it represents the information. The selected respondents are the website news users who are the editor of the newspaper "X". They have a large interest to get the news and adequate intensity to visit the website. Table 1 shows the demographics of the respondents.
Table 1 The Demographics of the Respondents
Respondents = 8
o Age > 20 years old = 7 < 20 years old = 1
o Sex M = 6
F = 2
o Education Bachelor Degree = 6 Master Degree = 2 o Length of Employment > 5 years = 6
< 5 years = 2
In this research, the researcher uses semi-structured interviews and in-depth interviews that are given to the respondents. If the data obtained from the interview is not clear enough, it can be developed with another question to elicit more information from respondents related to the focus of research. All interviews and discussions are recorded by an audio recorder and notes. The collected answers are summarized as a further coding. After doing transcription and organizing the data, the
Usability
Information Quality
Interaction Service
WebQual Instrument User Perception
researcher starts to do coding. The codes are Wcr for interviews; AM, KA for the name of the respondent; and Stat for the statement.
RESULTS AND DISCUSSIONS
After doing the transcription, organizing the data, and coding, the researcher starts the analysis. In this research, perception analysis uses qualitative data analysis with the following stages: (1) statements of respondents; (2) meaningful statement data; (3) identification of the category; (4) the description of the category; (5) grouping of major categories; (6) minor proposition; (7) major proposition (Creswell, 2014).
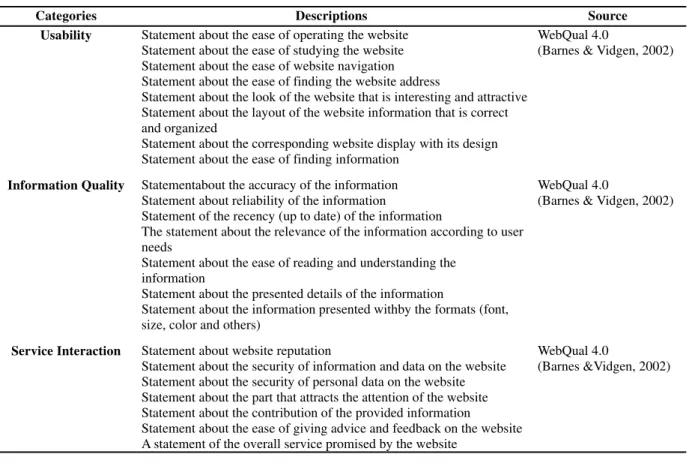
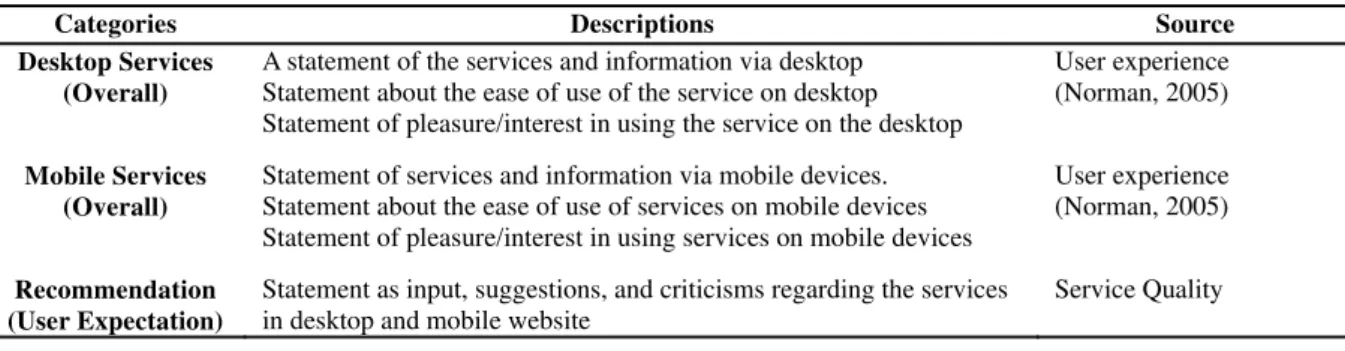
The identification and description of the categories are described in the research. There are usability, information quality, service interaction from WebQual instruments 4.0. There are also categories of desktop services (overall), mobile services (overall), and recommendation (user expectations) as the part of the service quality. Table 2 shows the identification and description of each category.
Table 2 Identification and Description of the Categories
Categories Descriptions Source
Usability Statement about the ease of operating the website WebQual 4.0
(Barnes & Vidgen, 2002) Statement about the ease of studying the website
Statement about the ease of website navigation Statement about the ease of finding the website address
Statement about the look of the website that is interesting and attractive Statement about the layout of the website information that is correct and organized
Statement about the corresponding website display with its design Statement about the ease of finding information
Information Quality Statementabout the accuracy of the information WebQual 4.0
(Barnes & Vidgen, 2002) Statement about reliability of the information
Statement of the recency (up to date) of the information
The statement about the relevance of the information according to user needs
Statement about the ease of reading and understanding the information
Statement about the presented details of the information
Statement about the information presented withby the formats (font, size, color and others)
Service Interaction Statement about website reputation WebQual 4.0
(Barnes &Vidgen, 2002) Statement about the security of information and data on the website
Statement about the security of personal data on the website Statement about the part that attracts the attention of the website Statement about the contribution of the provided information
Table 2 Identification and Description of the Categories (Continued)
Categories Descriptions Source
Desktop Services (Overall)
A statement of the services and information via desktop Statement about the ease of use of the service on desktop Statement of pleasure/interest in using the service on the desktop
User experience (Norman, 2005)
Mobile Services (Overall)
Statement of services and information via mobile devices. Statement about the ease of use of services on mobile devices Statement of pleasure/interest in using services on mobile devices
User experience (Norman, 2005)
Recommendation (User Expectation)
Statement as input, suggestions, and criticisms regarding the services in desktop and mobile website
Service Quality
The results of the analysis can explain the relationship between the user experience and WebQual dimensions whose main categories are usability, information quality, and service interaction to evaluate desktop and mobile website services. This research responds to the previous research by Barnes and Vidgen (2002), Chang and Wang (2011), and Chen and Cheng (2013) to explore the service quality of the website from the particular aspect that has been done (the object of the website, the measurement model, website evaluation factors, the identification of variables and statistical techniques used). This research aims to find out the website evaluation from the access via desktop and mobile device. It also addresses the challenges of previous research (Conger, 2012) that there is the need for evaluation and measurement of service quality by the development of the website like the media access, the website services, and others.
In qualitative research, there is more emphasis on the level of validity of the data obtained. Based on this, the research data can be said to have the significant influence on the success of the research. To ensure the validity of the data obtained in the research, the researcher can useinformant review or feedback technique to therespondents and use the triangulation technique to validate the data. The validity checking process of the research data uses triangulation and member check. The triangulation is the process of the data collection that combines various sources and data collection techniques that already exist. Next, researcher conducts the checks on the validation of obtained data by confirming the data from the respondents.
The researcher explains that the triangulation of the data sources finds the indicators based on the domain of linkage studies. The value indicators range from 1 for no effect, 2 for slightly affect, 3 for affect, and 4 for greatly affect. The example of triangulation is in Table 3.
Table 3 The Linkage of Domain Indicators
The Linkage Domain Respondent 1 Respondent 2 1 2 3 4 1 2 3 4 Inter-service quality dimensions affect each other (Usability,
Information Quality, Service Interaction)
v v
User experience in using desktop and mobile affect the usability v v User experience in using desktop and mobile affect the information
quality
v v
User experience in using desktop and mobile affect the interaction service
v v
six respondents state that user experience by using desktop and mobile affects the usability. Second, From eight respondents, two of them state that user experience affects the information quality. While, the six respondents state that user experience has a slight effect on information quality. Last, all of the eight respondents state that user experience in using desktop and mobile affect the service interaction greatly. Moreover, the data triangulation results of the eight respondents also obtain several results like user experience in using desktop dan mobile affects usability, user experience in using desktop and mobile affects the information quality slightly, and user experience in using desktop dan mobile are very influentially to service interaction.
Members check in this research aims to determine the accuracy of the results. This process is done by concluding the previous description to check whether the interview is appropriate and accurate. This process also aims to determine how far the data obtained is what is stated by the respondents. The results of these conclusions can be used as data validation to determine the accuracy of research data.
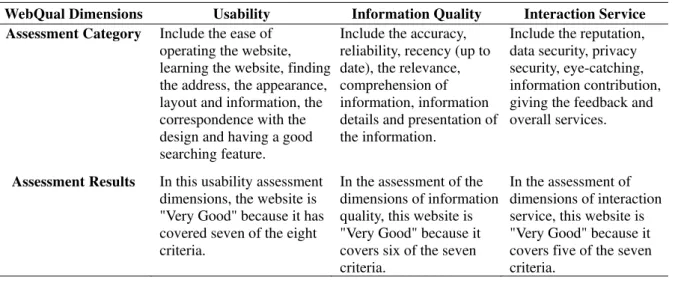
The findings of the analysis of user perception of desktop and mobile website services show several points. First, user perception of the services via desktop and mobile websites can be measured from the following WebQual dimensions in Table 4.
Table 4 The Findings
WebQual Dimensions Usability Information Quality Interaction Service Assessment Category Include the ease of
operating the website, learning the website, finding the address, the appearance, layout and information, the correspondence with the design and having a good searching feature.
Include the accuracy, reliability, recency (up to date), the relevance, comprehension of information, information details and presentation of the information.
Include the reputation, data security, privacy security, eye-catching, information contribution, giving the feedback and overall services.
Assessment Results In this usability assessment dimensions, the website is "Very Good" because it has covered seven of the eight criteria.
In the assessment of the dimensions of information quality, this website is "Very Good" because it covers six of the seven criteria.
In the assessment of dimensions of interaction service, this website is "Very Good" because it covers five of the seven criteria.
owner of brand communications, media and word of mouth) appears to affect user perceptions. Moreover, in WebQual models, the sixth dimension of usability (appropriate layout tools) has similarities with the seventh dimension of information quality (the information is presented in a suitable format layout). This causes the both dimensions to be almost in distinguishable. Furthermore, the model analysis of the perception of this website service can complement the WebQual models by providing considerate services in the form of used access devices (desktop and mobile).
This research has contributed the theoretical and practical contribution of the research that has been done. For contributions, in theory, it is obtained from the website development services that is oriented to the users, based on their experiences in using various devices to access the website. Consideration of perception and the user experience can be used as the inputs for the various research quality and service website. In addition, this research enriches the quality of the website in the context of research and information services from the used access device.
This research answers the challenge from the previous studies by Barnes and Vidgen (2002), Chang and Wang (2011), and Chen and Cheng (2013) to explore the service quality of the website of the aspects that has been done namely the object of the website, the measurement model, the factors for the website evaluation, identification of variables, and statistical techniques used. This research aims to analyze the website evaluation of the access device used by exploring more on the desktop and mobile website services. It also answers the challenges of previous research by Conger (2012) that there is a need for evaluation and measurement of quality of service (service quality measurement) in accordance with the development of the website and its supporters to the media access, website services, and others.
Then, the practical contribution of this research is that the result can be applied to the business environment as the recommendation to improve the quality of services and information on a website whether it is for desktop or mobile-oriented user. The practical contribution to the management of the company is that the result can be considered to be a policy regarding searching news especially online sources that can support the identification of the need for newspapers. With the case studies and interviews conducted in this research, the company management can see the perception of the wording. Therefore, it can be taken into consideration for the management of employee assessment, or vice versa.
There are some deficiencies that need to be improved to enhance the service quality of the website in this research. First, it is the layout of the ads. In the desktop version, the ads appearin the opening the home page and covering most of the website menu so that the users must close the ads in advance to select the menu and read the news. Additionally, ads at the top and side of the main menu are also considered a lot and crowded which can distract the users. The example can be seen in Figure 3.
The recommendations for the advertising in the desktop that the layout of the ads should be reordered so that it does not cover the menu and news. Ads can be placed in the separated section like in the right side of the website, and the ads do not change location when the users switch pages.
Figure 3 Ads Views on Desktop Website
Figure 4 Menu in Mobile News
The recommendations for the menu and links to mobile websites are that the desktop and mobile websites should be made as a responsive website. This means that the website can customize the appearance of the layout based on the screen size of the device that is used for the tablet, mobile phones, and computer screens. With a responsive website, it can provide the optimal experience for users with better navigation as seen in Figure 5.
Figure 5 Recommendation View of Responsive Website
Advertisement
Last, data security should be considered. Regarding security of personal data, users say it has been protected adequately in desktop, but when through mobile devices, users concern about the confidential data. The recommendations for data security which can be applied is additional security menu beside the account verification via email like via the short message. Moreover, if the account has been used by another person, there is a warning to the real owners via email and the short message. In addition, the protection of personal accounts needs to be improved by the users. For example, users do not forget to choose the menu to sign out after the activity on their devices, and can only use one device to access the same account.
Furthermore, practical contribution for users of website services is users can understand that a good website service in desktop and mobile have a distinctive difference so users can continue to use the services of each website well, and can be satisfied and loyal to the website. Also, users can utilize the results of the recommendations taken from the user perception of websites at once on the manager of the website. While the practical contribution for the manager of the website is the result of this research can be used as the evaluation of website management on the deficiency of the websites such as layout, navigation, usability. The evaluation of website services can be used to see how well the website runs on various devices (multidevice) like desktop and mobile devices. The evaluation of website services can also be used as the company strategy to see user need analysis. Next, the practical contribution for the practitioners of information systems is that the research process including the process of data search, data presentation, data analysis, the final results, and conclusions as well as the validity of the data is a stage of qualitative research and is different from the stage of quantitative research. The final result of the research is a model to evaluate website services,which is the findings of an evaluation of the model WebQual preexisting.It finds that there is a side of the quality dimension that is "trust" including external factors like brand image, and communication with the brand owner so it can affect user perception.
CONCLUSIONS
The analysis of user perception in the desktop and mobile services is important because the website is intended for the users. The success of a website is usually seen by the number of its users, user satisfaction and the loyalty of the users. In addition, because the website is provided in desktop and mobile version, both of these services need to be assessed and analyzed, so that evaluation can be a consideration for the owner.
User perception of desktop and mobile website services can be assessed by following WebQual dimensions. The user experience that influences the dimension of service quality are usability, information quality and interaction service. The results of the user experience are used to answer the questions about those dimensions. There are differences leading to disparities, although it is not so significant between desktop and mobile access. There are differences in the services like limited menu option, the limited number of links, the difference in ads layout. Mobile access is more practical than the desktop access. Thus it affects user interests. It is easier to use the mobile version than the desktop because it looks more simple.
There is suggestion related to this research and its future development. First, the object of research can be a newspaper company. It is based on their priority interest that they relate directly to the website. Moreover, future studies can take gender, education level, location into consideration. This research focuses on the users of the website, so the assessment is based on the perceptions and expectations of users. For further research, researchers can add a focus on the manager of the website for the balance between the user and manager.
REFERENCES
Altaboli, A., & Lin, Y. (2011). Objective and subjective measures of visual aesthetics and user of website interface design: The two side of the coin. Human Computer Interaction, Lecture
Nototes in Computer Science, 6761, 35-44.
Barnes, S., & Vidgen, R. (2002). An integrative approach to the assessment of e-commerce. Journal of
Electronic Commerce Research,3(3), 114-127.
Barnes, S., & Vidgen, R. (2006). Data triangulation and web quality metrics: A case study in e-government. Information and Management, 43(6), 767-777.
Chang, H., & Wang., H. (2011). The marketing effect of customer perceived value on online shopping behavior. Online Information Review, 35(3), 333-359.
Chen, C., & Cheng, C. (2013). How online and offline behavior processes affect each other: Customer behavior in a cyber enhanced bookstore. Quality and Quantity Journal, 47(5), 2539-2555.
Conger, S. E. (2012). Service quality measurement: Past and future. In Special Interest Group on
Services associated with the International Conference on Information Systems (ICIS SIGSVC).
Creswell, J. W. (2014). Research design qualitative, quantitative, and mixed methods approaches (4th ed). California: Sage Publications Inc.
DeLone, W. H., & McLean, E. R. (2003). The DeLone and McLean model of information systems success: A ten-year update. Journal of MIS, 19(4), 9–30.
Farida, S. I., Nuryuliani, & Hermana, B. (2014). A review of empirical research on website quality measurement model based on consumer’s perception. In International Conference on Internet
Studies, August 16-17, 2014, Singapore.
Forum.detik.com. (2012). Retrieved on January 10, 2015 from forum.detik.com/iklan-detiknews-mengganggu-sekali-t397596
Maurer, M. E., & Al, E. (2010). Mobile or desktop websites?: Website usage on multi touch devices.
In Proceedings of the 6th Nordic Conference on Human-Computer Interaction: Extending
Boundaries (pp. 739-742). ACM.
Mifsud, J. (2011). The difference (and relationship) between usability and user experience. Retrieved from http://usabilitygeek.com/the-difference-between-usability-and-user-experience/
Okene, D. E., & Enukpere, V. E. (2011). Comparative Analysis of the Usability of Academic Websites of Delta State Polytechnics. Journal of Emerging Trends in Engineering and
Applied Sciences (JETEAS), 2(6), 1042-1046.
Parasuraman, A., Zeithaml, V. A., & Berry, L. L. (1985). A conceptual model of service quality and its implications for future research. The Journal of Marketing, 49(4), 41-50.