UNIVERSIDADE DE LISBOA
FACULDADE DE MEDICINA DENTÁRIA
SOFT TISSUE REPLICATION IN SINGLE UNIT
IMPLANT IMPRESSIONS – A THREE-DIMENSIONAL
CLINICAL STUDY
Ricardo Jorge M. Pinto
Dissertação orientada pelo Professor Doutor Duarte Nuno da Silva Marques e Co-orientada pelo Professor Doutor João Manuel Mendes Caramês
Dissertação de Mestrado Integrado em Medicina Dentária
2019
ii
Dissertação formatada de acordo com as normas de publicação da revista
iii
À minha avó, que dizia que “mais vale o saber que o ter”. Ao meu pai, que sempre disse que “as ações ficam com quem as toma”. Ao meu orientador e mentor, que diz que “o GIBBO é o meu grupo e confiaria, a qualquer um deles, os meus próprios filhos”.
iv ACKNOWLEDGEMENTS
Os agradecimentos devem de ser feitos a quem os merece, e há alguns que são merecedores disso mesmo.
Ao Professor Doutor Duarte Marques, por ser um modelo a nível académico e principalmente pessoal, um exemplo para todos os que o rodeiam.
Ao Professor Doutor João Caramês, por ter permitido a concretização deste trabalho.
À Rita Alves, pela brutal sinceridade, bom espírito e principalmente pela amizade, esta que espero que conte muitos mais anos.
Ao Grupo de Investigação em Biologia e Bioquímica Oral e ao seu diretor, Professor Doutor António Mata que, tão longe de casa, me aceitaram na sua família como um deles e me deram todas as ferramentas para crescer e prosperar.
À Alice, pela paciência e dose de compreensão necessária durante estes anos. À minha mãe, ao meu pai, à minha irmã e à minha sobrinha, que me deram tudo o que precisei, desde o conselho à chamada de atenção, e a quem espero que tenha deixado orgulhosos.
v ABSTRACT
Objective: Validation of a novel technique for comparison of soft tissue
replication between conventional and digital impressions for definitive single unit implant rehabilitation in the esthetic zone.
Materials and Methods: Six patients were recruited according to inclusion
criteria for this cross-over pilot study and submitted to a conventional silicone implant impression with customized coping and a digital impression with an intraoral scanner. Stereolithography files obtained from the same patient were superimposed with appropriate software and trueness evaluated between methods at predetermined locations (56 in hard and soft tissues and 18 in the emergence profile, per patient). Results were presented as mean Root Mean Square 95% confidence interval and effect size calculated with Hedges’g 95%. Mann-Whitney and Kruskal-Wallis were performed when appropriate and α was set at 0.05.
Results: Trueness between methods equated to 51.08 [45.68;56.47] µm and 60.46
[52.29;68.62] µm in hard and soft tissues, respectively. Soft tissue replication by intraoral scanner acquisition corresponded to a statistically significant Root Mean Square of 243.89 [209.15;278.63] µm equating to a Hedges’g of 1.52 [1.22;1.82] with corresponded to a large effect size.
Conclusion: The proposed technique allows for 3D determination of peri-implant
tissues’ changes in digital models with higher sensitivity than visual techniques, thus presenting itself as a promising alternative in clinical studies, and that the use of an intraoral scanner obtained significant differences in the soft tissue emergence profile replication when compared with the gold standard.
Clinical Significance: The proposed methodology allows the assessment of
changes in digital models with higher sensitivity than visual techniques. Although the use of an intraoral scanner allowed for statistically significant discrepancies when compared to the use of customized implant impression copings, those differences were below the clinical visual threshold. The proposed technique shows promise in future clinical studies to quantify changes in hard or soft tissues.
Keywords: Dental Implants [E06.780.346.593], Dental Impression Materials
vi
[L01.224.108.150.500.500], Software [L01.224.900], Analog-Digital Conversion [L01.224.230.260.280.080]
vii RESUMO
A reabilitação oral com implantes tem-se tornado no tratamento de eleição para a reabilitação de espaços edêntulos. Após uma extração dentária, encontram-se descritas na literatura alterações nos tecidos duros e moles de suporte que, na zona estética, têm especial importância no resultado estético da reabilitação.
Para guiar a cicatrização dos tecidos moles após colocação de implantes dentários, poderá estar indicada a utilização de reabilitações provisórias que modelem a mucosa ao formato pretendido para a futura reabilitação definitiva. Após o período de modelação dos tecidos moles periimplantares, encontra-se descrito na literatura como gold standard a realização de uma impressão de silicone com o auxílio de um pilar de impressão personalizado de forma a transferir os contornos do perfil de emergência para o modelo de trabalho a ser utilizado pelo técnico de prótese dentária na realização da reabilitação definitiva.
Com o desenvolvimento da tecnologia na Medicina Dentária, os digitalizadores intraorais tornaram-se uma ferramenta cada vez mais utilizada pelos Médicos Dentistas, permitindo impressões dentárias e implantares mais rápidas e confortáveis para o paciente. No entanto, não existe atualmente na literatura uma avaliação quantitativa das diferenças existentes entre o método digital e o método analógico com silicone e utilização de um pilar de impressão personalizado.
Estudos recentes propõem a utilização de softwares que realizam a sobreposição de modelos virtuais, permitindo desta forma quantificar as diferenças detetadas com limites de sensibilidade superiores aos métodos convencionais usualmente descritos. Estabeleceram-se como objetivos deste estudo a validação de uma nova técnica digital para a determinação da veracidade entre os dois métodos (digital e analógico) e a avaliação das discrepâncias detetadas no perfil periimplantar de um implante unitário agendado para reabilitação definitiva.
O estudo piloto foi registado com o número NCT03496428 e, após aprovação pela comissão de ética da Instituição onde os dados seriam recolhidos, foram incluídos seis pacientes de acordo com critérios previamente definidos. Após obtenção de consentimento informado, cada paciente foi submetido, na mesma consulta, a uma impressão digital com digitalizador intraoral (TRIOS, 3Shape, Copenhagen, Denmark) e
viii
a uma impressão convencional com polivinil siloxano (Affinis Light Body Type 3, Putty soft Type 0, Coltene, Altstätten, Switzerland) e pilar de impressão personalizado.
A impressão digital foi realizada imediatamente após a remoção da reabilitação provisória de forma a evitar o possível colapso da mucosa após perda do suporte físico, tendo sido obtido assim o primeiro modelo digital.
Antes da impressão convencional, foi realizada a personalização do pilar de impressão pela técnica descrita por Hinds – resumidamente, a coroa provisória foi aparafusada a um análogo do implante e foi colocada numa matriz de polivinil siloxano. A reabilitação provisória foi recolocada no paciente e a matriz ficou impressionada com o perfil de emergência da mesma. O pilar de impressão foi apertado ao análogo do implante e o espaço remanescente foi preenchido por resina compósito, a qual reproduziu o formato cervical da coroa provisória. O pilar de impressão personalizado foi aparafusado ao implante do paciente e foi realizada a impressão de dupla viscosidade (putty e light), a qual foi posteriormente vazada a gesso tipo IV (Top Super Hard Stone, class IV light yellow, Sherahard-rock, SHERA Werkstoff-Technologie GmbH & Co. KG, Lemförde, Germany) e o modelo resultante foi adquirido com o auxílio de um digitalizador de laboratório (D2000, 3Shape, Copenhagen, Denmark), tendo sido assim obtido o segundo modelo digital.
Os modelos digitais foram guardados em ficheiros Stereolithography, e o conjunto dos dois modelos de cada paciente foi importado para um software de engenharia reversa (Geomagic Design X) para serem cortados pela zona de interesse, previamente definida como dois dentes para mesial e para distal da localização do implante. De seguida, os dados foram importados para o programa de análise (Geomagic Control X) para alinhamento, sobreposição e quantificação das alterações detetadas entre os dois grupos. Foi realizada, em primeiro lugar, a validação do programa pelos métodos previamente descritos por Imburgia e, em seguida, foi realizado o alinhamento e sobreposição dos mesmos pelo algoritmo de best fit. De forma a selecionar as localizações a analisar foram determinados planos virtuais – pelo eixo cervical-apical de cada dente e do implante, planos frontais pelo eixo mesiodistal do implante e de cada dente imediatamente adjacente, três planos transversais paralelos entre si em cada dente a partir do zénite gengival e separados por um milímetro para apical e, no implante, um no ponto mais apical identificável do perfil de emergência, outro no zénite mucoso e o ultimo no ponto médio entre estes. As áreas de análise foram determinadas pela interseção dos planos
ix
criados com os modelos digitais. A ferramenta “3D Compare” foi usada para quantificar as discrepâncias nas localizações descritas, tendo sido calculado o Root Mean Square por métodos previamente descritos.
A veracidade entre os métodos convencional e digital foi calculado a partir da análise das discrepâncias obtidas em seis localizações por dente e seis localizações por gengiva respetiva, distribuídas por vestibular e palatino, em incisal, cervical e no ponto médio entre estes, aos quais se acrescentou, nos dentes adjacentes ao implante, localizações interproximais. No total foram analisadas 304 localizações nos tecidos duros e moles dentários.
Para avaliar as discrepâncias na mucosa periimplantar entre métodos, foram determinadas localizações ao nível do perfil de emergência, do zénite e no ponto médio entre estes nos diferentes lados da mucosa – vestibular da mucosa vestibular, palatino da mucosa vestibular, vestibular da mucosa palatina e palatino da mucosa palatina. Também foram determinadas localizações seguindo as mesmas directrizes nas mucosas mesial e distal, resultando num total de 108 medições nos perfis de emergência dos implantes dos pacientes incluídos no estudo.
A normalidade da distribuição foi testada com o teste Shapiro-Wilk e a igualdade da variância com o teste Levene. Devido à distribuição não normal, foram realizados os testes Mann-Whitney e Kruskal-Wallis para comparar os valores entre métodos (α = .05). Quando foram realizadas múltiplas comparações, foi aplicada a Correção de Bonferroni. Os resultados foram apresentados como média e intervalo de confiança a 95% de Root
Mean Square e o tamanho de efeito entre tecidos moles de dentes e implantes foi
calculado como g de Hedges ± intervalo de confiança a 95%. O nível de significância foi determinado como 0.05 e todos os cálculos foram realizados com software estatístico (SPSS 25.0, SPSS Inc., Chicago, Illinois).
A veracidade entre técnicas nos tecidos duros e moles apresentou um valor global de 51.08 [45.68; 56.47] μm e 60.46 [52.29; 68.62] μm, respetivamente, sem apresentar diferenças estatisticamente significativas entre eles (teste Mann-Whitney, P = .33). Entre as diferentes localizações nos tecidos duros e nos tecidos moles, o teste Kruskal-Wallis não detetou diferenças estatisticamente significativas (P > .05), determinando a metodologia proposta como confiável para a análise da mucosa periimplantar.
x
A análise da discrepância do perfil de emergência entre métodos resultou no valor global de 243.89 [209.15; 278.63] μm, com diferenças estatisticamente significativas em comparação com os tecidos moles em torno dos dentes (teste Mann-Whitney, P < .001), correspondendo a um g de Hedges de 1.52 [1.22; 1.82], considerado de grande efeito. As diferentes localizações do perfil de emergência não apresentaram diferenças estatisticamente significativas entre si (teste Kruskal-Wallis, P = .063).
O presente estudo permitiu a validação do método proposto para determinação quantitativa de alterações nos tecidos moles periimplantares entre a utilização de digitalizador intraoral comparativamente à utilização da impressão convencional com pilar de impressão personalizado.
Os métodos de avaliação previamente descritos na literatura para avaliação do sucesso estético até agora foram baseados em índices visuais que contabilizam alterações a partir de 0,5 mm, não tendo em conta alterações abaixo desse limiar. Com a metodologia aplicada, foi possível determinar que a utilização de um pilar de impressão personalizado previne alterações de, pelo menos, 200 μm na mucosa periimplantar. No entanto, esta discrepância encontra-se abaixo do limiar de deteção clínica de 500 μm, o que significa que apesar de estatisticamente significante, esta diferença pode não ter relevância clínica, sendo que o impacto desta discrepância ainda não está determinado.
Desta forma, este estudo piloto sugere que a técnica proposta permite a quantificação em três dimensões das alterações periimplantares com maior sensibilidade que as técnicas visuais e que a utilização de pilar de impressão personalizado permite uma melhor replicação do perfil de emergência quando comparado com a utilização de um digitalizador intra-oral, embora não seja claro que a diferença detetada possua impacto clínico.
Palavras-chave: Implantes Dentários, Impressões Dentárias, Stereolithography,
xi TABLE OF CONTENTS
LIST OF TABLES... xii
LIST OF FIGURES ... xiii
LIST OF ABBREVIATIONS ... xiv
1 – INTRODUCTION ... 1
2 – MATERIALS AND METHODS ... 3
2.1 – Patient Selection... 3
2.2 – Digital Impression Method ... 3
2.3 – Conventional Impression Method with Coping Customization, Stone Model Fabrication and Digitalization... 4
2.4 – 3D Analysis ... 6 2.5 – Statistical Analysis ... 9 3 – RESULTS ... 11 4 – DISCUSSION ... 14 5 – CONCLUSION ... 17 6 – REFERENCES ... 18
xii LIST OF TABLES
Table 1 – RMS ± 95% CI (μm) detected differences between methods in the different
xiii LIST OF FIGURES
Figure 1 – Steps of conventional and digital workflow methods for intraoral impressions
applied to each patient. ... 3
Figure 2 – Process of intraoral scanning: intraoral model right after provisional removal
(A), with scan body (B), scan body alignment in laboratory (C) and the digital matching with the implant analogue (D). ... 4
Figure 3 – Impression customization for a right superior central incisor implant
rehabilitation. Intraoral photography with provisionals (A), removal of provisionals (B) and attachment to an implant analogue placed into a polyvinyl siloxane impression material matrix (C). Removal of provisional (D), attachment of the conventional impression coping (E) and filling of the remaining space with composite resin (F). Customized impression coping (G and H) placed in position (I). ... 6
Figure 4 – Representation of hard (A and B) and soft (C and D) tissues’ points
distribution. ... 8
Figure 5 – Example of 3D visualization with “3D Compare” tool. Specific parameters
were set to the color scale, ranging from +1000 to -1000 μm, and the best results ranging between +100 and -100 μm highlighted in green. ... 9
Figure 6 – A - Alignment and superimposition of each patient’s datasets; B - Color
difference map between extraoral scanner and intraoral scans; C - Sagittal view through each implant for analysis of linear discrepancies. Max/min nominal ± 100 μm (green). Max/min critical ± 1000 μm (dark red and dark blue). ... 11
Figure 7 – Column chart of the RMS (mean ± 95% CI) values for each assessed side in
implant and teeth’s hard and soft tissues. * P < .05 between implant’s and teeth’s hard and soft tissues. ... 13
Figure 8 - Boxplot of RMS (mean ± 95% CI) overall differences between methods for
different tissues [n = 6 patients with 108-180 locations per tissue]. * P < .05 between soft tissues emergence profile and tooth hard and soft tissues. ... 13
xiv LIST OF ABBREVIATIONS
CAD/CAM - Computer-Aided
Design/Computer-Assisted Manufacture
STL - Stereolithography IOS - Intraoral scanner µm - Microns
mm - Millimeters 3D - Three-dimensional 2D - Two-dimensional CIIC - Customized Implant
Impression Coping
U.S. - United States ºC - Celsius degrees RMS - Root Mean Square Bc - Buccal cervical Bm - Buccal middle Bi - Buccal incisal Pi - Palatal incisal Pm - Palatal middle Pc - Palatal cervical
Gbc - Gingiva buccal cervical Gbm - Gingiva buccal middle Gbz - Gingiva buccal zenith Gpz - Gingiva palatal zenith Gpm - Gingiva palatal middle
Gpc - Gingiva palatal cervical Mip - Mesial interproximal Dip - Distal interproximal Epbl - Emergence profile base
level
Z - Zenith M - Middle
Bbm - Buccal of the buccal mucosa Pbm - Palatal of the buccal mucosa Bpm - Buccal of the palatal mucosa Ppm - Palatal of the palatal mucosa Mm - Mesial mucosa
Dm - Distal mucosa
MCID - Minimal Clinically
1 1 – INTRODUCTION
Implant rehabilitation has become increasingly popular as the optimum treatment for tooth replacement. Although implants present the potential to maintain alveolar bone upon placement, the literature shows that inherent hard and soft tissue changes can create additional challenges in the esthetic area.1 Soft tissue changes are often associated with tooth extraction followed by implant placement and alveolar ridge resorption.2 The outcome of an esthetic rehabilitation treatment is the result of a series of factors such as surgical technique, position of the osseous crest, bone support and form and biotype of the periodontium, all paramount for esthetics in the anterior zone.3-5
A number of authors have described the use of anatomically contoured provisional restorations to guide the soft tissue healing in an ideal and natural morphology, thus replication the soft tissue contour of the tooth.6,7 Following this, the exact duplication of these outlines should be obtained by making impressions that accurately reproduce implant locations in relation to intraoral hard and soft structures.8 For this purpose, techniques for the customization of the conventional implant impression copings have been described in the literature as accurate and efficient methods to replicate the healed emergence peri-implant tissues, thus allowing the dental technician to fabricate a restoration with proper contour, function and esthetics.6,7 Over the years, these techniques have been considered as the gold standard and, although several indexes for assessing the esthetic success of reconstructions with single implants in the anterior maxilla have been published,3,4,9 a quantitative comparison of the peri-implant emergence profile replication by different techniques has never been described.
Today, engineering technologies such as computer-aided design/computer-assisted manufacture have advanced at high speed in dental medicine.8,10,11 These methods require the use of stereolithography (STL) files, which can be acquired intraorally with an intraoral scanner (IOS),12,13 or extraorally using a stone cast poured from a conventional impression and digitalized via laboratory scanner.14
Digital impressions can minimize inaccuracies such as impression material strain, displacement of implant impression components and gypsum expansion, eliminating the need for conventional impression materials and making it faster and more comfortable for patients,8,15,16 although the high cost of investment still being a barrier to become a standard of care.16 The use of IOS allows for the immediate determination of the quality of the impression, with described values of trueness ranging from 44 to 64 microns (μm) and precision from 16 to
2
27 μm, 11,17,18 depending on the IOS used, but well below the currently accepted threshold of 100-120 μm of clinical deviation, being described as a comparable alternative to conventional impression methods.16
To this day, available soft tissues’ measuring techniques are predominantly clinical, with photos taken before and after surgery, probing or indexes such as Pink Esthetic Score,4 which only considers mucosal modifications above 1 mm. All these approaches are operator-dependent, thus making possible the introduction of bias in photographic parameters, pressure on probing and interpretation of results with limited information regarding the overall 3D behaviour of peri-implant soft tissues and their influence on esthetic outcomes.19,20
Recently, studies have proposed the use of reverse-engineering software that allows STL dataset superimposition for measuring,8,17,21,22 with high levels of accuracy.10,15,23,24 In 2016, one clinical paper assessed the stability of buccal peri-implant soft tissues over time,21 thus providing the rationale for this study.
Although for single unit implant impressions in the esthetic area the use of a customized implant impression coping (CIIC), which reproduces the provisional crown emergence profile, is still considered the gold standard, it entails an additional clinically time-consuming step when compared with the use of an IOS which, from the perspective of effectiveness, should be compared in relation to peri-implant emergence profile replication.
Thus, the present study evaluated teeth’s hard and soft tissues trueness between techniques as a validation step, followed by a comparison between the emergence profile replication in single unit implants in the esthetic area using the conventional technique with a CIIC and an intraoral impression with an IOS. The null hypothesis tested in this study was that there is no clinical difference (<1 mm discrepancy) in the soft tissue emergence profile between techniques.
3 2 – MATERIALS AND METHODS
2.1 – Patient Selection
This clinically study was conducted in full compliance with the Helsinki World Medical Association Declaration and its most recent amendments, being approved by the local ethics committee and registered at the U.S. National Library of Medicine ClinicalTrials.gov website under the reference number NCT03496428.
The patients were chosen according to the following criteria: be at least 18 years of age; have at least one implant in the anterior maxilla with the indication for rehabilitation with a definitive implant supported crown; have two mesial and two distal adjacent teeth to the implant and be rehabilitated with a provisional implant supported crown for at least 3 months. As this was a pragmatic trial undertaken in a private clinical setting, patients with active smoking habits and evidence of parafunctional habits (ie, bruxism) were not excluded. Each patient was thoroughly informed about the procedures and each signed an informed consent agreement before entering the study.
Figure 1 – Steps of conventional and digital workflow methods for intraoral impressions applied
to each patient.
2.2 – Digital Impression Method
Following the digital workflow method above (Figure 1), immediately after the removal of the provisional implant supported crown, digital impressions were the first to be obtained by an experienced clinician (DM) using an IOS (TRIOS, 3Shape, Copenhagen, Denmark) following the manufacturer recommended scanning sequence25 – first, the emergence profile was scanned right after the removal of the provisional crown (Figure 2A) to assess the emergence profile, after which a scan body was attached to the implant and an intraoral scan was performed (Figures 2B and 2C) to obtain the implant analogue alignment (Figure 2D). This IOS uses optical scanning with structured light on the principle of confocal microscopy, which
4
does not require opacization of the model and produces 3D color images. The datasets from each scan was automatically saved as STL files.
Figure 2 – Process of intraoral scanning: intraoral model right after provisional removal (A),
with scan body (B), scan body alignment in laboratory (C) and the digital matching with the implant analogue (D).
2.3 – Conventional Impression Method with Coping Customization, Stone Model Fabrication and Digitalization
In the same appointment, following the conventional workflow method (Figure 1), the CIIC was obtained by a previously described indirect technique.6 Briefly, the provisional crown was attached to an implant analog and placed into a polyvinyl siloxane impression material matrix (Affinis Putty, Coltene, Altstätten, Switzerland). The mold was obtained and the provisional returned to the patient’s mouth to avoid soft tissue collapse. The impression coping was attached to the implant analog and filled with composite resin (Supreme 3M flow, 3M ESPE, Saint Paul, Minnesota), which took the 3D shape of the provisional soft tissue emergence profile, thus obtaining a CIIC (Figure 3). It was hand tightened and the proper seating was confirmed by visual and X-ray verification.
A dual viscosity impression in one-step pick-up procedure was constructed using polyvinyl siloxane material (Affinis Light Body Type 3, Putty Soft Type 0, Coltene, Altstätten, Switzerland) in a standard plastic die lock tray (Single Use Perforated Impression Tray, Solo,
5
J&S Davis, Stevenage, Herts, United Kingdom) prepared prior to loading into position. The impression was removed from the patient’s mouth at least 2 minutes longer than the manufacturer’s recommendation (2 minutes) and stored at 23ºC for 8 hours. The impression was poured with type IV dental stone (Top Super Hard Stone, class IV light yellow, Sherahard-rock, SHERA Werkstoff-Technologie GmbH & Co. KG, Lemförde, Germany) after mixing according to manufacturer instructions. The stone model was separated from the impression after 40 minutes, stored at laboratory temperature (21ºC-23ºC) for 24 hours, with no exposure to sunlight, and then scanned with the extraoral scanner D2000 (3Shape, Copenhagen, Denmark), which has 5-megapixel high resolution cameras, multiline technology and color scanning, achieving accuracy up to 5 μm,26 thus creating a STL file, which was previously calibrated according to manufacturer’s instructions. This digitalized model was considered the reference.
6 Figure 3 – Impression customization for a right superior central incisor implant rehabilitation.
Intraoral photography with provisionals (A), removal of provisionals (B) and attachment to an implant analogue placed into a polyvinyl siloxane impression material matrix (C). Removal of provisional (D), attachment of the conventional impression coping (E) and filling of the remaining space with composite resin (F). Customized impression coping (G and H) placed in position (I). Final result (J).
2.4 – 3D Analysis
Two STL files were obtained from each patient and, to allow for blinding, an external operator provided the STL files named with the patient reference number, followed by the letter A (for reference) or B (for measured), keeping the correspondence code in an opaque sealed envelope until the end of the study. The files were imported into the reverse engineering software Geomagic Design X (3D Systems, Rock Hill, South Carolina) where they were cut to
7
the zone of interest with the “Split” tool, removing unnecessary information, and submitted to the “Healing Wizard” to reduce the number of distortions and small artifacts that could influence analysis. The generated datasets were then imported into the point-cloud inspection software Geomagic Control X (3D Systems).
Software validation was performed as previously reported17 and repeated five times per scan (60 repetitions in total) to check software reliability, after which virtual sagittal planes were created to guide the standardization of the locations of interest – through the cervical-apical axis of each of the five structures (four teeth and one implant), frontal planes over the mesiodistal axis of the implant and the two adjacent teeth, three transversal planes parallel between them in the four teeth, one at the gingival zenith and two others apically from the first with 1 mm spacing between them and in the implant at emergence profile base level, which was defined with a horizontal plane in the most apical identifiable point of the customized emergence profile, mucosal zenith and in the middle of them. The locations were determined by the intersection between the described planed with the superimposed scans, and the linear differences were obtained by the 3D analysis program.
However, although the planes were meant to standardize the choice of the pre-determined locations, the capability of the one operator to reproduce the same locations in the three replicates was low due to the amount of existent polyfaces, thus making it difficult to appropriately reproduce the proposed method. In order to make the study reproducible, the authors modified the proposed methodology to instead of a linear distance between two datapoints (one in the reference scan, another in the comparison scan), the discrepancies in the pre-determined locations were analyzed in an area of about 1 mm2, with a more representative sample of the location of interest, with the mean deviation between methods of the pre-determined areas calculated as Root Mean Square (RMS), following previously established methods.22
8 Figure 4 – Representation of hard (A and B) and soft (C and D) tissues’ points distribution.
To evaluate the trueness between conventional (reference) and digital (comparison/measured) impression methods, RMS distances were determined on both buccal and palatal sides of the teeth at cervical, incisal and in the middle point between them in each tooth (Bc, Bm, Bi, Pi, Pm and Pc) and in the respective soft tissues (Gbc, Gbm, Gbz, Gpz, Gpm and Gpc, as shown in Figure 4A. In the interproximal area of the implant (mesial and distal sides, Mip and Dip), the same locations as in the buccal/palatal were measured (Figure 4B). In total, 304 comparisons were performed in teeth’s hard and soft tissues to assess trueness between methods.
To evaluate the soft tissue replication between methods in peri-implant soft tissues, the locations were measured at emergence profile base level (epbl), at the zenith (z) and in the middle of both (m) on the different sides of the implant mucosa: the buccal of the buccal mucosa (Bbm), the palatine of the buccal mucosa (Pbm), the buccal of the palatal mucosa (Bpm) and the palatine of the palatal mucosa (Ppm), and the mesial and distal mucosa (Mm and Dm, Figures 4C and 4D), corresponding to 18 locations per patient, amounting to a total of 108 measurements. If the scans presented teeth with modifications for prosthesis fabrication or distortions, the affected areas were not assessed.
9
For each location, with the “3D Compare” tool, an area of interest with at least 1 mm2 was selected and used to measure the differences between methods, with three replicates performed per location. The analysis software automatically calculated RMS and the mean of the three replicates considered for statistical analysis.
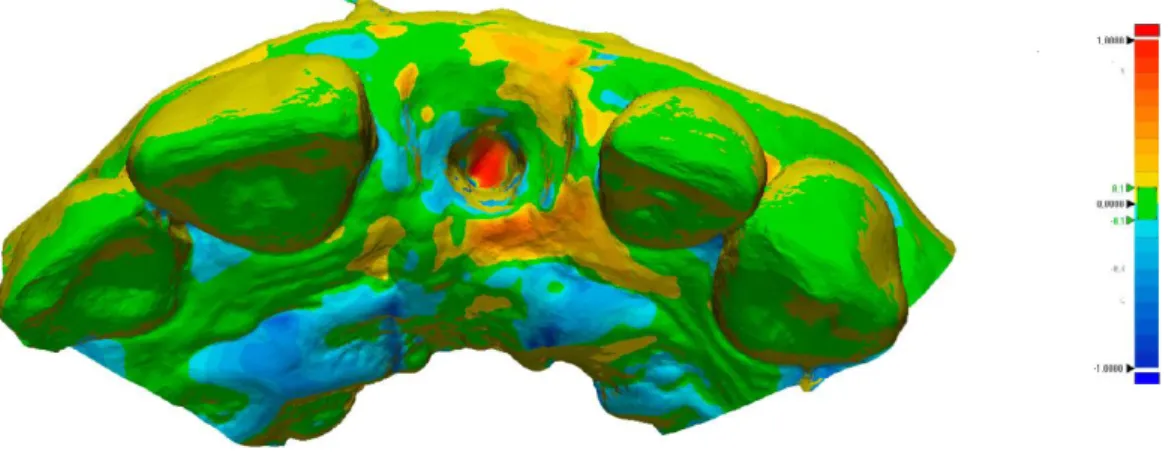
For optimal 3D visualization, a colored map was created with negative (blue, showing the comparison scan going inwards) and positive values (red, going outwards), as shown in .
Figure 5 – Example of 3D visualization with “3D Compare” tool. Specific parameters were set
to the color scale, ranging from +1000 to -1000 μm, and the best results ranging between +100 and -100 μm highlighted in green.
2.5 – Statistical Analysis
Although no studies employing this method were found in the literature, from a study on direct and indirect techniques in CIIC,22 we expected a mean difference of 1 mm. A statistical power analysis was performed to determine the number of patients with an equivalence study design. With an α = .05 and a power of 0.80, the calculations revealed that at least six patients would be needed to be 95% sure that the limits of a two-sided 90% confidence interval would exclude a difference in means of more than 500 μm.
Primary outcomes were defined as the variation in the RMS between the two methods in the hard (teeth) and soft (teeth and peri-implant mucosa) tissues’ measurements. Descriptive statistic (means and 95% confidence interval) was performed on the studied parameters. Normality of distribution was tested by Shapiro-Wilk Normality test and the Levene test was used to assess the equality of variance. According to the results, the nonparametric Mann-Whitney U and Kruskal-Wallis tests were used to compare RMS between methods in hard and
10
soft tissues (α = .05). When performing multiple comparisons, the P-value was adjusted according to the Bonferroni Correction method.
Effect size between soft tissues’ measurements (tooth vs implant) was calculated as Hedges’ g ± 95% confidence interval, as a result of different sample sizes.27-30 Effect size was considered of small (<0.3), moderate (0.3-0.8) or large (≥0.8) effect. The level of significance was set at .05. All calculations were carried out with statistical software (SPSS 25.0, SPSS Inc., Chicago, Illinois).
11 3 – RESULTS
The gender distribution was five females to one male, with a mean age of 51 years old (range: 23-76), who received one external connection implant (Osseotite, Biomet 3i, Florida) and five internal connection implants (BOPT, Biomet 3i, Florida), equating to two canines and four central incisors, with the implant depth ranging from 2 to 5 mm of the gingival zenith. Initially, a 3D analysis of each case was performed with both workflow methods. This provided color difference maps between extra and intraoral scans for each patient. The deviation distribution tended to differ between the conventional and digital impressions in the soft tissue emergence profile, shown in dark red and dark blue (Figure 6).
Figure 6 – A - Alignment and superimposition of each patient’s datasets; B - Color difference
map between extraoral scanner and intraoral scans; C - Sagittal view through each implant for analysis of linear discrepancies. Max/min nominal ± 100 μm (green). Max/min critical ± 1000 μm (dark red and dark blue).
The results were calculated from 412 predetermined locations with a mean area of 1.29 mm2 [1.23; 1.34] and mean of 44.92 [41.53; 48.30] polyfaces that were used to assess the RMS. For each location, three replicates were performed, and the mean value obtained.
12
Differences between techniques in the different locations are presented as RMS and 95% Confidence Interval (CI) (Table 1) in teeth’s 180 hard and 124 soft tissues locations, with an overall RMS trueness of 51.08 [45.68; 56.47] μm and 60.46 [52.29; 68.62] μm respectively, without statistically significant differences between them (Mann-Whitney U test, P = .33). When comparing the different locations in teeth and soft tissues around them, an independent Samples, Kruskal-Wallis pair-wise comparison was performed, which did not detect statistically significant differences between them (P > .05), thus ascertaining that the proposed method was reliable for hard and soft tissues measurements.
Table 1 – RMS ± 95% CI (μm) detected differences between methods in the different locations.
To evaluate soft tissue replication with the use of an intraoral scanner in single implant supported rehabilitations, overall RMS discrepancies equated to 243.89 [209.15; 278.63] μm for peri-implant soft tissues, which presented statistically significant differences when compared to soft tissues around teeth (Independent Samples Mann-Whitney U test, P < .001) (Figure 7), corresponding to a Hedges’ g of 1.52 [1.22; 1.82], which can be considered as a statistically significant large effect in soft tissue replication with the use of an intraoral scanner.
13 Figure 7 – Column chart of the RMS (mean ± 95% CI) values for each assessed side in implant
and teeth’s hard and soft tissues. * P < .05 between implant’s and teeth’s hard and soft tissues.
The different sides (buccal-buccal, buccal-palatal, interproximal, palatal-buccal and palatal-palatal) in peri-implant soft tissues were compared without statistically significant differences between them (Independent Samples, Kruskal-Wallis, P = .063).
Figure 8 - Boxplot of RMS (mean ± 95% CI) overall differences between methods for different
tissues [n = 6 patients with 108-180 locations per tissue]. * P < .05 between soft tissues emergence profile and tooth hard and soft tissues.
14 4 – DISCUSSION
This study focused on validating a digital method for soft tissue assessment and to determine soft tissue replication of peri-implant tissues with the use of an IOS when compared to a CIIC with conventional impression methods. The results suggest the proposed method as valid and that there are statistically significant differences between techniques in soft tissue replication, with an RMS of 243.89 [209.15; 278.63] μm, associated with an effect size greater than 0.8 (considered as large), which can be attributed to the use of IOS. However, the obtained results do not allow rejecting the previously proposed null hypothesis, as the detected discrepancies were below the 1 mm clinically detectable threshold. This study was designed as a pragmatic clinical trial and intended to determine soft tissue discrepancies in a real world setting, thus increasing external validity.31,32 For that, the selection of both impression techniques and protocol was planned prior to the trial.
Some authors maintain that the use of a CIIC avoids the collapse of the emergence profile, thus allowing the replication from the patient’s mouth to a gypsum cast, which could contribute to the optimization of health and esthetic outcomes by creating an individualized anatomical profile.6,33,34 Nevertheless, the quantification of preventable soft tissue changes by this additional clinical step has not been reported in the literature. Until now, the criteria to evaluate cosmetic success of the placement of single implants in the anterior maxilla were only 2D,4,19,20,35,36 with the use of visual indexes that usually account to the nearest 0.5 mm,37 disregarding soft tissue changes below that threshold, which this study chose to evaluate.
To do this, a 3D digital methodology was proposed by overlaying datasets obtained from intra and extraoral scanners, and discrepancies determined with sensitivity values well below the clinically detectable threshold.38 To ensure a valid comparison, two mesial and distal adjacent teeth and surrounding soft tissues around them were considered as reference between STL files and the resulting discrepancies identified as trueness inherent to the method.
The use of IOS is becoming mainstream for implant impressions,17,39 with distinct advantages when comparing with the use of conventional silicone based techniques, particularly where soft tissue compression is concerned,21,40 and the mapping of peri-implant tissue contours becomes even more important. Although the accuracy of scanning devices is well documented, with several in vitro studies describing results ranging between 19 and 112 μm, which are well within clinically accepted values,17,41 the accuracy between intra and extraoral scanners should be ascertained with more in vivo controlled studies,8 thus providing
15
the methodological proof for its use in clinical setting studies. The results obtained for trueness showed a mean RMS of 51.08 [45.68; 56.47] μm for teeth and 60.46 [52.29; 68.62] μm for surrounding soft tissues, which can be considered within the clinically acceptable values, as previously described in the literature,8,42 thus validating the proposed methodology for 3D soft tissues changes assessment.
The use of CIIC in the esthetic area has been advocated by a number of authors.6,33,43 However, it is not yet clear the extent of preventable soft tissue changes using this technique when compared with the use of an IOS. To the best of our knowledge, it is the first time that a clinical study has effectively quantified volumetric soft tissue changes by superimposing the STL datasets of different techniques, which were translated into color codes, representing the RMS differences between corresponding points, equating to a Hedges’ g of 1.52, which is considered to be a significantly large effect size, attributable to soft tissue changes in replication by means of the use of an intraoral scanner. These results allow us to state that, in this study, the use of CIIC could at least prevent a difference of 200 μm of peri-implant soft tissue changes. From a pragmatic standpoint, the minimal clinically important difference (MCID) can be described as the “smallest difference in score in the domain of interest perceived as important or beneficial by the patients, clinicians, researchers or others, which would mandate, in the absence of troublesome side effects and excessive cost, a chance in patients management.”44,45 The MCID, therefore, should constitute a threshold for outcome scores,46,47 and in the context of this study if we consider the visually detectable limit used in soft tissue indexes of 500 μm, the results obtained from this study, even with statistical significance, might not relate to a clinically important difference.
Once the provisional restoration is removed, a progressive collapse of soft tissues is meant to occur, with possible time-dependent changes of the supra-implant mucosa architecture.12,48 Compliance with the manufacturer’s instructions is of foremost importance, as it allows for a two-step protocol with immediate emergence profile scanning after provisional restoration removal, followed by scan body placement and scanning, thus decreasing the time-dependent soft tissue changes.
However, when the RMS analysis was performed between the different sides in the peri-implant soft tissues, it was not possible to detect significant differences between them. This may be due to the fact that the use of an IOS immediately after the provisional restoration
16
removal without soft tissue compression may lead to smaller and more evenly dispersed changes.
This study has its limitations: regarding the proposed 3D method, one of the key factors is the variability determined by the pre-determined areas. To reduce variability, only one operator performed three replicates of all measurements, assessing the mean discrepancy value between models, with each measurement corresponding to the RMS of approximately 1 mm2 area, as shown in Figure 4. Also, a previous validation step was performed to determine the sensitivity of the method which, according to the data obtained, was below the visually clinical detectable threshold.49 Six patients were included in the study, which allowed for a statistically significant effect size with 80% power and P < .05 between groups, but due to the sample size, implant depth or type of connection, correlations were unable to be performed. As peri-implant mucosa is influenced by bone support, which results in different tissue collapse patterns,50 intrinsic parameters such as gingival biotype, brand, diameter or type of implant, depth or distance from adjacent teeth should be assessed in future studies.50,51 Furthermore, although a statistically significant difference in peri-implant emergence profile soft tissues was detected, the clinical impact of such changes in the esthetic outcomes of the definitive rehabilitation is still to be determined.
17 5 – CONCLUSION
Taken together, the results of this study suggest that the proposed technique allows for the 3D determination of peri-implant tissue changes with higher sensitivity than visual techniques, thus presenting itself as a promising alternative in clinical studies and that the use of a customized implant impression coping allows for better soft tissue emergence profile replication, although the detected differences are below the clinically detectable threshold. Further studies should include effectiveness analysis of the different impression techniques.
18 6 – REFERENCES
1. Cosyn J, Thoma DS, Hammerle CH, De Bruyn H. Esthetic assessments in implant dentistry: objective and subjective criteria for clinicians and patients. Periodontol 2000. 2017;73(1):193-202.
2. Iasella JM, Greenwell H, Miller RL, Hill M, Drisko C, Bohra AA, et al. Ridge preservation with freeze-dried bone allograft and a collagen membrane compared to extraction alone for implant site development: a clinical and histologic study in humans. J Periodontol. 2003;74(7):990-9.
3. Mangano FG, Mangano C, Ricci M, Sammons RL, Shibli JA, Piattelli A. Esthetic evaluation of single-tooth Morse taper connection implants placed in fresh extraction sockets or healed sites. J Oral Implantol. 2013;39(2):172-81.
4. Furhauser R, Florescu D, Benesch T, Haas R, Mailath G, Watzek G. Evaluation of soft tissue around single-tooth implant crowns: the pink esthetic score. Clin Oral Implants Res. 2005;16(6):639-44.
5. Raes F, Cosyn J, De Bruyn H. Clinical, aesthetic, and patient-related outcome of immediately loaded single implants in the anterior maxilla: a prospective study in extraction sockets, healed ridges, and grafted sites. Clin Implant Dent Relat Res. 2013;15(6):819-35.
6. Hinds KF. Custom impression coping for an exact registration of the healed tissue in the esthetic implant restoration. Int J Periodontics Restorative Dent. 1997;17(6):584-91.
7. Touati B. Custom-guided tissue healing for improved aesthetics in implant-supported restorations. Int J Dent Symp. 1995;3(1):36-9.
8. Alsharbaty MHM, Alikhasi M, Zarrati S, Shamshiri AR. A Clinical Comparative Study of 3-Dimensional Accuracy between Digital and Conventional Implant Impression Techniques. J Prosthodont. 2019;28(4):e902-e8.
9. Cosyn J, Eghbali A, Hanselaer L, De Rouck T, Wyn I, Sabzevar MM, et al. Four modalities of single implant treatment in the anterior maxilla: a clinical, radiographic, and aesthetic evaluation. Clin Implant Dent Relat Res. 2013;15(4):517-30.
10. Ajioka H, Kihara H, Odaira C, Kobayashi T, Kondo H. Examination of the Position Accuracy of Implant Abutments Reproduced by Intra-Oral Optical Impression. PLoS One. 2016;11(10):e0164048.
11. Flugge TV, Att W, Metzger MC, Nelson K. Precision of Dental Implant Digitization Using Intraoral Scanners. Int J Prosthodont. 2016;29(3):277-83.
19
12. Joda T, Wittneben JG, Bragger U. Digital implant impressions with the "Individualized Scanbody Technique" for emergence profile support. Clin Oral Implants Res. 2014;25(3):395-7.
13. Stimmelmayr M, Guth JF, Erdelt K, Edelhoff D, Beuer F. Digital evaluation of the reproducibility of implant scanbody fit--an in vitro study. Clin Oral Investig. 2012;16(3):851-6.
14. Guth JF, Runkel C, Beuer F, Stimmelmayr M, Edelhoff D, Keul C. Accuracy of five intraoral scanners compared to indirect digitalization. Clin Oral Investig. 2017;21(5):1445-55.
15. Lee SJ, Betensky RA, Gianneschi GE, Gallucci GO. Accuracy of digital versus conventional implant impressions. Clin Oral Implants Res. 2015;26(6):715-9.
16. Ahlholm P, Sipila K, Vallittu P, Jakonen M, Kotiranta U. Digital Versus Conventional Impressions in Fixed Prosthodontics: A Review. J Prosthodont. 2018;27(1):35-41.
17. Imburgia M, Logozzo S, Hauschild U, Veronesi G, Mangano C, Mangano FG. Accuracy of four intraoral scanners in oral implantology: a comparative in vitro study. BMC Oral Health. 2017;17(1):92.
18. Klineberg IJ, Murray GM. Design of superstructures for osseointegrated fixtures. Swed Dent J Suppl. 1985;28:63-9.
19. Benic GI, Wolleb K, Sancho-Puchades M, Hammerle CH. Systematic review of parameters and methods for the professional assessment of aesthetics in dental implant research. J Clin Periodontol. 2012;39 Suppl 12:160-92.
20. Meijer HJ, Stellingsma K, Meijndert L, Raghoebar GM. A new index for rating aesthetics of implant-supported single crowns and adjacent soft tissues--the Implant Crown Aesthetic Index. Clin Oral Implants Res. 2005;16(6):645-9.
21. Mangano FG, Luongo F, Picciocchi G, Mortellaro C, Park KB, Mangano C. Soft Tissue Stability around Single Implants Inserted to Replace Maxillary Lateral Incisors: A 3D Evaluation. Int J Dent. 2016;2016:9393219.
22. Sim JY, Jang Y, Kim WC, Kim HY, Lee DH, Kim JH. Comparing the accuracy (trueness and precision) of models of fixed dental prostheses fabricated by digital and conventional workflows. J Prosthodont Res. 2019;63(1):25-30.
23. Ender A, Mehl A. Accuracy of complete-arch dental impressions: a new method of measuring trueness and precision. J Prosthet Dent. 2013;109(2):121-8.
20
24. Patzelt SB, Emmanouilidi A, Stampf S, Strub JR, Att W. Accuracy of full-arch scans using intraoral scanners. Clin Oral Investig. 2014;18(6):1687-94.
25. Anh JW, Park JM, Chun YS, Kim M, Kim M. A comparison of the precision of three-dimensional images acquired by 2 digital intraoral scanners: effects of tooth irregularity and scanning direction. Korean J Orthod. 2016;46(1):3-12.
26. Buda M, Bratos M, Sorensen JA. Accuracy of 3-dimensional computer-aided manufactured single-tooth implant definitive casts. J Prosthet Dent. 2018;120(6):913-8.
27. Durlak JA. How to select, calculate, and interpret effect sizes. J Pediatr Psychol. 2009;34(9):917-28.
28. Hedges L. Distribution Theory for Glass's Estimator of Effect size and Related Estimators. Journal of Educational Statistics. 1981;6(2):107-28.
29. Hedges L, Olkin I. Statistical Methods for Meta-Analysis. Academic Press. 1985.
30. Lenhard W, Lenhard A. Calculation of effect sizes [Available from:
https://www.psychometrica.de/effect_size.html.
31. Williams HC, Burden-Teh E, Nunn AJ. What is a pragmatic clinical trial? J Invest Dermatol. 2015;135(6):1-3.
32. Zwarenstein M, Treweek S, Gagnier JJ, Altman DG, Tunis S, Haynes B, et al. Improving the reporting of pragmatic trials: an extension of the CONSORT statement. BMJ. 2008;337:a2390.
33. Velasquez D, Yaneth JC, Kaliks JF. Comparison of Direct and Indirect Techniques to Develop Customized Implant Impression Copings: A Pilot Study. Int J Periodontics Restorative Dent. 2015;35(4):525-31.
34. Su H, Gonzalez-Martin O, Weisgold A, Lee E. Considerations of implant abutment and crown contour: critical contour and subcritical contour. Int J Periodontics Restorative Dent. 2010;30(4):335-43.
35. Hosseini M, Gotfredsen K. A feasible, aesthetic quality evaluation of implant-supported single crowns: an analysis of validity and reliability. Clin Oral Implants Res. 2012;23(4):453-8.
36. Vilhjalmsson VH, Klock KS, Storksen K, Bardsen A. Aesthetics of implant-supported single anterior maxillary crowns evaluated by objective indices and participants' perceptions. Clin Oral Implants Res. 2011;22(12):1399-403.
21
37. Lafzi A, Mohammadi AS, Eskandari A, Pourkhamneh S. Assessment of Intra- and Inter-examiner Reproducibility of Probing Depth Measurements with a Manual Periodontal Probe. J Dent Res Dent Clin Dent Prospects. 2007;1(1):19-25.
38. Thomas M, Reddy R, Reddy BJ. Perception differences of altered dental esthetics by dental professionals and laypersons. Indian J Dent Res. 2011;22(2):242-7.
39. Moreira AH, Rodrigues NF, Pinho AC, Fonseca JC, Vilaca JL. Accuracy Comparison of Implant Impression Techniques: A Systematic Review. Clin Implant Dent Relat Res. 2015;17 Suppl 2:e751-64.
40. Zimmermann M, Mehl A, Mormann WH, Reich S. Intraoral scanning systems - a current overview. Int J Comput Dent. 2015;18(2):101-29.
41. Bohner L, Gamba DD, Hanisch M, Marcio BS, Tortamano Neto P, Lagana DC, et al. Accuracy of digital technologies for the scanning of facial, skeletal, and intraoral tissues: A systematic review. J Prosthet Dent. 2019;121(2):246-51.
42. McLean JW, von Fraunhofer JA. The estimation of cement film thickness by an in vivo technique. Br Dent J. 1971;131(3):107-11.
43. Grizas E, Kourtis S, Andrikopoulou E, Romanos GE. A detailed decision tree to create, preserve, transfer, and support the emergence profile in anterior maxillary implants using custom abutments. Quintessence Int. 2018;49(5):349-64.
44. Jaeschke R, Singer J, Guyatt GH. Measurement of health status. Ascertaining the minimal clinically important difference. Control Clin Trials. 1989;10(4):407-15.
45. de Vet HC, Terwee CB, Ostelo RW, Beckerman H, Knol DL, Bouter LM. Minimal changes in health status questionnaires: distinction between minimally detectable change and minimally important change. Health Qual Life Outcomes. 2006;4:54.
46. Liang MH. Longitudinal construct validity: establishment of clinical meaning in patient evaluative instruments. Med Care. 2000;38(9 Suppl):II84-90.
47. Beaton DE, Boers M, Wells GA. Many faces of the minimal clinically important difference (MCID): a literature review and directions for future research. Curr Opin Rheumatol. 2002;14(2):109-14.
48. Monaco C, Scheda L, Baldissara P, Zucchelli G. Implant Digital Impression in the Esthetic Area. J Prosthodont. 2018.
49. Kokich VO, Kokich VG, Kiyak HA. Perceptions of dental professionals and laypersons to altered dental esthetics: asymmetric and symmetric situations. Am J Orthod Dentofacial Orthop. 2006;130(2):141-51.
22
50. Chen ST, Buser D. Esthetic outcomes following immediate and early implant placement in the anterior maxilla--a systematic review. Int J Oral Maxillofac Implants. 2014;29 Suppl:186-215.
51. Ross SB, Pette GA, Parker WB, Hardigan P. Gingival margin changes in maxillary anterior sites after single immediate implant placement and provisionalization: a 5-year retrospective study of 47 patients. Int J Oral Maxillofac Implants. 2014;29(1):127-34.


![Figure 8 - Boxplot of RMS (mean ± 95% CI) overall differences between methods for different tissues [n = 6 patients with 108-180 locations per tissue]](https://thumb-eu.123doks.com/thumbv2/123dok_br/15504093.1046271/27.893.233.660.728.1038/figure-boxplot-overall-differences-methods-different-patients-locations.webp)
