i
Predictive Analytics applied to Alzheimer’s
Disease: A Data Visualisation Framework for
Understanding Current Research and Future
Challenges
Hugo Alexandre Martins Esteves
Dissertation as a partial requirement for obtaining the
master’s degree in information management
i
201
2
NOVA Information Management School
Instituto Superior de Estatística e Gestão de Informação
Universidade Nova de Lisboa
PREDICTIVE ANALYTICS APPLIED TO ALZHEIMER'S DISEASE: A DATA
VISUALIZATION FRAMEWORK FOR UNDERSTANDING CURRENT
RESEARCH AND FUTURE CHALLENGES
by
Hugo Alexandre Martins Esteves
Dissertation as a partial requirement for obtaining a master’s degree in information management, with a specialisation in Business Intelligence and Knowledge Management.
Advisor: Prof. Mauro Castelli
3
DEDICATION
“What would life be if we had no courage to attempt anything.”, Vincent Van Gogh
4
ACKNOWLEDGEMENTS
Firstly, my sincere and honest gratefulness to Professor Mauro Castelli, from Nova IMS for believing in this work’s idea; for continually believing in me; for never letting go this project until its completion; for his availability for taking this project forward; for all the support provided during the ups and downs; for all his honest, insightful and valuable contributions and knowledge sharing.
My honest thank you for Professor Pedro Cabral, from Nova IMS, for all the guidance during the idea conceptualisation, who helped me shaping and reshaping the overall idea of the work despite a moment of uncertainty, and who boosted my confidence in an early stage for carrying on with this contribution for the scientific community.
My strong appreciation for Eng. João Leal and Eng. Bruno Valente, from José de Mello Saúde, for their valuable insights about the reality in the private sector, for their availability for active collaboration, and all the genuine help provided on trying to get reliable medical data
To Ana Esteves for her knowledge sharing about the state of the art of data visualisation techniques and publications, which quickly became the inspiration foundation for part of the developed work.
5
ABSTRACT
Big Data is, nowadays, regarded as a tool for improving the healthcare sector in many areas, such as in its economic side, by trying to search for operational efficiency gaps, and in personalised treatment, by selecting the best drug for the patient, for instance. Data science can play a key role in identifying diseases in an early stage, or even when there are no signs of it, track its progress, quickly identify the efficacy of treatments and suggest alternative ones. Therefore, the prevention side of healthcare can be enhanced with the usage of state-of-the-art predictive big data analytics and machine learning methods, integrating the available, complex, heterogeneous, yet sparse, data from multiple sources, towards a better disease and pathology patterns identification. It can be applied for the diagnostic challenging neurodegenerative disorders; the identification of the patterns that trigger those disorders can make possible to identify more risk factors, biomarkers, in every human being. With that, we can improve the effectiveness of the medical interventions, helping people to stay healthy and active for a longer period. In this work, a review of the state of science about predictive big data analytics is done, concerning its application to Alzheimer’s Disease early diagnosis. It is done by searching and summarising the scientific articles published in respectable online sources, putting together all the information that is spread out in the world wide web, with the goal of enhancing knowledge management and collaboration practices about the topic. Furthermore, an interactive data visualisation tool to better manage and identify the scientific articles is develop, delivering, in this way, a holistic visual overview of the developments done in the important field of Alzheimer’s Disease diagnosis.
KEYWORDS
Big Data; Alzheimer’s disease; Predictive Modelling; Predictive analytics; Data Mining; Decision Support Systems; Data Visualization; Knowledge Management; Information Systems; Information Management
6
RESUMO
Big Data é hoje considerada uma ferramenta para melhorar o sector da saúde em muitas áreas, tais como na sua vertente mais económica, tentando encontrar lacunas de eficiência operacional, e no tratamento personalizado, selecionando o melhor medicamento para o paciente, por exemplo. A ciência de dados pode desempenhar um papel fundamental na identificação de doenças em um estágio inicial, ou mesmo quando não há sinais dela, acompanhar o seu progresso, identificar rapidamente a eficácia dos tratamentos indicados ao paciente e sugerir alternativas. Portanto, o lado preventivo dos cuidados de saúde pode ser bastante melhorado com o uso de métodos avançados de análise preditiva com big data e de machine learning, integrando os dados disponíveis, geralmente complexos, heterogéneos e esparsos provenientes de múltiplas fontes, para uma melhor identificação de padrões patológicos e da doença. Estes métodos podem ser aplicados nas doenças neurodegenerativas que ainda são um grande desafio no seu diagnóstico; a identificação dos padrões que desencadeiam esses distúrbios pode possibilitar a identificação de mais fatores de risco, biomarcadores, em todo e qualquer ser humano. Com isso, podemos melhorar a eficácia das intervenções médicas, ajudando as pessoas a permanecerem saudáveis e ativas por um período mais longo. Neste trabalho, é feita uma revisão do estado da arte sobre a análise preditiva com big data, no que diz respeito à sua aplicação ao diagnóstico precoce da Doença de Alzheimer. Isto foi realizado através da pesquisa exaustiva e resumo de um grande número de artigos científicos publicados em fontes online de referência na área, reunindo a informação que está amplamente espalhada na world wide web, com o objetivo de aprimorar a gestão do conhecimento e as práticas de colaboração sobre o tema. Além disso, uma ferramenta interativa de visualização de dados para melhor gerir e identificar os artigos científicos foi desenvolvida, fornecendo, desta forma, uma visão holística dos avanços científico feitos no importante campo do diagnóstico da Doença de Alzheimer.
PALAVRAS-CHAVE
Big Data; Doença de Alzheimer; Modelação e análise preditiva; data mining; sistemas de suporte à decisão; visualização de dados; gestão do conhecimento; sistemas de informação; gestão de informação
7
TABLE OF CONTENTS
1.
Introduction ... 13
2.
Literature Review ... 17
2.1.
Big Data and Predictive Analytics in Healthcare ... 17
2.1.1.
The Rise of Big Data... 17
2.1.2.
From Big to Smart Data ... 20
2.2.
Neurodegenerative Disease’s Diagnosis ... 21
2.2.1.
Predictive Analytics Applied to Alzheimer’s Disease Discovery... 23
2.2.2.
Biomarkers and Data Sources ... 24
2.2.3.
Information Availability and Management ... 25
2.3.
Data Visualization ... 26
2.4.
Visualise to Communicate ... 26
2.4.1.
Data Visualization for Scholarly Data ... 27
3.
Methodology ... 29
3.1.
Research Articles and Publication Collection ... 29
3.1.1.
Sources Selection ... 29
3.1.2.
Search Keywords Selection ... 29
3.1.3.
Article Abstract Analysis ... 31
3.1.4.
Descriptive Analysis ... 31
3.2.
Database Development ... 32
3.2.1.
Data Extraction Model ... 32
3.2.2.
The Analogy with Business Intelligence ... 34
3.2.3.
Content Mapping ... 35
3.3.
Data Visualization Framework Development ... 38
3.3.1.
Preliminary Assessment ... 38
3.3.2.
Tool Selection ... 41
3.3.3.
Design, UI and UX ... 42
4.
Results & Discussion ... 45
4.1.
Scientific Publication Database ... 45
4.1.1.
Transactional Relational Database ... 45
4.1.2.
Data Analysis ... 46
4.2.
Interactive Data Visualization Framework ... 53
4.2.1.
Dashboard Description ... 54
8
5.
Conclusion ... 63
6.
Limitations and Future Work ... 65
Bibliography and References ... 66
Annex ... 73
Extra Data Analysis ... 73
Power BI Implementation ... 76
9
LIST OF FIGURES
Figure 1 –Framework with a multilevel integration of heterogeneous patient information
generated by different data sources (Cano et al., 2017). ... 19
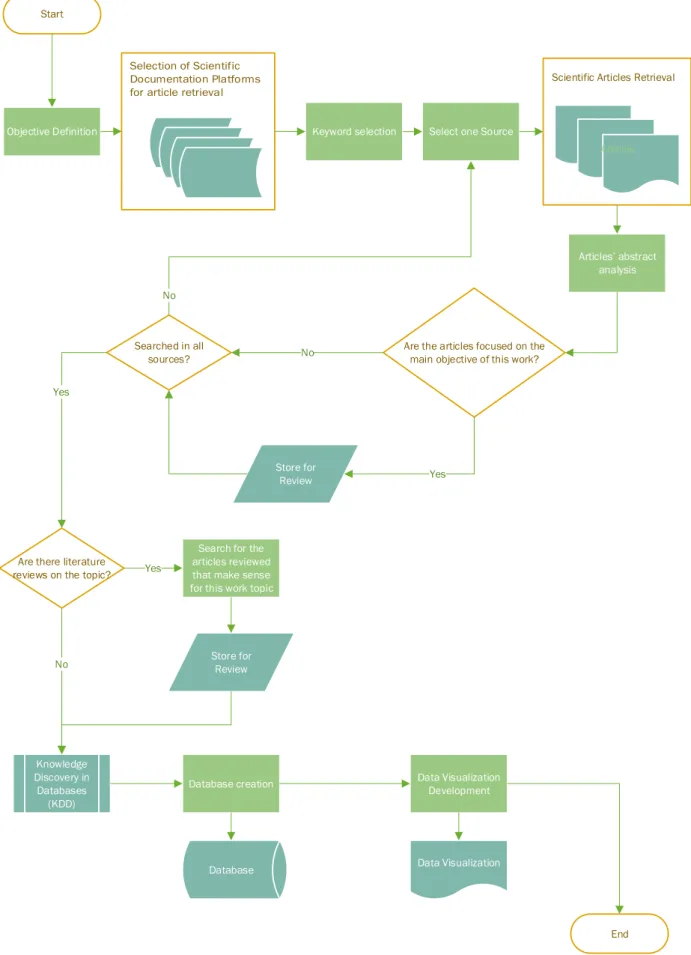
Figure 2 – Flow chart explaining the methodology followed in this work. ... 30
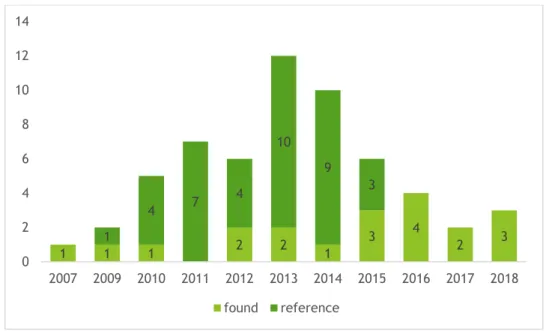
Figure 3 – Total number of scientific articles found and included in the database, either by using
the search criteria or through reference articles, per year of publication. ... 31
Figure 4 – Total number of scientific articles found and to be included in the database, per its
journal/publication. ... 32
Figure 5 - CRISP-DM methodology ... 33
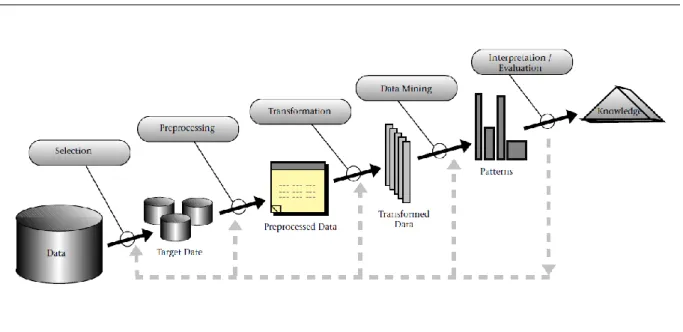
Figure 6 - An Overview of the KDD Process (Fayyad, Piatetsky-Shapiro, & Smyth, 1996). ... 33
Figure 7 - Knowledge Discovery in Databases and Data Mining. ... 34
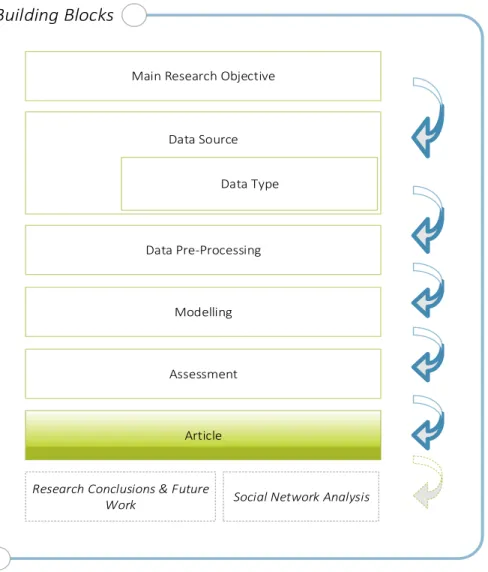
Figure 8 – Building blocks of the Data Visualization Framework Conceptual Model. ... 43
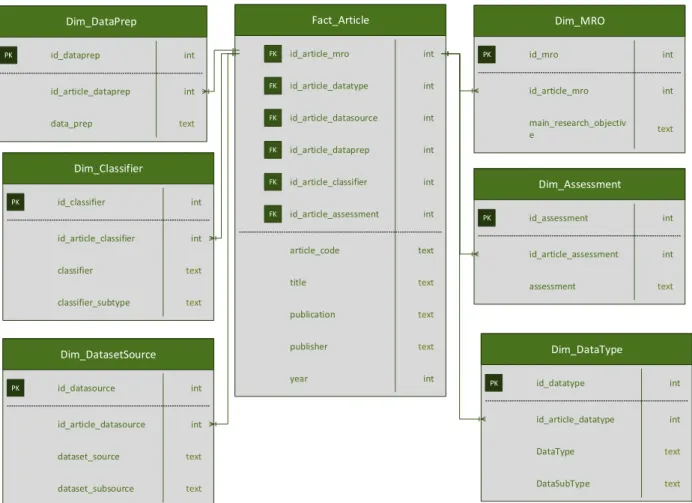
Figure 9 – Star Schema shaped Transactional Relational Database. ... 45
Figure 10 – Total number and distribution of the Main Research Objectives of the research
articles. ... 47
Figure 11 – Total number of Data Types used in the research studies. ... 48
Figure 12 – List of the data sources used by the researchers in their studies. ... 50
Figure 13 – List of Classifiers and its Occurrence in the articles found. ... 51
Figure 14 – List of the assessment metrics used to evaluate the models’ performance and its
usage frequency over the articles found. ... 53
Figure 15 – Research Flow. ... 54
Figure 16 – Research Flow Simplified. ... 55
Figure 17 - Main Research Objective, Data Types, Data Source. ... 55
Figure 18 - Data Types dashboard. ... 56
Figure 19 - Data Sources. ... 57
Figure 20 - Data Source & Type Subcategory. ... 57
Figure 21 – Data Pre-Processing. ... 58
Figure 22 – Classifiers. ... 59
Figure 23 - Classifier Sub Category... 59
Figure 24 - Assessment Methods. ... 60
Figure 25 - Radial Journey of Articles. ... 61
Figure 26 – List of Data Pre-Processing methods used in the studies found. ... 75
Figure 27 – Implementation of the relational database in Power BI. ... 76
10
LIST OF TABLES
Table 1 – The three Vs of big data ... 18
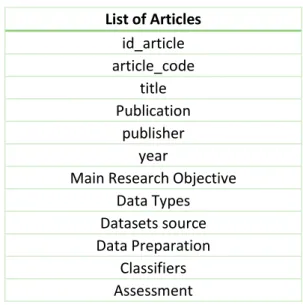
Table 2 – Fields that compose the Baseline for the DB development... 35
Table 3 – Data types, dataset sources and classifiers used in AD research. ... 36
Table 4 – List of Tools Without Programming Language. ... 39
Table 5 – Tools/Frameworks that Require Programming. ... 41
Table 6- Criteria assessment for the Tableau, Power BI and D3.js. ... 42
Table 7 –KDD statistics for the articles included in the database. ... 46
Table 8 – Data Types and “Subtypes” list. ... 48
Table 9 – List of other dataset sources. ... 50
Table 10 – List of “classifier subtype”. ... 52
Table 11 – Number of articles the according to their main study objective. ... 73
Table 12 – Number of Items in the Analytical Process per Article. ... 73
11
LIST OF ACRONYMS AND ABBREVIATIONS
AD Alzheimer's Disease
AD-PS Alzheimer's Disease Pattern Similarity ADAS-Cog Ad Assessment Cognitive Scale
ADNI Disease Neuroimaging Initiative Database AVLT Auditory Verbal Learning Test
BOPEL Bayesian Outcome Prediction with Ensemble Learning CaMCCo Cascaded Multiview Canonical Correlation
CDR Clinical Dementia Rating
CVLT-LDTR California Verbal Learning Test Long Delayed Total Recall
DARTEL Diffeomorphic Anatomical Registration Through Exponentiated Lie Algebra
DSI Disease State Index
DSI Statistical Disease State Index
DT Decision Tree
EMR Electronic Medical Records
EN-RLR Elastic Net Regularized Logistic Regression
ESR Erythrocyte Sedimentation Rate
ESTI Stands for The Parameter Estimation Error
GDS Geriatric Depression Scale
GP-LR Bayesian Gaussian Process Logistic Regression GR-NN General Regression Neural Network
GRNN Generalized Regression Neural Network
HGM-FS High-Order Graph Matching Based Feature Selection iMSF Multi-Source Feature Learning Method
iSFS Incomplete Source Feature Selection LDA Linear Discriminant Analysis
LDS Low-Density Separation
LLE Locally Linear Embedding
LR Logistic Regression
MCI Mild Cognitive Impairment
MH Modified Hachinski
MKL Multiple Kernel Learning
MMSE Mini-Mental State Examination
mRMR Minimum Redundancy Maximum Relevance
MSE Mean Squared Error
NB Neuropsychological Battery
NIQ Neuropsychiatric Inventory Questionnaire NPI-Q Neuropsychiatric Inventory Questionnaire NPSE Neuro-Psychological Status Exams
OPLS Orthogonal Partial Least Squares to Latent Structures
PET Positron Emitting Tomography
PMCI Progressive Mild Cognitive Impairment
PPV Positive Predictive Value
12 rDAm Randomized Denoising Autoencoder Marker
RF Random Forest
RLR Regularized Logistic Regression RMSE Root Mean Square Prediction Error SMCI Stable Mild Cognitive Impairment
SMML Sparse Multimodal Learning
SMOTE Synthetic Minority Over-Sampling Technique SNP Genetic Modality Single-Nucleotide Polymorphism
SOM Self-Organising Maps
SVD Singular Value Decomposition
WHIMS-MRI Women's Health Initiative Magnetic Resonance Imaging Study WRAP Wisconsin Registry For Alzheimer’s Prevention
13
1. INTRODUCTION
There are more than 47 million people that have from dementia worldwide at the present moment (Prince, Comas-Herrera, Knapp, Guerchet, & Karagiannidou, 2016). The forecasts tell us that the number will double by 2030 and more than triple by 2050, reaching more than 131 million by that year, as populations ages. Moreover, the diagnostic coverage is low among people that live with dementia, being between 40% to 50% worldwide, even in most high-income countries, whereas less than 10% of cases are diagnosed in low and middle-income countries, (Prince et al., 2016).
The most common cause of dementia is Alzheimer’s Disease (AD), which accounts for an estimated 60 to 80 per cent of cases (Prince et al., 2016). About half of these cases involve Alzheimer’s pathology solely; many have evidence of pathologic changes related to other dementias. Moreover, between the year 2000 and 2014, deaths resulting from stroke, heart disease, and prostate cancer decreased 21%, 14%, and 9%, respectively, whereas deaths from AD increased 89% during that period (Association, 2017).
Another aspect that is worth mentioning is the enormous neurodegenerative diseases’ economic impact, being the US $818 billion the estimated worldwide cost of dementia and expected to become a trillion dollar disease by 2018 (Prince et al., 2016), exceeding the combined current market values of Apple and Google. We already know that dementia is bringing tremendous costs for the society, at many levels (Wang, Kung, & Byrd, 2015; Wang, Kung, Wang, & Cegielski, 2017), as the burden is increasing with the population ageing in the most developed countries. In fact, in 2016, more than 15 million family members and other unpaid caregivers provided an estimated 18.2 billion hours of care to people with Alzheimer's or other dementias, which accounts to an estimated unpaid work of more than $230 billion (Association, 2017).
In recent years there have been intense efforts to develop and validate AD biomarkers, including those detectable with brain imaging, in the blood and using cerebrospinal fluid, have intensified. Such efforts will transform the practice of diagnosing AD from cognitive and functional symptoms focused to a biomarker-based diagnosis. This new approach promotes an earlier stage accurate diagnosis of disease and potentially leads to a more accurate understanding of AD prevalence and incidence. At the same time there has been intense focus on neurodegenerative pathologies and on Alzheimer’s Disease, not only by the research community but also by the most critical stakeholders in the world's healthcare ecosystem, such as universities, research institutions, pharma industry, venture capital investment firms and philanthropic foundations, such as Bill Gates Foundation (Bill Gates, 2017).
Although the Electronic Health Records (EHR) have been long seen as one import missing element for unlocking the potential of deeper research areas in medical practice (Prather et al., 1997), in which correlations and patterns identification could provide more in-depth knowledge, the accumulation of massive quantities of data and information about patients and their medical conditions in clinical databases has only started recently. With that, the need to work that data rose and, consequently, data science started to be more known and even became a discipline in computer sciences. From there to the “big data” concept was only a matter of a couple of years, being accelerated, in particular, in the biomedical area, due to the decoding and complete sequencing of the human genome. In fact, “big data”, which is considered a hype for some due to its daily banalization in the IT-driven industries, has gained much attention recently, at the same pace as the EHRs, particularly in areas of biomedicine where society still face clear unmet medical needs. One can easily find “big data” associated with a new tool for complex
14 problem solving (Hofmann-Apitius, 2015), big data approaches seem to open promising perspectives for a better understanding of complex neurodegenerative diseases. Therefore, big data principles and techniques have been thought to have tremendous potential in the dementia-related research. We live in a world where technologies and the needed computational power are already available for that; those might unlock many possibilities for knowledge discovery. With a quick search in the www, one can easily find that healthcare practices are becoming more and more empowered through data science, machine learning and artificial intelligence.
Following that “big data promise”, many studies have been addressing Alzheimer’s disease diagnosis, prognosis, predicting its evolution in patients, and many other relevant scientific breakthroughs using data science methods and using the available research datasets. This wealth of information that comes out of the scientific researches is becoming increasingly difficult to follow, jeopardising the potential of a more collaborative approach for incremental innovation.
Therefore, with so many advances, articles and scientific papers published, a newcomer to the field might ask why we still haven’t found all the disease patterns that would lead to a cure or the delay in the disease evolution in each patient. What if we could predict that someone will develop AD way before the symptoms even show up, with some degree of certainty? Perhaps we are still far behind that goal, but the latest scientific developments are helping us to discover hidden patterns in the data, either from genomics, proteomics, and many more, data of all kinds, to get there. Firstly, we need to tackle the problems of an accurate and timely diagnosis, which has been a real struggle. It is a path that we must walk with a collaborative and incremental innovative mindset. Thus, it is of the utmost necessity that we build integrative data and information management systems, that can act as the foundation for the research to take the most advantage of the quantity of health data that we collect.
This dissertation is a small step towards that end. Information was gathered and organised from many scientific publications about the application of predictive analytics to the Alzheimer’s Disease discovery, trying to tap the question of what has been done so far, what methods and datasets were used, which are the ones that were not tried yet, and so on. The answer could lead to the conclusion that it is not straightforward to gather information about what was already done by the scientific community concerning neurodegenerative diseases. However, we might ask instead whether the scientific community is working towards an integrative approach to the datasets available and to the methodologies used to extract knowledge from it. Considering the latest scientific publications in the field can we say that we are, as a society, working to truly unlock the big data analytics potential for a more accurate, and applicable, prediction of AD’s development in each human being, even before the symptoms’ manifestation? Have we already tested all the predictive models, datasets, biomarkers, feature selection methods, to name a few, that we could think of?
These questions are addressed in this work through its three main objectives : firstly through an in-depth scientific literature review for the identification of the relevant science in the area; then by the extraction of the relevant data science-related content from the scientific publications found, such as the predictive models used in them; and then the development of a framework for an interactive data visualization solution to enhance the comprehension of those answers.
Furthermore, this work aims to address the gap of how difficult it is to gather the correct information for a compelling visualization of what was already done and what is still to be done; it also tackles a need in the scientific community of having integrative and truly collaborative information management systems,
15 by gathering and summarising all the scientific articles stored in specific online individualised databases about the usage of predictive analytics applied to AD discovery. It is a tentative to enhance the information management practices towards better and faster collaboration systems on the topic of AD’s prediction and prevention.
To achieve that, the primary goal of this dissertation is to provide an objective and complete overview of state of the art regarding the application of predictive analytics and big data analytics in the early detection of the AD. That one can find in chapter 2.
The method used for the search of relevant publications in the field and the methods used for the analysis and categorisation of data science-related content are presented in Chapter 3. In that chapter, one can find the thought process that led to the filtering and clustering of the articles found by the type of data, datasets, the feature selection methods applied, the learning and classification algorithms used or developed.
With so many contributors in the scientific community in the field of predictive analytics and machine learning applied to neurodegenerative diseases, there is the need to start converging to a common ground of knowledge gathering and sharing, to foster quicker collaboration and innovation in the field. Moreover, with so many scientific articles repositories spread out in the world wide web, the urge of making those scientific developments and publications visible in one place and in a user-friendly way becomes more significant than before. In the words of the current United Nations’ Deputy Secretary-General, “we need to develop data literacy, innovative tools and data visualisation platforms, which allow users to understand data intuitively and interact seamlessly with data in real time.”.
To help to achieve that goal, focused on a specific research topic, Alzheimer’s Disease, a data visualisation framework was developed. “We visualise to communicate a point” (Evergreen, 2016), to enhance our communication efficacy when complexity is involved. Data visualisation became a relevant field of computer science, not much because it is a brand-new area which requires a blend of new professional skills, but mostly because we need to communicate better the insights collected from the worked data. With data, we gather information. With information we can show the story, transforming complexity into simplicity. That will help us to create knowledge.
However, there are no tools specifically for extracting the information about what was done in all the publications and articles of a specific field of research. There are, though, many research done about scholarly data visualisation (Liu et al., 2018), but that is mostly focused on authors, researchers, institutions, publication keywords, and so on. Furthermore, that data can then be a useful source of information to advance collaboration and a better understanding of the current state of the art in that research field. This information is vital not only for the scientific community in general but also for the institutional decision-makers and the general public, tapping into the “open science” concept, in the idea of augmenting the power of the collective intelligence.
With this in mind, in Chapter 4 one can find the methodology and tools used to develop the interactive data visualisation framework, aiming to provide an up to date, intuitive and user-friendly way not only to identify relevant articles in the field but also their contribution to the application of predictive analytics methods to the Alzheimer’s Disease discovery. The visualisation framework is based on the business intelligence software Microsoft Power BI Desktop, version 2.64, which provides the desired interactivity and flexibility layers to the solution.
16 In Chapter 5 the discussion of what has been achieved through this work is done, followed by a detailed explanation of the limitations of this work and by the conclusion. One can also find in this chapter the suggestions for future work.
Lastly, it is worth to point out that, despite following a structured approach supported by extensive literature, it is impossible to claim that all the published articles under the topic were found and reviewed. Moreover, the search process was guided by the combination of selected keywords used in predetermined online private publications databases, which provided reasonable confidence that it was possible to collect a relatively large sample of articles. It is, indeed, impossible to find all the scientific publications on a specific topic given the way the online publication market is structured.
17
2. LITERATURE REVIEW
2.1. Big Data and Predictive Analytics in Healthcare
We cannot deny it – the rise of information technologies has changed healthcare practices and industry forever. The amount of data stored in the healthcare facilities all over the world is gigantic. Clinics, hospitals, public and private research centres, and other private organisations have already accumulated large amounts of information about their patients and their medical conditions. Relationships and patterns within this data started to provide new medical knowledge. Since the beginning of the new century, methodologies have been developed and applied to discover this hidden knowledge, which started to be applied to a vast range of healthcare fields, such as obstetrics, where one could evaluate for factors potentially contributing to preterm birth (Prather et al., 1997). Since then, many developments on the area of data mining, undoubtedly the foundation of data science broad concept, were done, and all the methods necessary for accurate data modelling, descriptive and predictive analytics were as well improved and refined. Consequently, the rise of these methods allowed its application to advance healthcare practices in general and, in particular, access treatment effectiveness, healthcare management, customer relationship management, among others (Kaur & Wasan, 2006; Koh & Tan, 2005; Tomar & Agarwal, 2013).
2.1.1. The Rise of Big Data
In the last decade the rise of certain technologies, such as the Internet of Things (IoT) which lead to the proliferation of wearable sensors and the birth of the term eHealth, the mobile phone usage massification and the mobile electronic diagnostic systems for chronic disease symptoms tracking, which was responsible for the birth of the mHealth (Bhavnani, Narula, & Sengupta, 2016), have had a tremendous impact on the patient-generated data across the developed countries. With the resources available, we can now extract information and, hopefully, knowledge out of that increasing amount of big data generated. As a consequence of the rise of such data-driven approaches, clinical databases have gathered large quantities of information about patients and their medical conditions, from which relationships and patterns within this data could provide new medical knowledge. Consequently, there are an increasing number of Information and Communication Technology (ICT) companies trying to develop and evolve its systems and algorithms to become prime providers of analytical solutions for the healthcare sector, being one of the most famous ones the IBM Watson Health solution (Belle et al., 2015; Y. Chen, Argentinis, & Weber, 2016; Hoyt, Snider, Thompson, & Mantravadi, 2016; Pham, Tran, Phung, & Venkatesh, 2017; Sun & Reddy, 2013). The biggest challenge that those systems want to overcome lies in harnessing volumes of data, integrating the data from hundreds of sources, and understanding their various formats, so that advanced reasoning, predictive modelling, and machine learning techniques can be used to advance research faster.
Big data became a cornerstone of the future of healthcare. Big data in biomedicine and biotechnology is characterised by (Hofmann-Apitius, 2015) three main concepts, which are usually called The Three Vs of big data (Table 1): volume, velocity and variety. More recently, a fourth aspect has been added, veracity, which entails the issue of heterogenety of data quality and the need for curation. This is particularly important in medical related areas, where the quality of data (most of them are still annotations) varies tremendously.
18
Table 1 – The three Vs of big data
Volume
due to the massive “data flood” we experience in biomedicine from the developed data generating technologies and scientific advances such as genome sequencing, neuroimaging and informatisation of clinical procedures records (EHR);
Velocity not only associated with the processing of real-time data analysis but also with the heterogeneity of data as far as timescales are concerned.
Variety
a crucial step in big data analytics practices is the integration of
heterogeneous data, where shared semantics for metadata annotation play an important role.
Therefore, it is easy to understand that extracting information and knowledge from Big Data will improve the likelihood of tacking issues in healthcare more proficiently and faster, as well as evolving healthcare practices to evidence-based medicine, helping on genomic analytics, healthcare device and remote monitoring, patient profile analytics, among others (Raghupathi & Raghupathi, 2014). It has become so important that many studies have been published on the topic of big data and predictive analytics: the digitalization of healthcare (Bhavnani et al., 2016), diagnostics in healthcare from imaging (Ithapu et al., 2015), blood and cerebrospinal fluid (Association, 2017), and genomics-based analytics (Belle et al., 2015) and to many more problems in health sector (Huang et al., 2015). This is a clear evidence that a wide range of stakeholders in our society, have the desire to harness as fast as possible the data-driven technologies to address the healthcare challenges we will face in the future, being genomics, imaging and signal based analytics (Belle et al., 2015; Raghupathi & Raghupathi, 2014) the most promising big data analytics areas. These big data-based analytical areas have been applied to many difficult diseases such as breast and pancreatic cancer, diabetes, leukaemia, and many more (Belle et al., 2015).
Some years ago, the concept of “Computer-Aid Diagnosis” for management of medical big data for diagnosis purposes arose (Siuly & Zhang, 2016). According to some authors, the neurologists expect these systems to provide support in their decision-making process, helping them to how medical big data can be managed by computation intelligent system in neurological diseases diagnosis. Current diagnosis technologies, such as magnetic resonance imaging (MRI) and electroencephalogram (EEG), produce huge quantity data (in size and dimension) for detection, monitoring and treatment of neurological diseases. The next step is to have computerised diagnosis systems, called "computer-aided diagnosis (CAD)" that can automatically detect the neurological abnormalities combining all medical big data available for the patient in a holistic and integrative way. This system has the objective of improving consistency on disease diagnosis and on increasing, consequently, the success of treatment as well as on saving lives and reducing costs and time, consequently.
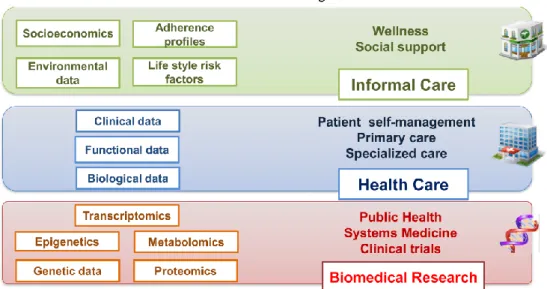
Furthermore, many frameworks have been proposed to uniformize the heterogeneity of the complex big healthcare data world. A Digital Health Framework (DHF) was developed with the goal to embrace the emerging requirements, in terms of data and tools, of applying systems medicine into healthcare (Cano, Tenyi, Vela, Miralles, & Roca, 2017), where there are different levels of medical data and information for
19 biomedical research (Figure 1). These kinds of frameworks, either specific to a particular area in medicine (Bochicchio, Cuzzocrea, & Vaira, 2016) or, instead, general ones (Sakr & Elgammal, 2016), have already been proposed and tested in real hospitals environments (Ojha & Mathur, 2016).
Figure 1 –Framework with a multilevel integration of heterogeneous patient information generated by different data sources (Cano et al., 2017).
However, like in everything in life, these Information technologies bring difficult challenges with them, which must be considered right at the development and implementation stages. Such an approach is crucial to creating trust in such systems, even more, when they are to be delivered in such sensitive area as Healthcare. The important aspect of data quality required for these systems to work properly is one of them, touching the “V” of veracity explained earlier. Other ones would be the entire lifecycle of health data, the problems arising from errors and inaccuracies in the data itself, the sources and the pedigree of data, and how the underlying purpose of data collection impact the analytic processing and knowledge expected to be derived (Sukumar, Natarajan, & Ferrell, 2015). Automation in the form of data handling, storage, entry and processing technologies should be thought as a tricky and hard balance to get. At one level, automation is what we all desire for speed and convenience, while it can create a different set of data quality issues as far as data management is concerned that can be hard to solve afterwards. It is worth noticing that although there are many studies about the potential benefits of big data and predictive analytics implementation for healthcare organizations management in real life, financially and operationally wise (Wang & Hajli, 2017; Wang et al., 2017), some of them even developing complex deep learning methods (Pham et al., 2017), this work does not focus on those aspects. Those applications are of great importance for the future of healthcare, so much that there have been some authors that have tried to summarize all the articles written about that subject (Malik, Abdallah, & Ala’raj, 2018) and check if those approaches have been implemented in the field (Wang, Kung, & Byrd, 2015).
Once talking about big data analytics, one should try to understand which type of analytics is referred to descriptive or predictive analytics. In this work, the predictive potential of big data is the main focus, although the descriptive analytics is very common in imaging-based analytics, i.e., to detect patterns in the data generated from MRI, for instance. The scientific studies using descriptive, analytical methods –
20 the most commonly used methods of data mining techniques, are mainly focused on the diagnosis (Tomar & Agarwal, 2013). Predictive healthcare approach is of utmost importance and should be done in a close partnership between public and private organizations, so that not only the main goal is reached, i.e. to act in the prevention side and, consequently, prevent diseases, but also to generate and use the synergies that come from that collaboration (Wang, Kung, Ting, et al., 2015) - economic savings to the overall healthcare system can be obtained in this way.
Predictive healthcare have been applied to several fields that have been considered problematic for some of the world's future societies, one of them being the diabetics (Pham et al., 2017; Saravana Kumar, Eswari, Sampath, & Lavanya, 2015), where the diabetes types prevalent are predicted, as well as other consequences associated with it, as well as the type of treatment to be provided. These systems have the ultimate goal of providing efficient ways to cure and to care the patients, with better outcomes such as affordability and availability.
2.1.2. From Big to Smart Data
Big data is often discussed in the context of both improving medical care and also in preventing diseases as it has the power of facilitating action on the modifiable risk factors that contribute to a large fraction of the chronic disease burden, such as physical activity, diet, tobacco use, and exposure to pollution (Barrett, Humblet, Hiatt, & Adler, 2013). It can do so by facilitating the discovery of risk factors at population, subpopulation, and individual levels, and by improving the effectiveness of the intervention. As we have already seen, the widespread use of healthcare information systems, in the form of the known EHRs, leads the way healthcare could and must be delivered, by resorting to the power of big data, making the ambition of delivering individualised healthcare a possibility in the near future. We already have the tools to say that the future of medicine will be through the personalisation of medical care, after the human genome being entirely sequenced. Big data and predictive analytics state-of-the-art algorithms, such as neural networks (Pham, Tran, Phung, & Venkatesh, 2016; Pham et al., 2017), genetic algorithms (Tejeswinee, Shomona, & Athilakshmi, 2017) and deep learning (Ravi et al., 2016), are key components of that vision, as data should be collected throughout time in order to build accurate models. Healthcare observations, recorded in Electronic Medical Records (EMR), are episodic and irregular in time. Thus, personalised, predictive medicine requires the modelling of patient illnesses and all the care processes, among other things, as depicted in Figure 1, which inherently have long-term temporal dependencies of patient data (Pham et al., 2016). The dream of these systems would be not only to model the diseases progressing and recommend accurate diagnosis but also to predict future risks for each human being, way before the symptoms appear. This is of utmost need for heavy social and economic burden diseases like diabetes and neurodegenerative diseases. All this has made, undoubtedly, data mining and predictive analytics important tools for healthcare decision making.
However, despite all the published literature and all the interest, among the scientific community, for knowledge discovery from the big data to improve the delivery of healthcare services, there has been a lack of attempts for synthesizing the available information on how the big data phenomenon has contributed already to better outcomes (Malik et al., 2018). Furthermore, only a small proportion of the huge potential of risk prediction modelling is being applied (Cano et al., 2017), in particular for health forecasting chronic patients, due to the lack of implemented procedures for accessing and mining health information from daily clinical practice. Big data and predictive analytics will only bring advantages if, and only if, the access, storage and process of quality multilevel, multisource data is possible. Only in this way,
21 a holistic strategy for subject-specific risk prediction can be achieved, in such a way that early identification of patient susceptibility to multi-morbidity might enable cost-effective preventive healthcare strategies and enhance management of chronic patients (Cano et al., 2017).
Nevertheless, developments on the area of information management and systems, machine learning and data science, by using advanced algorithms and analytical methods, such Gravitational Search Algorithm (Nagpal, Arora, Dey, & Shreya, 2017), are being used to extract as much knowledge as possible from the data we have gathered. However, without existing yet a quick, easy and integrative way to find them - the process of locating all scientific breakthroughs is still manual, even experienced authors in the field struggle to find all the published articles they need (Malik et al., 2018), research will necessarily be slower than they could be.
2.2. Neurodegenerative Disease’s Diagnosis
One of the most difficult challenges for modern medicine is the diagnosis of neurological diseases (Siuly & Zhang, 2016). According to the World Health Organization’s recent report, neurological disorders, such as epilepsy, Alzheimer’s disease and stroke to a headache, affect up to 1 billion people worldwide. An estimated 6.8 million people die every year because of neurological disorders. A lot is being done by international organisations to raise the awareness of the burden society will carry in the future due to dementia and other neurodegenerative diseases. In 2012, the World Health Organization declared dementia as a public health priority, when 35.6 million people worldwide were living with dementia, according to estimates. In 2016, the number rose to 47 million, more than the population of Spain (Prince et al., 2016).
The diagnosis has always been a headache for medical practitioners, with huge social impact. Many authors have tackled the problematic of neurodegenerative diseases diagnosis (Kaur & Wasan, 2006; Siuly & Zhang, 2016), the degenerative process, its progress and treatment efficacy of some specific diseases. There has been as well several drug discovery programs (Geerts et al., 2016), mainly initiated by the pharma industry, among many other research programs and initiatives (Alzheimer’s Association, 2016). Due to the increasing awareness and focus on the neuro diseases - the cases of dementia are increasing year over year (Perera et al., 2018), many previous studies, both in animals and in humans, have examined the relationship of Parkinson’s disease (PD) risk to trauma, genetics, environment, co-morbidities, or lifestyle, to find patterns and biomarkers. For AD, for instance, there has been ground-breaking research studies regarding the identifications of such potential biomarkers, such as sleep (Bubu et al., 2017), diabetes (Habes et al., 2016; Janson et al., 2004), antidepressant and anti-hypertense drugs (Habes et al., 2016), risk factors related with lifestyle such as alcohol and smoking (Habes et al., 2016; World Health Organization, 2012), as well as using structural imaging patterns of advanced brain aging, capturing aging atrophy patterns (Habes et al., 2016).
Mild Cognitive Impairment (MCI) is currently considered to be an early stage of a neurodegenerative disease. Moreover, patients diagnosed with MCI are assumed to have a higher risk to evolve to the AD. Prediction of progression from a stage of MCI to dementia is a major pursuit in current research (Lin et al., 2018; Pereira et al., 2017), whether by predicting the likelihood of MCI conversion or the time to actual conversion. These kinds of studies have often shown a relatively high statistical confidence level on the prediction results from the predictive models developed.
22 Although focused on one neurodegenerative disease, such as Parkinson’s disease, some studies have the particularity of being possible to extend and applied to other diseases such as Alzheimer’s Disease (Dinov et al., 2016), with clear research cost-savings and great impact on society. This studies usually tackle on the feature selection phase of knowledge discovery, which is a crucial step in the data mining process when dealing with such degree of data heterogeneity (Tejeswinee et al., 2017).
In practical terms, the clinical assessment in clinics and hospitals of patients with suspected dementia is done nowadays using mostly structural imaging based on magnetic resonance (MRI). Prospective data, from preclinical to other stages of Alzheimer disease, are radically changing how the disease is conceptualised and will influence its future diagnosis and treatment.
Given the complexity of neurodegenerative diseases (Hofmann-Apitius, 2015), it was expected a significant heterogeneity of data in that scientific area. Heterogeneity of data concerns their mode (omics data, imaging data and clinical data, leading to variety) as well as their quality/veracity. Big data analytics uses a wide range of data integration, modelling, and mining strategies in order to understand and predict systems behaviour in complex systems. The integration of complex and heterogeneous big data from multiple sources offers unparalleled opportunities to study the early stages of prevalent neurodegenerative processes, track their progression and quickly identify the efficacies of alternative treatments. Even in such complex data integration systems, data mining techniques have proven already to be a forceful way for biomarker discovery, with which significant findings of different clinical and biological biomarkers have been possible. However, due to the brain-related disorders complexity, challenges are still to be overcome, i.e. the way to integrate such data diversity in a single model/system in a straightforward and standardised way is still to be done. Nevertheless, the solution relies on data from different sources and model integration (data from single sources are unable to explain complex biological processes), where several data types are combined to provide complementary views (Carreiro, Mendonça, de Carvalho, & Madeira, 2015), to find and/or validate composite biomarkers using more powerful predictive models.
Another important aspect to consider is the EHRs. Huge volumes of health data are being collected and electronically stored, either in routine EHR databases or through research-driven cohort studies associated with biobanks and other efforts (Perera et al., 2018). To help improving access to patient-level data, the European Medical Information Framework (EMIF) was launched in 2013; it aims to create an environment that allows efficient reuse of health data in two therapeutic areas, one being Alzheimer’s disease. One important initiative of EMIF consortium was to assemble what is at the present moment one of the world’s largest EHR resource for dementia research. However, according to some authors of recently published articles, EHRs have been underused in dementia research (Perera et al., 2018; R. Zhang, Simon, & Yu, 2017), which entail a great potential for research and are a key element for the accuracy of the risk prediction of neurodegenerative diseases in healthy patients.
At the same time that biomedical and high-dimensionality datasets are becoming increasingly larger and freely accessible for neurodegenerative diseases, it is also important that new information analytics platforms be developed, allowing the big data resources to become an actionable mechanism, for faster disease prediction, a more accurate diagnosis and advanced therapeutic development. These systems will allow cross-platform datasets correlation (data of distinct types, sources or modalities). Machine learning methods are now strategies applied by the scientific community to drive the future development of diagnostic and therapeutic applications for Alzheimer's disease, such as latent semantic analytics,
23 topological data investigation, and deep learning techniques. However, the simplicity and diversity of platforms are needed, as the simple repetition of similar analytical methods will always be unproductive (Maudsley, Devanarayan, Martin, & Geerts, 2018).
2.2.1. Predictive Analytics Applied to Alzheimer’s Disease Discovery
Alzheimer’s disease is considered “a slowly progressive brain disease that begins well before clinical symptoms emerge” (Alzheimer’s Association, 2015). So far, the AD cannot be prevented, slowed or cured (R. Zhang et al., 2017). In 2011, an estimated 24 million people worldwide had dementia, the majority of whom were thought to have Alzheimer's disease (Ballard et al., 2011). An estimated 5.3 million Americans of all ages had Alzheimer’s disease, in 2015 (Alzheimer’s Association, 2015).
There are significant studies and research with the goal of having an evidence-based early diagnosis of the disease (Alzheimer’s Association, 2016; R. Chen et al., 2012; Frisoni, Fox, Jack, Scheltens, & Thompson, 2010; Janson et al., 2004; McEvoy et al., 2009; Serrano-Pozo, Frosch, Masliah, & Hyman, 2011; Tomar & Agarwal, 2013) but big data can further increase the reliability of the desired early stage diagnosis and even, being the ultimate goal, anticipate the disease by extracting enough meaningful information about every individual. With the knowledge gathered from millions of patients, and with methods such as machine learning, artificial intelligence, pattern recognition, the knowledge extracted could be used to predict, with a high level of certainty, whether a person will develop AD in the future.
There is already strong evidence of potential risks and protective factors for Alzheimer's disease, dementia, and cognitive decline, but further work is needed to understand these better and to establish whether early interventions can substantially lower these risks. Then, if possible, the potential patient will have time to change its behaviour, avoid some risk factors, delay the disease appearance, or even not develop it at all in the future. Data science will help not only on the journey towards the discovery of a cure but also on helping to reduce the rather increasing growth pace of the disease’s prevalence worldwide, which will put pressure on several sectors of our society, in particular, in the underdeveloped countries’ economies (Association, 2017).
Neurologists, psychiatrist and geriatricians, use a variety of approaches and tools to help make a diagnosis (Association, 2017), as there is no single test for Alzheimer’s. Thus, the data collected to help on that difficult diagnosis can be one or many of the following:
• Medical and family history from the individual, including psychiatric history, and history of cognitive and behavioural changes;
• Information from a family member on observed changes in thinking skills and behaviour; • Cognitive tests, physical and neurologic examinations;
• Blood samples and brain imaging to rule out other potential causes of dementia symptoms, such as a tumour or certain vitamin deficiencies.
Although physicians can almost always determine if a person has dementia, it may be difficult to identify the exact cause. Sometimes weeks may be needed for the individual to complete the required tests and examinations, and for the physician to interpret the results to make a proper and accurate diagnosis.
24
2.2.2. Biomarkers and Data Sources
Biomarkers such as magnetic resonance imaging (MRI)s – perhaps the most used so far (Beheshti, Demirel, & Matsuda, 2017; Casanova et al., 2018; Moradi, Pepe, Gaser, Huttunen, & Tohka, 2015), positron emission tomography (PET), cerebrospinal fluid (CSF), and genetic modality single-nucleotide polymorphism (SNP) have been widely used in recent years for Alzheimer’s disease diagnosis, revealing to be an extremely useful sources of insightful data. However, some studies go beyond this and use EEG signal processing in order to help in AD early identification (Rodrigues, Teixeira, Garrett, Alves, & Freitas, 2016).
A relatively large amount of studies have focused on how to utilise these biomarkers to classify AD, and a relatively big number of them suggest that combining them for prediction is better than using any of them independently (Z. Zhang, Huang, & Shen, 2014). Still, some authors use a single source of data already existing, such as NACC neuropsychological/neuropsychiatric datasets (Beheshti et al., 2017; Lemos et al., 2012; Lin et al., 2018) as the source for the developed machine learning technique to build, for instance, accurate MCI conversion prediction calculator (Lin et al., 2018), whereas others use their own generated dataset, e.g. neuropsychological data, to discriminate Alzheimer disease from MCI (Lemos et al., 2012). Even using single data sources, they presented great results by using sophisticated data mining and machine learning methodologies, such as ensembles of deep learning architectures (Ortiz, Munilla, Górriz, & Ramírez, 2016).
As already mentioned, structural MRIs biomarkers are quite well known and used in this field. Many studies have been carried out for the development of robust automated disease assessment algorithms (Frisoni et al., 2010). When sMRI are combined with the most common focus areas in this field - the prediction of MCI to AD conversion, usually with the goal of improving the opportunities for MCI and AD patients to get involved in clinical trials at the same time that the trial is cost-effective and efficient (Ithapu et al., 2015; Lin et al., 2018; McEvoy et al., 2009; Rodrigues et al., 2016), it results in the most common reseach topic among the published scientific articles found for this work. Within this research topic, many initiatives were started such as the development of machine learning methods (Casanova et al., 2018) and frameworks (Moradi et al., 2015), usage of Bayesian networks (R. Chen et al., 2012; Land & Schaffer, 2016), the application of deep learning (Ithapu et al., 2015) and genetic algorithms for feature selection (Beheshti et al., 2017).
With the introduction of MCI as a diagnostic category, challenges of diagnosing Alzheimer’s Disease (AD) come along with it, as no single marker has been proven to categorise accurately patients into their respective diagnostic groups accurately. Thus, some recent studies tackle the gaps identified in previous ones, attempting to develop combined predictors of AD and MCI that simultaneously consider all diagnostic categories and provide optimal combined representations using different set of modalities (e.g. neurophysiologic, MRI, PET, CSF Proteomics, genotype) for the prediction (Singanamalli et al., 2017). As current datasets in medicine can have many missing values in some modalities, convolutional neural networks were also studied in a multi-modality imaging data setup for the estimation of missing modality (Li et al., 2014).
Actually, according to R. Zhang et al. (2017), all the articles about the application of big data analytics on AD discovery fit in one of these seven categories: diagnosing AD or MCI, predicting MCI to AD conversion, categorizing risks for developing AD, text mining the literature for knowledge discovery, predicting AD
25 progression, describing clinical care for persons with AD, and understanding the relationship between cognition and AD.
Actionable knowledge from all these studies using big data is what some researchers argue (Geerts et al., 2016). They support the idea of generating actionable knowledge that could help in developing new treatment paradigms, either for a better trial participant selection or by advancing the way we deliver medical practices to the society, including new drug discovery’s efficacy.
2.2.3. Information Availability and Management
The production and availability of data in some repositories and data lakes in some countries, far from being centralised and interoperable, for dementia research will increase with the same rate as we can observe in other complex medical research areas. Therefore, the need for increased interoperability of data will simultaneously increase (Hofmann-Apitius, 2015). It will push for substantial efforts to cope not only with the rapid growth of data volume but also with the notorious lack of interoperability as far as data, information, and, first and foremost, knowledge is concerned. From the literature and the practical cases out there, data mining and machine learning techniques, such as deep learning, will more and more be applied to this field in the future, and there is no doubt that integrative modelling and mining approaches (Carreiro et al., 2015) will happen and will have a strong impact on dementia research. It is the only way forward if we want to harness the full potential data can give us for discovering hidden patterns that we could find in the past, without such technologies at our disposal.
As a consequence of the need of data and information integration, and interoperability, in the field of information management, and applied particularly to troubling growing health problems such as of Alzheimer’s disease, generated interest and space for the work presented here to happen.
However, without having neither a single platform where all this information is stored nor an interoperable and interconnected system of information sharing, it becomes hard to keep track of all the developments in the field, threatening the true potential of knowledge discovery and sharing, and decreasing the power of true collaboration and incremental innovation. However, there has been recently in the business world the need for data and information integration – one can easily recall a couple of startups and companies that were created based on data centralisation, which are now considered data aggregators in industries such as travel, finance, media, and many more. Knowledge management and collaboration have common and mutually interdependent purposes and practices (Qureshi, Briggs, & Hlupic, 2006). Collaboration technologies have had huge implications in the value creation for organisations and society in a whole; it is even more critical in areas of innovation, from where many people around the world would benefit. Collaboration technologies, in the form of information technologies, unlock the benefits of collaboration, through which the intellectual capital created can be used to create value. It can, potentially, even accelerate novel drug development and, simultaneously, aid rational drug repurposing for such complex conditions such as AD (Maudsley et al., 2018). Thus, there is an urge for more subtle and intuitive informatics systems. Information is spread, and for actionable knowledge we need it to be quickly accessible.
In (R. Zhang et al., 2017), one can find a first approach for summarising all the knowledge around the topic in one single work. In (Carreiro et al., 2015), an extensive list and its detailed description of the types of data sources available and used for predictive modelling in AD research is done. One must dig in the world wide web and spend many hours to find these useful scientific publications. Furthermore, as it was
26 already concluded by some authors (R. Zhang et al., 2017), big data are increasingly used to address AD-related research questions, but EHR datasets are still underutilised; they should be used to further empower the potentialities of the predictive analytics for AD discovery. It is one conclusion that could be quickly drawn from a single, quick analysis of integrative and intuitive information management and visualisation platform, which, if existed, would avoid many hours, and funding, spend on trying to capture the overall picture/state of the science of that specific research topic.
Therefore, it is of vital importance that we seek, and need that we already see rising in some European forums (Tennant, 2018), of having an open and intuitive information management platform towards open science, where these studies would be visible for the entire research community and the entire world. If so, it will provide a holistic view of the relevant research topics and fostering innovation and collaboration between, for instance, distant physical cohorts, and lead to an increase in the research efficiency and effectiveness, which would, consequently, reduce the probability of the research topics’ overlap. The wasted time on articles search is inefficient, taken that we live in an era where information is always at our reach. Incremental innovation methodologies based on collective intelligence should be a right mindset for faster discoveries of hidden knowledge in areas so complex as in Alzheimer’s Disease.
2.3. Data Visualization
Data and information in databases are hard to see. Humans have a limitation in how much information can they understand looking to a table with data all over the place. Data visualisation is nothing more than being creative on how we visually present the data in order to help humans to deprehend concepts, patterns, insights that could not be seen and understood by looking at the same data in a spreadsheet, for instance. It is a happy marriage between visual arts, computer science and, being more precise, graphical design and data science.
2.4. Visualise to Communicate
Data visualisation became a critical field of computer science, so much that there already a world-renowned competition and award for good data visualisation (Kantar, 2018). With the rise of the data storage we have seen in the past years, that new forms of visualising the same data appeared, and with it a new industry and more and more data science professionals and becoming knowledgeable on that. All this contribute for data visualisation to become the single most effective communication enhancer for data science and related areas, given the number of books and industry publications about the topic (Munzner & Maguire, 2014). In fact, “we visualise to communicate a point” (Evergreen, 2016).
According to the author Munzner & Maguire (2014), visualisation design can be split in three main fronts: what data users need to see, why users need to carry out their tasks, and how the visual representations proposed can be constructed and manipulated. Visualisation, comprehending a big set of areas, touches as well in the realm of psychophysics, as human perception plays an essential role in the area of visualisation (Healey, 2007; Munzner & Maguire, 2014). Visualisation is much more than data in a bar chart; there are “bad data”, “bad taste” and “bad perception”, which can turn out to be a nightmare for the ones trying to convey the right information visually in the right way (Healy, 2018). In the same line, Edward R. Tufte is unarguably the best-known critic, by far, of information visualisation, mentions in this well-known book from 1983, The Visual Display of Quantitative Information (Tufte, 2001), summaries his view on how difficult it is to get graphics and data visualisation right:
27 “Graphical excellence is the well-designed presentation of interesting data—a matter
of substance, of statistics, and design (…) [It] consists of complex ideas communicated with clarity, precision, and efficiency. (…) [It] is that which gives the
viewer the greatest number of ideas in the shortest time with the least ink in the smallest space (…) [It] is nearly always multivariate … graphical excellence requires
telling the truth about the data.” (Tufte, 1983, p. 51).
2.4.1. Data Visualization for Scholarly Data
Scholarly data visualisation in one branch of data visualisation's broad range of applications. The typical examples of scholarly data visualisation are the visualisation of researchers, papers, journals, and institutions. These are quite common, as far as on scholarly social or information network analysis is concerned. All these entities are usually represented regarding generated scholarly networks, wherein nodes represent the academic entities/researchers and links represent the relationships such as citation, co-author relationship and institution partnerships. In Liu et al. (2018) one can find extensive research about the topic, more specifically regarding the software commonly used for that purpose and the research that has been carried out.
There are visualisation techniques specially designed for those simple attributes (e.g. author, institution) and heterogeneous networks of scholarly data (Liu et al., 2018). Moreover, one initiative that tackles the need for identifying trends in the research areas is led by the Automatic Identification of Research Trends initiative (AIDA). It has already diverse case studies on research positioning and trend identification, which are mostly used by PhD candidates, researchers, group leaders, and policymakers. This initiative and studies, among many others, use the tool VOSviewer (Vosviewer, 2018). This tool provides the possibility to create collaboration maps, citation density maps, among other options, making use of the interconnection of articles through their citations. Other existing tools that can be used for the same objective are SCI2 (sci2, 2018), Histcite (Histcite, 2018) and Citespace (citespace101, 2016).
Although there are many studies, mostly from computer science related institutions, regarding the development of systems for the extraction of relevant metadata to build visualisation solutions, the reality is that the data of most scientific documents on the web are unstructured or semi-structured. That becomes a hurdle and justifies the proliferation of studies in this field. Automatic article’s metadata extraction methods become, therefore, an important task. In Z & H (2011), for instance, it is developed a system to extract the title, authors and abstract from scientific papers based on spatial and visual knowledge principle. They argue that the system developed achieves high accuracy in header metadata extraction so automatic index creation for digital libraries can effectively be achieved with it.
Another issue to overcome in this research space if also regarding the data quality and the lack of structure in the online digital libraries, which are highly dependent on the classifier’s quality used to mine that data from a set of crawled documents, which in turn depends, among other things, on the choice of the feature representation. To tackle this problem, Caragea et al. (2014) propose novel features that result in effective and efficient classification models for automatic identification of research articles, using CiteSeerx digital library for their successful experiment.
Keywords have been as well an exciting target for the ones studying ways to organise better the scholar databases and willing to come up with innovative data visualisation for a better understanding of that data. To achieve that, some researchers (Isenberg, Isenberg, Sedlmair, Chen, & Möller, 2017) have