THIS REPORT WAS PREPARED EXCLUSIVELY FOR ACADEMIC PURPOSES BY TIZIAN BASSLER, A MASTERS IN FINANCE STUDENT OF THE NOVA SCHOOL OF BUSINESS AND ECONOMICS.THE REPORT WAS SUPERVISED BY A NOVA SBE FACULTY MEMBER, ACTING IN A MERE
M
ASTERS IN
F
INANCE
A premium franchise at discount.
Equity story• RoTE. A PBT CAGR of 6% 2018 – 2020E drives RoTE. We see UBS as miss priced versus its RoTE delivery of 13.4%, with an upside of 51% to the price target.
• Structurally appealing GWM business. We expect the end of regulatory outflows (offshore/inshore), strong wealth creation in APAC, especially in HNWI and UHNW segments, with continu-ing strong NNM growth. Additionally, strategic initiatives increase the bank’s profitability and add to the positive outlook.
• Geographical diversification. The Company’s global presence represents an important competitive advantage. Lending growth in the US can be funded by cheap USD deposits outside of the US (e.g. Hong Kong).
• Stronger capital base than European peers. Strong equity funding gives UBS a good stand against stricter regulation and potentially higher litigations. Dividends are estimated to grow on a higher one-digit figure to CHF 0.75 in 2020E, which is largely dependent on the performance of capital base figures.
• Share buybacks. Overall, the capital story is increasingly mov-ing in favor of return above expectations, as management’s tar-get of 3.75% CET1 leverage ratio is already reached. Assuming UBS is able to strengthen its core capital ratio to modestly 4.00% by end 2020, it seems UBS could buy back CHF 4 bn of shares, moving up from the prior target of CHF 2 bn over 2018-2020. This would suggest a total yield of 8.4% FY19E and 10.7% for FY20E, adding an attractive yield to potential price upsides.
UBS
GROUP
AG
C
OMPANY
R
EPORT
S
WISS
B
ANKING
03
JANUARY
2019
S
TUDENT
:
TIZIAN BASSLER
[email protected]
Recommendation: BUY
Price Target FY19: 18.50 CHF
Price (as of 3-Jan-19) 12.24 CHF
Reuters: UBSG.S, Bloomberg: UBSG SW
52-week range (CHF) 11.60 – 20.89 Market Cap (CHF bn) 47.12 Outstanding Shares (mn) 3,720.8 Source: Bloomberg (Values in CHF mn) 2017 2018F 2019F Total Revenues 29,067 31,871 32,291 Commission Income 17,186 18,162 18,457 NII 6,528 7,857 8,272 Total Expense 23,800 23,430 23,594 EPS 0.28 1.60 1.66 Dividend Yield 5.2% 5.6% 6.1% Dividend Payout 241% 44% 46% RoTE 2.4% 13.4% 13.7% Cost / Income ratio 82% 75% 74% P / E 47.1x 9.9x 9.0x P / BV 1.0x 1.0x 0.9x Source: Company data, Analyst’s estimates
UBSGROUPAG
Table of Contents
COMPANY OVERVIEW ... 3
COMPANY DESCRIPTION ... 3 SHAREHOLDER STRUCTURE ... 4ECONOMIC OUTLOOK ... 5
EUROPEAN BANKING SECTOR... 8
PRIVATE &WEALTH MANAGEMENT MARKETS ... 9
TRENDS AND CHALLENGES ... 10
SEGMENT ANALYSIS ...12
GLOBAL WEALTH MANAGEMENT ... 13
INVESTMENT BANK ... 14
ASSET MANAGEMENT ... 15
PERSONAL &CORPORATE BANKING ... 15
COMPETITION ...16
FINANCIALS ...19
LOANS ... 19 DEPOSITS ... 20 CAPITAL RETURNS ... 22 NON-INTEREST EXPENSES ... 24NET FEE AND COMMISSION INCOME ... 24
VALUATION ...25
FTEVALUATION ... 25
FTESENSITIVITY ... 27
RELATIVE VALUATION ... 27
UBSGROUPAG
Company Overview
Company Description
Through the merger of two Swiss major banks, Schweizerische Bankgesellschaft (SBG) and Schweizerische Bankverein (SBV), UBS AG was founded in June 1998. The holding company, UBS Group AG (“UBS”, the “Bank” or the “Company”), which was incorporated 16 years later, conducts its operations through UBS AG and its subsidiaries. Headquartered in Zurich and Basel, Switzerland, the Bank represents with 2,402.8 billion (2017) assets under management rank one of the largest and leading wealth managers in the world. Yet, the Company provides its customers banking, financing, mortgage, investments, and other consumer and commercial financial services. With over 60’000 employees and operating in over 50 countries, UBS comprises Corporate Center and five business divisions: Wealth Management, Wealth Management Americas, Asset Management, Personal &
Corporate Banking and the Investment Bank. Effective 1st of February 2018,
Wealth Management and Wealth Management Americas were unified into a new business division called Global Wealth Management.
Although Switzerland is the home market and the only country where UBS is op-erating all five business areas, with 41% Americas contributed the most to the Group’s total operating income in 2017 - followed by Switzerland (24%), Europe Middle East Asia (24%), Asia Pacific (16%) and Global (-1%). Notwithstanding, comparing the Swiss market size to the US and Americas in general, UBS enjoys a vast market power and is fairly playing a dominant role in its home market. To be highlighted in Figure 2, the Company’s total operating income was diminish-ing over 2015 and 2016, rebounddiminish-ing with roughly +2.6% to CHF 29,067 bn in 2017. However, in 2017, net profits saw a sharp decline. According to UBS, it was mainly caused “by a CHF 2,865 million net-write-down of deferred tax assets (DTAs) following a reduction in the US federal corporate tax rate after the enactment of the Tax Cuts and Jobs Act (TCJA) in the US during the fourth quarter of 2017”.
Profit before tax increased by 29% compared to 2016.
In 2011, the Company started its restructuring process which aimed to save CHF 2 bn p.a. and push down the adjusted cost/income ratio below 75%. Although cost-saving procedures were conducted, the cost base was still relatively high. UBS Q3 results endorsed the trend which results of quarter 2 and 3 were already predicting. With a adj. C/I ratio of 76% the key indicator is now consistent with the management target of <75%, but sustained improvements need to be undertaken.
UBSGROUPAG
Could neither outperform SMI, nor S&P 500 - Financials Index.
Shareholder Structure
As registration in the share register of UBS is optional, 43% of shareholdings are not disclosed. As of 30 September 2017, we can attribute the remaining 57% of shares to their respective type of investor and geographic distribution. The share-holder structure can be split into 3 different groups: Nominees, which manage shares for their beneficial owners, account for 30% of holdings and represent the biggest part of the cake. Other legal entities hold 15% of disclosed shares, while individual shareholders represent about 11% (see figure 4).
Although anyone holding UBS shares must notify UBS if their holdings reach, fall below or exceed certain thresholds of voting rights, just BlackRock Inc., MFS In-vestment Management and the central bank of Norway disclosed holdings of 4.99%, 3.05% and 3.30%, respectively. In terms of share distribution, both Swit-zerland and Europe, Middle East, Africa (which of 18.5% the UK) stand out with c. 21% (see figure 5).
Since 2013, the Group has been able to increase dividends per share and paid a dividend of CHF 0.65 for 2017, representing a compounding average growth rate of 27% over the past 5 years. Disregarding 2013, the figure decreases to 6.8% which is in line with management’s targetto increase dividend per share at a mid-to-high single-digit percentage per annum. Dividend yield points a solid 4.6% while we see dividends yielding 5.1% and 5.5% in 2018E and 2019E, respectively. Due to the massive net-write-down in 2017, the Company’s payout ratio reached 241%, which is possible by enough excess liquidity and cash reserves. Moreover, the Board of Directors approved a share repurchase program of up to CHF 2 bn over the next three years, of which up to CHF 550 mn purchased in 2018. We will dis-cuss further implications of share-buybacks in the capital return section.
As one can see in Figure 6 below, UBS fell back against the SMI, which comprises the 20 largest and most liquid assets on the Swiss market – including UBS. As a price index, the SMI is not adjusted for dividends, which makes it more comparable to UBS’ stock price performance. Over the past five years, the Company’s market capitalization diminished about 22%, while the more diversified Swiss market grew by roughly 3%. Due to less regulation and tax breaks, financials in the US could
UBSGROUPAG
Global economic output to re-main stable in 2018 and 2019.
Potential for escalating trade tensions is threatening growth.
grow in a more advantageous corporate environment. The S&P 500 – Financials index (comprised of financial firms of the S&P 500) grew by more than 33% in the same time frame, even though not adjusted for dividends.
Economic Outlook
In 2017, the global economy showed robust growth, benefitting from the mitigation of negative political factors, good financial conditions and the resumption of inter-national trade. According to the latest IMF world economic outlook, Global eco-nomic growth reached 3.7% last quarter, a significant increase compared to 3.3% in 2017, and the strongest growth since 2011. From a global perspective, growth is expected to remain on that level in 2018 and 2019.
As one can see in Figure 7, China is expecting a dimmed outlook for 2018 and 2019, as US tariffs are weighing heavy on exports. Additionally, Switzerland faces a worse outlook, being affected by uncertainties in the European Union and the overall trade tensions between the US and China. Therefore, the IMF expects a significant decline in GDP growth in 2019. Momentum in the US remains strong as fiscal stimulus (e.g. Trump’s tax reform cut the federal corporate tax rate from 35 per cent to 21 per cent) continues to increase or at least to be stable, yet estimates for 2019 have been revised down as sanctions on China haven’t been revoked up until now, including tariffs imposed on USD 200 bn of US imports from China, plus further escalation in trade frictions cannot be ruled out. Also, growth projections have been marked down for Europe and the UK, following surprises that blanked activity at the beginning of the year.
UBSGROUPAG
Faster monetary tightening than markets expected.
In the US and EU, unemployment was decreasing over the past decade and reached lowest levels last quarter, also accountable to Trumps latest tax reform approved in December 2017 in the US (at least to some extent). In theory, lower taxes incentivize businesses to build new factories and employ additional workers. In practice, as the American economy was already in a state of full employment, excess liquidity tempted corporates mostly to buy back their own equity. Still, with 3.9% the US recorded a two bp lower unemployment rate than in the first quarter of 2018. In Europe and Switzerland, companies returned excess liquidity to share-holders as well. Also, UBS approved stock buybacks worth CHF 2 bn up until 2020 and is potentially extending its program. As one can see in Figure 8, Switzerland was able to maintain high-level employment in the financial crisis and held this level since then – unemployment of 4.9% was recorded in the second quarter of this year.
Central banks’ monetary policy brought back volatility which has been one of the central factors in 2018. The Federal Reserve (FED) started to gradually increase interest rates since 2016 and has already adjusted interest rates for the fourth time in 2018, including the latest increase last month. After Jerome Powell, Chair of the FED, gave hope of slower monetary tightening in November, markets were not expecting the fourth hike and reacted with a 3% decline. Moreover, the pace of how the FED will reduce its USD 4.1 trn balance sheet is engaging markets. Hy-pothetically, if Powell sold all assets at actual market prices, the FED would write-down USD 66.5 bn, according to the latest central bank’s quarterly report. This seems to affect the FED’s procedure on how fast the assets will be sold, and we assume a rather slow sell-off. To calm markets Trumps Secretary of Treasury Ste-ven Mnuchin conSte-vened individual calls with the CEOs of America’s six largest banks to ensure their liquidity, which triggered the opposite of the intended. Mar-kets had the worst week since 2008.
On the other side of the pond, the European Central Bank (ECB) announced to end its bond-buying program in January. After almost four years of governmental stimulus, Mario Draghi accumulated more than EUR 2.6 trn worth of assets. The ECB’s balance sheet bloomed to 40% of the euro zones GDP to a total of EUR 4.4 trn. How the central bank will reduce its balance sheet will be a decisive factor on how markets will react, and therefore, how macroeconomic figures will develop. Although we expect here no excessive risk it will remain an uncertainty that should be continuously evaluated.
Additionally, markets suggest ECB to raise interest rates in 2019. We see the Swiss National Bank (SNB) rather unlikely to raise rates before the European Un-ion. Reflecting the given situation with an increased global uncertainty, we are not
UBSGROUPAG
Banks are likely to benefit from interest rate hikes.
Uncertainties remain also in 2019…
expecting any surprises before the second half of 2019, also due to potential “safe-haven flows” Switzerland could benefit of.
In general, an increase in interest rates lead to higher margins and profitability of banks. Due to massive cash holdings, banks can earn higher yields on such de-posits due to a marginal effect between interest payouts to customers and short-term notes. Banks invest a part of customer deposits in short-short-term notes and ben-efit from the margin between those rates. When this spread widens due to hikes in interest rates, it has a slightly higher positive effect on interest income, as it has on interest expense. Additionally, as such increases come in a time of economic growth, customers and businesses demand loan spikes, which indirectly increase income for banks. And although the NII increases, there are also negative figures which have to be taken into account, as higher interest margins lead to higher credit losses and, most importantly, higher cost of equity.
Also, markets have proven relatively immune to political uncertainties in 2017, which changed with the ongoing trade tensions between the two largest economies in the world (see figure 9). When manufacturers put out first profit warnings due to decreasing exports, negative sentiment was, again, manifested and strengthened. Additionally, Trump’s efforts come to a time when Chinese debt crisis looms to a pile of USD 34 trillion of public and private debt, an explosive threat to the global economy. Even with the government deleveraging, Chinese debt rose by 14 per-cent in 2017, swelling to 266 perper-cent of GDP, from 162 perper-cent in 2008.
Concluding, we prefer to remain neutral about the overall outlook and the real GDP growth over 2019 and 2020. A further escalation between the US and China, as well as the Chinese debt crisis could deteriorate the sight. Nevertheless, we be-lieve that there are still growth potentials, especially in the US. With a de-escalation of the trade war and a lagging increase of interest rates in the US and Europe, the end of the cycle is likely to be postponed, however, the overall economy shows first signs of a deacceleration. The expected increases in interest rates should mit-igate those negative developments for the sector and we believe that the signifi-cant enhance on net interest income will lead to an increase of market capitaliza-tion of financials, which we think is not priced in into markets yet.
UBSGROUPAG
Industry Overview
European Banking Sector
Figure 10 shows a clear downward trend in the number of credit institutions in the European Union since 2013, and in fact, banks are consolidating since the financial crisis. In 2017, the EU incorporated 5,868 financial institutions and is expected to continue its downward trend with 5,580 and 5,300 in 2018 and 2019, respectively. This points a compounded average growth rate of -5.3% and a decrease in the total number of financial institutions of around 2,000 over a time horizon of seven years. The decreasing number of banks can mostly be attributed to a consolidation where banks legally incorporated subsidiaries to their reporting country. This con-solidation trend includes factors such as probability and cost saving procedures. Core banking activities of raising deposits and distributing loans to customers are crucial for financial institutions. With European consumers and businesses delev-eraging, bank deposits and loans surged in 2017. Banks’ deposit liabilities in the EU rose by 3.1% to EUR 23.6 trn. It represents the highest value since 2012, driven by deposit growth of Monetary Financial Institutions (MFIs), which grew for the first time since 2011. Looking at figure 11, one can analyze the development of depos-its in the consumer market, which is split into households (HH), non-financial cor-porations (NFCs) and financial corcor-porations (FCs). In 2017, the consumer deposits amounted EUR 15.7 trn and are expected to grow by roughly 2.5 per cent p.a. over the next two years. HH and NFCs were driving growth when FCs were decreasing on average by two per p.a. since 2013.
The total value of European loans outstanding increased by 1.7% in 2017 to more than EUR 24.5 trn. The increase derived mainly from growth in loans from MFIs and HH, which grew by 2.4% to EUR 7.8 trn. This trend continued for the fifth successive year, adding more than EUR 500 bn on loans outstanding since 2013. Forecasts for 2018 and 2019 are suggesting an increase of outstanding consumer loans of about 2 per cent. NFCs loans outstanding grew by one per cent in 2017 to EUR 5.2 trn, surpassing its highest level since 2013.
In the financial crisis, banks’ balance sheets have seen a tremendous rise in non-performing loans (NPLs), leaving authorities in the US and EU concerned about risk-taking regulatory. This trend continued to result in an EU-wide peak NPL rate of 7.5% in 2012, nevertheless, banks managed to significantly decrease NPL ratios years after which can be attributed to loan selling activities. In fact, as of 2017, EU’s NPL ratio was equal to the world’s average of 3.7%, which indicates that NPLs are no longer a specific European problem. Further, even while the financial
UBSGROUPAG
Asia Pacific to remain the key driver in wealth accumulation.
crisis NPLs weren’t a big issue in Switzerland either, and with an NPL ratio of 0.7%, the Swiss NPL ratio shows its lowest levels since 2007 (see figure 13).
Private & Wealth Management Markets
The overall growth of the wealth management market plays a significant role for global wealth managers and has an enormous influence on UBS’ net fee and com-mission income. In this section, we will analyze growth potentials of different geo-graphic areas and further important factors that affect wealth managers.
The total amount of net investible assets (NIV) will urge to USD 63 trn in 2019 and is expected to continue at a growth rate of five per cent p.a., adding more than USD 15 trn in assets to the global wealth management market since 2016. Looking at a more detailed distribution in figure 14, one can see that North America, West-ern Europe, and Asia-Pacific combined make up 79% of total NIV. And in fact, more than half of NIA growth until 2021 can be attributed to just five countries. The US and China alone account for over 45%, and yet Russia, Brazil, and India add another 10%. The next 12 top growth countries make up 28% of NIA growth. With a compounded average growth rate of 6.0%, Asia Pacific deemed to be the fastest growing market, and potentially, the most attractive region for wealth man-agers to generate net new money (NNM). Entrepreneurial thinking, an educated workforce, and good financing opportunities also create magnificent investment opportunities for HNWI+ clients with expected growth rates way above average. Headquartering in centers of innovations, such as Singapore or Hong Kong, can bring a great advantage for those who seek relationships with corporates. Compa-nies favor the good infrastructure, state support, free-trade arrangements and in-vestment treaties.
In 2017, UBS was able to generate NNM of CHF 28.3 bn in Asia Pacific, which points a growth rate of nearly 10%. A rate 4% above the region NIA growth speaks for UBS’ ability to accumulate net new money of HNWI+ clients, and yet, depend-ent on three key factors: Market access, expertise, scale. Market depend-entry can be dif-ficult for smaller wealth managers due to regulatory cost - cost-income ratios re-main high and the spread between smaller and larger wealth managers has wid-ened in 2017. Scalable wealth managers are more successful in managing their cost, which is mostly driven by automation and digitalization.
Additionally, exploiting negation power is important against lower-cost models such as ETFs and Robo-advisory. In figure 15, one can see the spread in margin fees between Europe-based and American-based wealth managers.
UBSGROUPAG
Pricing to be the same, yet a shift to low-cost models observable.
WM to be likely in a holistic and more personalized ap-proach.
Digitalization is driving the future of banking.
As we can see, margin fees are declining for American- as well as for European based banks since 2014 and are expected to decrease further due to competition and a shift into lower-cost models. Interest rate hikes supported by increasing de-mand in loans boosted net interest income (NII) growth and led to a major revenue uplift in the American wealth management industry. Interest rate curves suggest further NII sensitivity to interest rate hikes, although we see US deposit beta mostly exploited, i.e., the margin upside due to increasing interest rates which is passed on to clients. Contrary, we believe there will be a delayed beta pick up and a steeper forward curve, and therefore the largest upside for Europe-based banks, when interest rates increase in 2019.
Trends and challenges
Holistic wealth management, which follows a big picture approach will emerge
as a new generation is demanding higher degrees of personalized advisory. As a result, traditional wealth managers are likely to disappear from the market without adaption to client needs; and according to Oliver Wyman holistic models are ex-pected to gain a market share of 30% by 2025. Financial planning doesn’t stop at asset allocation, but spans over liabilities, wealth & succession planning as well as tax advisory to deliver holistic wealth preservation and growth. In the past, ultra-low interest rates made it difficult to distinguish from other wealth managers over pricing. To stand out the today’s industry one needs to differ with a strong product portfolio in connection with a personalized high-quality advisory.
Digitalization is one of the most important challenges which wealth managers face
nowadays. Despite some aspects of client interaction will remain at a personal level wealth manager should aim to support client advisors and clients by digital product offerings to stay ahead of competition. Today, client satisfaction is also dependent on how good financial institution can adopt for supportive digital appli-cations. Technology has become 10-20% of the wholesale banking cost base. Nevertheless, banks have to catch up to higher standards what clients are already expecting, e.g. in retail. Fintechs are filling these gaps in the financial industry
UBSGROUPAG
where banks cannot. According to Ernst & Young, Fintechs investments reached EUR 27 bn in 2017, representing a serious threat to banks’ conservative business models.
Offshore wealth management provided a significant tax advantage for clients,
although with recent regulatory tightening we have seen enormous back-flows to onshore centers. New inflows from rather UHNW individuals in developing coun-tries have offset this outflow, as banks adapted their own value proposition to offer offshore services to rather mature markets. According to Boston Consulting Group, offshore wealth is expected to continue growth with a year on year growth rate of 5 per cent through 2023. With USD 2.3 trn, Switzerland stays the largest offshore center, followed by Hong Kong with USD 1.1 trn and Singapore with USD 0.9 trn. In terms of growth, Hong Kong (11%) and Singapore (10%) can outperform Swit-zerland (3%) by more than factor three.
Regulation and transparency became increasingly important to authorities.
Fi-nancial institutions and capital markets are subject to stringent regulatory require-ments, and with the Common Reporting Standard (CSR) and the Foreign Account Tax Compliance Act (FATCA) coming into place, banks are required to exchange account data with tax authorities on a global basis. As a result, banks face another level of operational complexity and especially long-established offshore centers like Switzerland are suffering outflows.
Overall, we believe that the industry will see a trend toward personnel and advi-sory-oriented business models. Especially, holistic wealth managers with digital advisory solutions will gain additional market share. New technology and client affinity for digital framework pave the way for profitable business models, which first Fintechs are already demonstrating. Shrinking profitability and a higher cost-base through the appliance of regulation will encourage bank consolidation. Addi-tionally, offshore centers are showing stable growth with Switzerland as the main hub for wealth management.
UBSGROUPAG
Strong Q3/18 results – 37% increase in PBT.
Segment Analysis
UBS’ businesses are organized into four business divisions: Global Wealth Man-agement, which comprises Wealth Management and Wealth Management Ameri-cas, Asset Management, Personal & Corporate Banking and the Investment Bank. In this part, we will analyze the Group’s performance on a divisional basis. Figure 17 shows the profit-before-tax (PBT) contribution of the four divisions to the Group’s result. One can see that Global Wealth Management is the driver and with 50% of PBT contribution the largest part M9/2018. And in fact, over the last years the importance of GWM further increased. The Investment Bank and Personal & Corporate Banking makeup the second and the third rank with 26% and 19%, re-spectively. With 5%, Asset Management cannot hold expectations for M9/2018, despite management’s endeavors to make the business profitable.
Table 2 below shows the performance targets for the Group and the business di-visions for the 2018-2020 period.
Table 2: Group and divisional targeting
Source: Company data
Although management emphasized to move beyond the topic of costs, markets will focus on the bank’s high relative C/I ratio and the scale of its Corporate Center (CC) costs in relation to the Group. Compared to Q3/17, PBT increased by 37% to CHF 1,668 mn in 2018, reflecting a higher increase in operating income while op-erating expense diminished. Mainly driven by a jump in net fee and commission income, operating income increased by CHF 134 mn. Operating expense de-creased by CHF 313 mn (5%) due to lower general and administrative expense. The Company was able to reduce its cost base and meet management’s target C/I ratio of 75%, compared to 85% in 2016 and 82% in 2017.
PBT is estimated to surpass the threshold of CHF 8,000 mn in 2018, which states an increase of over 15% compared to 2017. Figure 18 shows the PBT development of the four business divisions from 2015 onwards, quarterly results annualized. With a strong result in the first quarter, primarily driven by Global Wealth
UBSGROUPAG
APAC still driving NNM growth; 8.7% in Q3/18.
Management and the Investment Bank, profits were not as sustainable as in the first quarter.
Global Wealth Management
Effective 1 February 2018, Wealth Management and Wealth Management Ameri-cas were unified under the name Global Wealth Management. It provides advisory and tailored financial services to wealthy clients - namely Affluent, High-Net-Worth-Individuals (HNWI), Ultra-High-Net-Worth (UHNW) and Global Family Offices (GFO). Such financial services comprise banking and lending solutions, wealth planning, investment management, and corporate finance advisory.
After NNM was disappointing in Q2/18 with a net outflow of -0.4 bn, mainly due to weak APAC growth and significant outflows in the Americas, UBS was able to gather inflows of CHF 13.7 bn (CHF 8.4 bn alone APAC) in Q3/18. Before, the management highlighted that there was a single outflow of CHF 4.4 bn from a corporate employee share program and higher seasonal tax-related outflows of CHF 4.6 bn in the Americas. However, with outflows in Q2 of -0.1%, UBS has to prove sustainability in the last quarter of 2018 to reach management’s targets of 2 – 4% NNM growth.NNM growth is to a largely dependent on macroeconomic fac-tors, and especially vulnerable through arising uncertainties like brewing trade ten-sions.
UBSGROUPAG
CIB revenues lately stronger, but structural growth over the long run still questionable.
Wealth management benefits from a significant scale with attractive growth poten-tials. As seen in figure 21, the number of client advisors were quite stable, and in fact, declined by roughly 1.5% compared to Q1/17 to 10,556 in Q3/18. Hereby, the Americas employs more than 65% of UBS’ financial advisors. While the number of advisors decreased, UBS’ assets under management grew by CHF 78 bn. GWM is the only operating division with positive operating leverage. The cost/income ratio has improved over the last years with management’s efforts, yet the positive momentum has been lagging behind for the second and the third quarter of 2018. And the Company’s GWM division is the only reliable division where PTP growth consistently. This is despite management plans apparently not to hire client advi-sors aggressively, unlike other competitors in the industry.
Investment Bank
The Investment Bank is divided into Corporate Client Solutions and Investor Client Services. The division provides investment advice, financial and capital market so-lutions. We organized the different revenue sources into Advisory, Equity Capital Markets (ECM), Debt Capital Markets (DCM), Equity Trading, Fixed Income, Cur-rencies and Commodities (FICC) and Other.
The division’s PBT increased by more than 75% compared to the rather weak previous year’s third quarter performance. This was mainly due to stronger Equity Trading and FICC, although Q2 and Q3 were already predicting higher results. Advisory and ECM missed out on growth and FICC is substantially weighted to-wards FX trading, which pushed Q2/18 results through more stabilized foreign ex-change markets. FICC disappointed in Q3/18.
To be highlighted in figure 23, over the longer term total IB revenues are not actu-ally higher than in previous strong quarters over the past few years, e.g. Q1 – Q3 in 2015 or Q1/17. It remains uncertain whether IB revenues are truly enjoying sus-tainable growth. And however, IB’s cost/income ratio reached management target
UBSGROUPAG
AM remains the problem child - declining profit margins fore-cast difficult times for the divi-sion.
in 9M18 (see figure 24) it has not improved over several years and neither has the return on attributed equity, which pointed 20.8% for the third quarter.
Asset Management
UBS Asset Management is the division which contributes with 5% the least to the overall Group’s PBT. It provides investment management products and services, platform solutions and advisory support to mostly institutional clients but supports also wealthy individuals served within the Group. In the past few years, AM came under enormous cost pressure as profit margins declined. As a result, manage-ment’s strategy unweighted the importance of AM internally in order to focus on core strengths.
The cost/income ratio is increasing and out of reach of management’s range target of 60 – 70%. On a 9M/18 basis, AM points a cost/income ratio of 75.7% and we expect it to stabilize on that level (see figure 25). Also, disappointing NNM inflows in Q2/18 and Q3/18 of CHF 0.5 bn and CHF 0.2 bn, respectively, relativize stronger inflows in the first quarter of 2018 (see figure 26). The net interest margin is further declining, due to a difficult environment in the industry and a shift in more passive low-cost products such as ETFs (see figure 27). Cost efficiency stays the main focus of the management. The pre-tax profit growth is steadily declining in the past quarters and reached negative values for the third consecutive year. Overall, we see the division under ongoing restructuring, but management’s efforts seem to be not enough to face the vast change in the industry. However, the importance of AM for UBS overall results stays down.
Personal & Corporate Banking
Personal & Corporate Banking (P&CB) provides financial products and services to private banking clients, and corporates and institutionals in Switzerland. The
UBSGROUPAG
Bank’s competition is evolving and being threatened by new business models.
division contributes about 19% to the Group’s PBT. P&CB 9M/18 cost/income ratio shows 57.9% which is consistent with recent years average and management’s target between 50 – 60%. As one can see in figure 29, net interest margins are declining since 2016, and in fact, also 2018 results are below average. Additionally, pre-tax results show negative growth of 3.3% in Q3/18.
Competition
UBS’ competitive environment is evolving. In addition to traditional competitors, new entrants like Fintechs and other financial companies are targeting certain components of banks value chains. Especially in the asset-gathering business UBS is facing significant competition through the entry of large platform compa-nies. Although, astructural unbundling of the value chain and client relationships couldn’t materialize yet, over the longer term, we believe such business models represent a tremendous competitive threat. Due to their well-situated position and broad access to a large client and data base, Fintechs gain more and more market share.
As it seems to be difficult to compare such different business models, we will ana-lyze more the traditional competition. For each of the four segments, UBS is facing divergent competition, for both on regional and segment level.
P&CB.Competition for the Personal & Corporate Banking division is very centered on the Swiss market, as UBS is operating only within Switzerland. For the Swiss retail business, competitors are mainly Credit Suisse, Post Finance, Raiffeisen and other smaller local banks. In the Swiss corporate and institutional business, com-petition is largely among UBS, Credit Suisse, globally active foreign banks and Swiss cantonal banks.
AM.In the Asset Management business main competitors are mostly restricted to global asset managers with wide-ranging distribution channels, such as
UBSGROUPAG
UBS plays a dominant role in the industry – large, global and a broad client base.
BlackRock, Amundi, Goldman Sachs, Invesco, JP Morgan, Morgan Stanley and Schroders.
IB. The Investment Banking business is dominated by the major global investment
banks, namely Goldman Sachs, Citi Group, Credit Suisse, Bank of America Merrill Lynch, JPMorgan Chase, Morgan Stanley and Deutsche Bank.
GWM. Global Wealth Management competes with the largest wealth managers in
the world. It includes private banking operations of Bank of America Merrill Lynch, Morgan Stanley, Credit Suisse, JP Morgan, Citi Group, BNP Paribas, Julius Baer, HSBC and Deutsche Bank. As the heart of the franchise, GWM makes up about 65% of the Company’s value. Thus, we mainly select the peer group in accordance to the competition in GWM, which matches to a large extent with the other seg-ments. More to follow in the relative valuation part later on.
Figure 30 shows Tier-1 wealth managers by type of clients, geographic presence and AuM, as of FY2017. The size of the bubble denotes AuM. In the industry the Company competes mostly with large investment and private banks. These all of-fer difof-ferent propositions which are mostly defined by the above three factors. To give an example, the client type defines the product range the wealth manager is required to provide. UHNW clients have more complex needs than an affluent cli-ent. Therefore, wealth managers targeting higher volume segments will provide clients with structured lending and more complex capital market products, whereas wealth managers which target affluent client segments will heavily invest into Robo-advisory tools, for instance. Secondly, most wealth managers are concen-trated on certain markets due to issues in regulatory and administrative burdens. Just some remain to be operating global, with UBS as the most global wealth ager. The third point is AuM, which defines the operating leverage a wealth man-ager can apply. It is important to scale its operations and to fund the more and more heavily weighting IT cost/investments.
UBSGROUPAG
In the past, wealthier individuals were more likely to use many wealth managers as form of diversification. Nowadays, as more advanced IT tools can provide mag-nificent risk management, individuals are incentivized to aggregate assets in a one house solution in order to optimize risk-adjusted performance by eliminating uni-dentified risks. So, it is more likely that larger asset managers benefit from this consolidation trend of holistic wealth management approaches that we already mentioned in trends and challenges.
The wealth management industry had a very good year in 2017. According to GlobalData, the top 10 wealth managers by AuM could increase their managed volumes by 14%. And while “size is king”, UBS tops the global wealth manager ranking with USD 2,402.8 bn assets under management. Looking at figure 31, UBS AuM grew by roughly 16% in 2017, in line with the industry. On the second and the third rank are the large American wire-houses Bank of America Merrill Lynch and Morgan Stanley with about 45% of UBS’ AuM. These are more focused on the American market and do not compete with UBS in most other markets. Although their AuM growth was higher than UBS’, it is largely derivable by a better market performance in the US.
In terms of return on tangible equity (RoTE), one can see American based banks ahead the European competition. For 2019E, American banks are expected to de-liver an average RoTE of 14.6%, whereas European banks fall behind with 7.2% less than half profitable. UBS large presence in the US is bolstering profitability. We estimate a RoTE of 13.4% for 2019E (see figure 32), impelled by a strong AuM recovery in the US. In general, banks positive working environment will drive RoTE growth.
A strong profitability allows UBS to return liquidity to shareholders. In 2017, the Company was able to payout a dividend of CHF 0.65 per share. We expect a div-idend growth of 7.7% for 2018E with a divdiv-idend of CHF 0.70, which corresponds to a payout ratio of about 50%. Thus, we expect UBS to deliver a dividend yield of 5.1%, where only HSBC and BNP are able to demonstrate higher yields (see figure 33). In a very volatile market environment we think market participants will favor higher-yielding assets. With a price of CHF 12.24 per share, UBS represents an investment with a significant upside potential linked with attractive dividend yields. Overall, we see UBS well suited against its peers. We like especially the Com-pany’s size factor and geographically diversified revenues, which represent a com-petitive advantage against most peers. Moreover, an attractive payout policy bol-stered by a strong profitability which is comparable to the American competition adds to the positive outlook.
UBSGROUPAG
Financials
Loans
UBS’ loan book is closely tied to the overall debt market. Before examining UBS loan structure, we will look at macroeconomic figures that influence the Company’s loan performance.
Beginning with loans to private households, figure 34 and 35 show that the level of debt in percentage of GDP reached its peak - in the US and in EU - in the financial crisis in 2007 - 2010 and was significantly declining (at least for the US) since then. European households had a relatively low level of indebtedness also before the financial crisis of roughly 52%. The declining trend can also be explained by the strong real GDP growth in the past years. On the other hand, households in Swit-zerland followed the opposite trend and increased their liabilities by more than one per cent per anno over the last years.
In our view, we expect the household debt in percentage of GDP ratio to remain fairly constant due to a strong GDP growth of over 2% in UBS’ main markets and an expected slowdown of borrowers due to imminent interest rate hikes in 2019, also in the EU and Switzerland.
By its nature private debt is very cyclical and highly correlated to the overall health of the economy. The more debt is issued, the better the environment for corporates to grow. Figure 36 represents the private debt in percentage to GDP for UBS’ main markets. We can see that it is much more volatile than household debt, YoY changes reach from about +8% to -8%. Switzerland followed a similar trend as in household debt and is expected to reach the threshold of 180% in 2018, which is more than three times the debt to GDP ratio of the US and almost double of that of the EU. Similar to households, we expect corporates to deleverage due to a slight slowdown in economic growth and an increase in interest rates.
Residential mortgages make up 45% of UBS’ loan portfolio. The share of secured mortgages has a significant impact on the riskiness of the overall loan portfolio. Residential mortgages are less risky and have longer maturities as e.g. consumer loans. It assures the Company’s interest income in the long run. Over the last five years, total outstanding residential mortgages grew by more than 2.5% and 2.0%, in the EU and the US, respectively. Although UBS had weaker growth in 2015 and 2016, we expect a rebound closer to market growth. Additionally, Lombard loans make up the second rank (36%) in the Company’s loan composition. Both, the share of mortgages and Lombard loans, did not significantly change over recent
UBSGROUPAG
Interest rates will have a deci-sive impact on deposit growth.
years. Therefore, we expect no substantial changes in UBS’ loan portfolio in our forecast.
Since loan growth is highly dependent on the overall economy, we based our esti-mates on GDP growth too. As UBS generates most of its revenues internationally, we considered a weighted-average GDP growth of the Company’s exposure mar-kets.
Concluding, we observed a constant growth of residential mortgages as well as a rather constant household debt to GDP ratio. The overall GDP growth is expected to be weaker than the past years, and yet, we see a weighted GDP growth of 2.8% in 2018E for UBS’ exposure markets. Based on our analysis, we expect UBS loan portfolio to grow by 2.5% and 2.2%, in 2018E and 2019E (see figure 38).
Deposits
The largest source of how banks fund themselves is accomplished through depos-its. Therefore, with an increasing loan book, also funding needs to enlarge either through equity, debt or liabilities against customers. While equity is too expensive, deposits provide a modest amount of interest on costumers account; a cheap and efficient way to take advantage of the spread between interest margins on loans and deposits.
In general, three factors have a significant impact on deposit growth:
- GDP growth: A growing economy leads to capital expenditures, partly
through higher lending, which creates on the other hand new jobs with salaries, and so, new deposits.
- Interest rates: The level of interest rates is a key driver behind deposit
growth. The lower the interest depositors earn on their accounts, the less the opportunity cost someone would earn on other investments. Recent regulatory tightening encouraged banks to increase the use of deposits in their funding.
UBSGROUPAG
- Inflation: The relationship between interest rates and inflation is well
known. Within an environment of ultra-low interest rates and generally lower inflation, it hasn’t had a decisive role on deposit growth in the past. And however, the trend of the FED, ECB and SNB to raise interest rates will encounter the inflation growth, we see no significant change of influ-ence on deposit growth.
Overall, banks have been successful in strengthening their deposit base. Since 2012, deposits of UBS’ main competitors have grown by 5.3% on average, while UBS recorded a rather weak growth of 2.6%. This was mainly caused by a decline of customers deposits of CHF 15 bn, primarily in the Americas, reflecting a re-sponse to rising interest rates and higher equity markets. A look on banks with a similar exposure in the United States confirms the same trend, e.g. for Bank of America Merrill Lynch and HSBC.
As seen in figure 40, the Company’s funding composition has not changed signifi-cantly over 2016 and 2017. Although the outflows in the Americas, deposits repre-sent 60% of UBS’ funding, while long-term debt slightly increased to 21%. Thus, deposit growth plays a decisive role in loan funding also for UBS.
UBS’ loan-to-deposit ratio (LDR) of 82% is in line with its peers and did not change significantly over a five-year horizon (see figure 41). Banks usually operate within an LDR range of 80 – 90%. We see no significant liquidity risks associated with UBS, although we forecast an increasing LDR due to expected interest rate hikes and weaker GDP growth in 2019E.
UBSGROUPAG
Capital strength the main pillar for capital returns.
Capital returns
Since the financial crisis in 2008 capital requirements have been one of the hot topics. The Basel III regulation requires banks to set aside enough liquidity to cover losses in case of a crisis.As a main principle, the amount of capital required relies on the risk classification of a bank’s assets. With Basel III, the Basel Committee on Banking Supervision (BCBS) finalized those capital requirements. It determines three important ratios.
- Common Equity Tier 1 (CET1) ratio: It requires a minimum ratio of 4.5%
of risk weighted-assets (RWA); additionally, a capital conservation buffer of 2.5%, and for systemically important banks (SIBs), in case of UBS a capital surcharge of 1.0%
- Tier 1 capital ratio: It requires a minimum ratio of 6.0% of risk-weighted
assets, a capital conservation buffer of 2.5% and the capital surcharge of 1.0% for SIBs
- Total Capital ratio: It requires a minimum of 8%, plus the 2.5% capital
conservation buffer, of which 8.5% must be Tier 1 capital; and the capital surcharge of 1.0% for SIBs
In addition to Basel III requirement, Swiss authorities demand - from Swiss sys-tematically Reliable Banks (SRB) - a minimum total capital ratio of 12.86% of RWA and a leverage ratio requirement of 4.5%. Based on market share and the leverage ratio denominator (LRD) UBS is expected to deliver an additional 1.44% of RWA and 0.5% of LRD, resulting in a total ratio of 14.3%; which of at least 10% must be met with CET1 capital.
As seen in figure 42, UBS’ CET1 ratio of 13.8% is the highest in the peer group and fully fulfills the requirements for Swiss systemically relevant banks, which are stricter than the Basel III requirements. The capital strength is a major requirement for UBS’ share repurchase program, which will potentially be extended under im-proving conditions.
Over the past few years, UBS reduced its CET1 capital ratio to 13.8% and is plan-ning to operate with a fully applied CET1 ratio of around 13% for 2018 – 2020 (see figure 43). Therefore, we expect UBS to build up risk-weighted assets of around CHF 35 bn to boost probability. On the other side, UBS strengthened its core cap-ital ratio, which represents the degree on how a bank is leveraged to its consoli-dated assets. The higher the ratio, the higher the likelihood a bank withstanding negative shocks against its balance sheet. The CET1 leverage ratio gradually in-creased to 3.7% in 2017 and we expect it to further accelerate to 4% until 2020E.
UBSGROUPAG
Extended buybacks could complete UBS’ equity story.
If that is the case, we believe UBS would be capable of extending its share repur-chase program to CHF 4 bn from the committed CHF 2 bn 2018 – 2020.
In figure 44 and 45, you find an illustration of potential capital returns until 2020E. We have included our assumptions for litigation provisions, our current earnings forecasts, combined with the extended share buybacks, such that the CET1 lever-age ratio increases slightly from the current 3.7% to 4.0% at end 2020.
Very dependent on how UBS will undertake buybacks in each year, we estimate the total yield (including dividend payouts and share buybacks) to be c. 8.4% for 2019E and c. 10.7% for 2020E. This would mean a very attractive capital return story. However, one has to consider macro headwinds which could weaken earn-ings generation in upcoming years.
Net interest income
Low and negative interest rates in the EU and Switzerland have negatively affected Bank’s net interest income. As the only global wealth manager, UBS is benefiting of its broad geographic presence. Its loan to AUM ratio remains relatively low at 7.4%, leaving enough upside for significant volumes growth. In addition, the USD rates increase should continue to translate into higher NII. This will boost the op-erational leverage holding down cost. Q2 and Q3/18 lending growth in the US was mainly funded by cheap USD deposits outside the US (e.g. Hong Kong). In figure 46, we highlight that NII has grown by 3.1% since 2013, adding more than CHF 1 bn of net interest income. Growth was mainly driven by stronger interest income in connection with lower deposit beta as mentioned in the “Private Wealth Manage-ment markets” section. Therefore, we see interest income growing at a 4.9% figure p.a., while interest expense is growing by 2.2% p.a. until 2020E. With our esti-mates, interest expense to interest income will decrease by 6% to 48% for the next two years. After that, we see the deposit beta largely exploited for the eurozone and Switzerland as well, so that the ratio reverts to normal levels at around 52%.
UBSGROUPAG
Non-interest expenses
The Company completed its cost-cutting program and delivered net-savings of CHF 2.1 bn. Total expenses reduced by 5.3% to 23,799 in 2017A, mainly driven by a reduction of general and administrative costs. Personnel expenses have been stable, which account for two-thirds of total expenses (see figure 48). IT costs made up 9.4% of total revenues, which appears quite low compared to its peers (e.g. BAML 18.3%, CS 14.3).
Additionally, UBS announced a restructuring program of its Corporate Center of CHF 0.8 bn over the next three years. Looking at UBS‘ peers in figure 49, the Company‘s C/I ratio is relatively high with potentials to improvement. We estimate a C/I ratio of 74% in 2019E, improving to 72% in 2020E as the net cost savings from the corporate center come through.
Litigations. UBS is accused of assisting clients to evade tax by the French state,
authorities are now seeking compensation of EUR 1.6 bn. They say that UBS‘ clients may have shifted up to EUR 9.8 bn overseas in order to avoid tax. The case has been going on since 2012, and according to Bloomberg, the verdict is expected to be delivered on 20 February 2019. Higher legal provisions could impose a restriction on UBS’ ability to astonish markets with higher-than declared buy-backs.
Net fee and commission income
The second part of UBS’ revenue block is made of net-fee & commission income, which is the difference between commissions received and commissions paid. UBS splits this position in Underwriting fees, M&A and corporate finance fees, Bro-kerage fees, Investment fund fees, Portfolio management and advisory fees and Other. On the cost side, UBS pays Brokerages and Other fees. Portfolio manage-ment and advisory fees make up 39% of the fee and commission income compo-sition of M9/18, followed by Investment fund fees with 25% and Brokerage fees with 18% (see figure 50).
Figure 51 shows a YoY growth rate of 2.9% from 2013A – 2018E. Total net fee and commission income are predominantlydriven by PM, which has been the only reliable growth factor in the revenue block pointing a CAGR of 6.7%. For the third quarter of 2018, Investment fund fees increased by CHF 166 mn to 3,108 mn, mainly in GWM, largely impelled by an increase in invested assets and more in-tense mandate penetration. For Q4/18, we expect a rather flat performance due to AuM volume declines driven by volatile and declining markets, and yet growing by 6% to over CHF 18,000 mn for end 2018E.
UBSGROUPAG
Equity valuation models to be more suitable for valuing banks.
Valuation
We calculated UBS’ intrinsic value through the Flow-To-Equity (FTE) approach. It is argued that banks are best valued by applying equity-, rather than enterprise valuation models. This relies on the nature of financial firms where cashflows can-not be easily estimated. Capital expenditures, working capital and especially debt is not clearly defined. Besides that, banks are working under authority’s supervi-sion which largely decides how banks must be capitalized and how fast they are allowed to grow, e.g. loan books; which also includes banks risk-taking behavior. A bank makes money on the margin spread between borrowers and lenders, and from other services it offers, e.g. wealth management solutions in UBS’ case. This makes it different to any other non-financial firm which main activity is to sell or produce physical products. Banks debt can be seen as operating capital the bank is working with to earn interest on. In other words, “what wood is to carpenters is debt to a bank”. But even if one can define and measure its debt, there is still a large difference in financial leverage. Banks tend to fund their business with more debt than non-financial firms. Consequently, when valuing a financial firm with an enterprise model, small changes in the value of the firm’s asset can lead to a large shift in equity value.
Consequently, capital for UBS valuation is to be narrowly defined as including only equity capital. The two key drivers are namely cost of equity, which is a function of risk resulting from the firm’s equity investment, and the return on equity (RoE), which is determined by the bank’s financial and operational business development. Following we will describe our valuation methodology for the FTE approach, and for verification purposes, we also adapted a relative valuation with trading multi-ples.
FTE Valuation
The Flow-to-Equity approach is simplistic the share of future cashflows that can be attributed to shareholders, discounted by the cost of equity, which is in turn deter-mined by markets. Table 4 represents the formula which is to be used to identify the flow to equity. It considers the change in assets and change in liabilities, so that we obtain the true value for equity investors for the reasons mentioned above. Secondly, we calculated UBS’ cost of equity by the CAPM model (see table 5). For the risk-free rate we took the 10-year Swiss government bond rate which is slightly negative and implied a market risk-premium of 7.9% with a beta against the SMI
UBSGROUPAG
of 1.24. This results in CoE of 11.0%. To verify those implications, we conducted a robustness test with a dividend growth model:
With a dividend of CHF 0.70 (2018E) per share, implying a dividend growth of 7%, we come to a CoE of 11.4%. This outcome is in line with our CAPM results. For the further FTE calculations, we considered CoE of 11% and an FTE growth rate in perpetuity of 2%, which reflects our long-term view of UBS strong wealth man-agement position in the market. Thus, we strongly endorse UBS, with a “BUY”
recommendation, and set a price target of CHF 18.50 per share for end 2019
for our base case scenario.
Following, we conducted a scenario analysis with a more optimistic-, our base case, and a more pessimistic scenario. Although, we assign 100% weight on our base case scenario methodology.
Bull CHF 25.00
Stronger activity volumes in GWM, with NNM recovery in the Ameri-cas. Persistent structural PBT growth in IB, 11% CoE and 4% long-term growth. Potential catalysts: Resolution of trade tensions be-tween the US and China and less litigation cost, e.g. France tax case.
Base CHF 18.50
2% revenue CAGR 2018 – 2020E, mainly driven by GWM. Costs base to remain stable. Share buybacks of CHF 2 bn 2018-2020E. 11% CoE and 2% long term-growth.
Bear CHF 11.00
Weaker activity volumes in GWM and receding IB revenues. NNM outflows and shrinking markets. Higher litigation cost and limited share buyback program due to insufficient capital strength. 11% CoE and 0% long-term growth.
Cost of Equity = Dividend 2018E
UBSGROUPAG
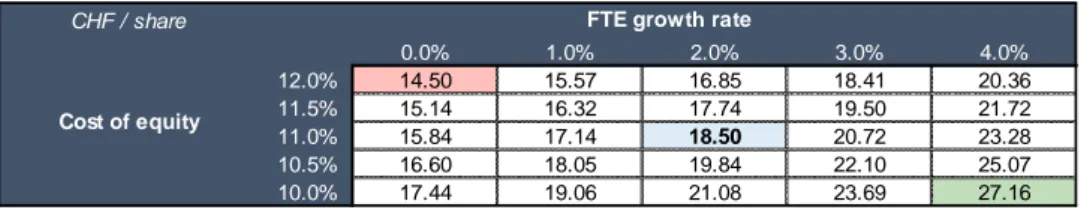
Sensitivity ranges from CHF 14.50 to CHF 27.16 for FTE model.
FTE Sensitivity
Table 7: Sensitivity analysis
Source: Analyst’s estimates
Table 7 shows various share price scenarios for different CoE and FTE growth rate perpetuities. The results for the sensitivity analysis range from CHF 14.50 to CHF 27.16 per share. In an unfavorable case with CoE of 12.0% and a sustainably weaker FTE growth rate of 0.0%, UBS’ share price would move down to CHF 14.50. This suggests a capital gain of roughly 18%. On the other hand, with more favorable figures, where CoE to be 10.0% and FTE 4.0%, the share price would reach CHF 27.16. However, with our model estimates, the most appropriate share price for UBS’ intrinsic value amounts CHF 18.50.
Relative Valuation
We can also value UBS’ share price by comparing it to its main competitors. To find an applicable peer group, the following criteria have been considered:
- similar business activities with large wealth management revenues; - similar market capitalization;
- and similar geographic presence.
As UBS is the largest wealth manager in terms of assets under management, we heavily weighted the factor when selecting the peers. About 40% of revenues are generated in the US, and in fact, over 75% of total revenues are obtained with international business activities. Thus, we selected American, European and Swiss major banks. With a strong presence in Switzerland and Personal & Corporate Banking activities also Swiss universal banks were taken into account.
We organized the peer group by geographic areas - the US with JPMorgan, Bank of America Merrill Lynch, Morgan Stanley, Citigroup and Wells Fargo; plus, Euro-pean banks with HSBC, BNP Paribas and Deutsche Bank; and lastly Switzerland with Julius Baer and Credit Suisse. We used the two most reliable multiples to value a bank, which is the Price-to-Earnings ratio (PE) and the Price-to-Book Value ratio (P/BV). CHF / share 0.0% 1.0% 2.0% 3.0% 4.0% 12.0% 14.50 15.57 16.85 18.41 20.36 11.5% 15.14 16.32 17.74 19.50 21.72 11.0% 15.84 17.14 18.50 20.72 23.28 10.5% 16.60 18.05 19.84 22.10 25.07 10.0% 17.44 19.06 21.08 23.69 27.16
FTE growth rate
UBSGROUPAG
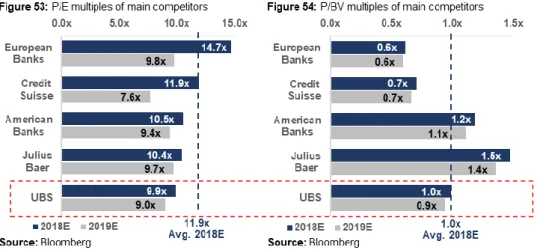
Trading multiples suggest a share price of CHF 13.70 and 19.10 for P/BV and P/E, respec-tively.
Figure 53 shows the estimated P/E ratios of 2018E and 2019E. As one can see, UBS has the lowest P/E ratio among its peers (9.9x), which have an average of 11.9x in 2018E. Especially European banks are trading high compared to its Amer-ican and Swiss competitors. However, in terms of P/BV UBS is in line with the average of 1.0x for 2018E (see figure 54). When applying the derived multiples, we receive a share price range of CHF 13.70 to CHF 19.10, which confirms our results from the FTE scenario analysis.
UBSGROUPAG
Appendix
UBSGROUPAG
Disclosures and Disclaimers
Report Recommendations
Buy Expected total return (including expected capital gains and expected dividend yield) of more than 10% over a 12-month period.
Hold Expected total return (including expected capital gains and expected dividend yield) between 0% and 10% over a 12-month period.
Sell Expected negative total return (including expected capital gains and expected divi-dend yield) over a 12-month period.
This report was prepared by TIZIAN BASSLER, a Master in Finance student of Nova School of Business & Economics (“Nova SBE”), within the context of the Field Lab – Equity Research.
This report is issued and published exclusively for academic purposes, namely for academic evaluation and masters graduation purposes, within the context of said Field Lab – Equity Research. It is not to be construed as an offer or a solicitation of an offer to buy or sell any security or financial instrument.
This report was supervised by a Nova SBE faculty member, acting merely in an academic capacity, who revised the valuation methodology and the financial model.
Given the exclusive academic purpose of the reports produced by Nova SBE students, it is Nova SBE under-standing that Nova SBE, the author, the present report and its publishing, are excluded from the persons and activities requiring previous registration from local regulatory authorities. As such, Nova SBE, its faculty and the author of this report have not sought or obtained registration with or certification as financial analyst by any local regulator, in any jurisdiction. In Portugal, the author of this report is not registered with or qualified under COMISSÃO DO MERCADO DE VALORES MOBILIÁRIOS (“CMVM”, the Portuguese Securities Market Authority) as a financial analyst. No approval for publication or distribution of this report was required and/or obtained from any local authority, given the exclusive academic nature of the report.
The additional disclaimers also apply:
USA: Pursuant to Section 202 (a) (11) of the Investment Advisers Act of 1940, neither Nova SBE nor the author of this report are to be qualified as an investment adviser and, thus, registration with the Securities and Ex-change Commission (“SEC”, United States of America’s securities market authority) is not necessary. Neither the author nor Nova SBE receive any compensation of any kind for the preparation of the reports.
UBSGROUPAG
Germany: Pursuant to §34c of the WpHG (Wertpapierhandelsgesetz, i.e., the German Securities Trading Act), this entity is not required to register with or otherwise notify the Bundesanstalt für Finanzdienstleistungsaufsicht (“BaFin”, the German Federal Financial Supervisory Authority). It should be noted that Nova SBE is a fully-owned state university and there is no relation between the student’s equity reports and any fund raising pro-gramme.
UK: Pursuant to section 22 of the Financial Services and Markets Act 2000 (the “FSMA”), for an activity to be a regulated activity, it must be carried on “by way of business”. All regulated activities are subject to prior authorization by the Financial Conduct Authority (“FCA”). However, this report serves an exclusively academic purpose and, as such, was not prepared by way of business. The author - a Masters’ student - is the sole and
exclusive responsible for the information, estimates and forecasts contained herein, and for the opinions
expressed, which exclusively reflect his/her own judgment at the date of the report. Nova SBE and its faculty have no single and formal position in relation to the most appropriate valuation method, estimates or projections used in the report and may not be held liable by the author’s choice of the latter.
The information contained in this report was compiled by students from public sources believed to be reliable, but Nova SBE, its faculty, or the students make no representation that it is accurate or complete, and accept no liability whatsoever for any direct or indirect loss resulting from the use of this report or of its content. Students are free to choose the target companies of the reports. Therefore, Nova SBE may start covering and/or suspend the coverage of any listed company, at any time, without prior notice. The students or Nova SBE are not responsible for updating this report, and the opinions and recommendations expressed herein may change without further notice.
The target company or security of this report may be simultaneously covered by more than one student. Be-cause each student is free to choose the valuation method, and make his/her own assumptions and estimates, the resulting projections, price target and recommendations may differ widely, even when referring to the same security. Moreover, changing market conditions and/or changing subjective opinions may lead to significantly different valuation results. Other students’ opinions, estimates and recommendations, as well as the advisor and other faculty members’ opinions may be inconsistent with the views expressed in this report. Any recipient of this report should understand that statements regarding future prospects and performance are, by nature, subjective, and may be fallible.
This report does not necessarily mention and/or analyze all possible risks arising from the investment in the target company and/or security, namely the possible exchange rate risk resulting from the security being de-nominated in a currency either than the investor’s currency, among many other risks.
The purpose of publishing this report is merely academic and it is not intended for distribution among private investors. The information and opinions expressed in this report are not intended to be available to any person other than Portuguese natural or legal persons or persons domiciled in Portugal. While preparing this report, students did not have in consideration the specific investment objectives, financial situation or
UBSGROUPAG
particular needs of any specific person. Investors should seek financial advice regarding the appropriateness of investing in any security, namely in the security covered by this report.
The author hereby certifies that the views expressed in this report accurately reflect his/her personal opinion about the target company and its securities. He/ She has not received or been promised any direct or indirect compensation for expressing the opinions or recommendation included in this report.
[If applicable, it shall be added: “While preparing the report, the author may have performed an internship
(remunerated or not) in [insert the Company’s name]. This Company may have or have had an interest in the covered company or security” and/ or “A draft of the reports have been shown to the covered company’s officials (Investors Relations Officer or other), mainly for the purpose of correcting inaccuracies, and later modified, prior to its publication.”]
The content of each report have been shown or made public to restricted parties prior to its publication in Nova SBE’s website or in Bloomberg Professional, for academic purposes such as its distribution among faculty members for students’ academic evaluation.
Nova SBE is a state-owned university, mainly financed by state subsidies, students tuition fees and companies, through donations, or indirectly by hiring educational programs, among other possibilities. Thus, Nova SBE may have received compensation from the target company during the last 12 months, related to its fund raising programs, or indirectly through the sale of educational, consulting or research services. Nevertheless, no com-pensation eventually received by Nova SBE is in any way related to or dependent on the opinions expressed in this report. The Nova School of Business and Economics does not deal for or otherwise offer any investment or intermediation services to market counterparties, private or intermediate customers.
This report may not be reproduced, distributed or published, in whole or in part, without the explicit previous consent of its author, unless when used by Nova SBE for academic purposes only. At any time, Nova SBE may decide to suspend this report reproduction or distribution without further notice. Neither this document nor any copy of it may be taken, transmitted or distributed, directly or indirectly, in any country either than Portugal or to any resident outside this country. The dissemination of this document other than in Portugal or to Portuguese citizens is therefore prohibited and unlawful.