Full Terms & Conditions of access and use can be found at
http://www.tandfonline.com/action/journalInformation?journalCode=tplb20
Plant Biosystems - An International Journal Dealing with
all Aspects of Plant Biology
Official Journal of the Societa Botanica Italiana
ISSN: 1126-3504 (Print) 1724-5575 (Online) Journal homepage: http://www.tandfonline.com/loi/tplb20
Morpho-environmental strategies in the genus
Ononis L. (subsections Natrix and Viscosae) in
Western Mediterranean
J. Rocha, R. Ramírez, M. Díaz, M. Martins, I. García-Cabral, F. Amich, R.
Almeida, V. Carnide, I. Castro & A. L. Crespí
To cite this article: J. Rocha, R. Ramírez, M. Díaz, M. Martins, I. García-Cabral, F. Amich, R. Almeida, V. Carnide, I. Castro & A. L. Crespí (2018) Morpho-environmental strategies in the genus Ononis L. (subsections Natrix and Viscosae) in Western Mediterranean, Plant
Biosystems - An International Journal Dealing with all Aspects of Plant Biology, 152:1, 14-30, DOI: 10.1080/11263504.2016.1244118
To link to this article: https://doi.org/10.1080/11263504.2016.1244118
View supplementary material Published online: 20 Oct 2016.
Submit your article to this journal Article views: 153
View related articles View Crossmark data
Vol. 152, No. 1, 14–30, https://doi.org/10.1080/11263504.2016.1244118
Morpho-environmental strategies in the genus Ononis L. (subsections
Natrix and Viscosae) in Western Mediterranean
J. ROCHA1, R. RAMÍREZ2, M. DÍAZ3, M. MARTINS1, I. GARCÍA-CABRAL1,
F. AMICH2, R. ALMEIDA3, V. CARNIDE1, I. CASTRO1, & A. L. CRESPÍ1
1Centre for the Research and Technology of Agro-Environmental and Biological Sciences, Universidade de Trás-os-Montes e
Alto Douro, Portugal; 2Evolution, Taxonomy and Conservation Group (ECOMED), Department of Botany, University of
Salamanca, Spain and 3Faculty of Sciences, Department of Biology, University of Porto, Portugal
Abstract
Very similar morphologies have always been pointed out for subsections Natrix and Viscosae of the genus Ononis L. Morphological, environmental and biogeographic approaches do not show significant differences between taxa of both subsections, and only life form was pointed out as biological descriptor to explain taxonomic and ecological strategies for these taxa: Natrix is composed by perennial life forms, while Viscosae is solely represented by annual life forms. The discussion of results was conducted through the insurance hypothesis, according to which resilient or resistant behaviours, here represented by taxonomic diversity and morpho-environmental variability, described the ecological strategies for these
taxa. In this way, wider morpho-environmental variability induced more responses (higher taxonomic diversity and life
forms), i.e. more resilience. On contrary, the narrower morpho-environmental variability induced less taxonomic diversity and only perennial life forms, i.e. more resistance. Two future climate change scenarios were also used to confirm these resilience and resistance strategies for both subsections.
Keywords: Morpho-environment, biogeography, life strategies, resistance, resilience, modelling, climate change
Introduction
Ononis L. genus is composed of two subsections, Natrix and Viscosae. The main morphological difference between these subsections is based on one trait: Natrix section is represented exclusively by individuals with perennial life cycles, while Viscosae is constituted by taxa (species and subspecies) with annual life cycles (Coste 1937; Ivimey-Cook 1968; Pignatti 1982; Devesa 2000). With the exception of life cycles, these taxa have all the other morphological features in common: flowers with articulated pedicels, usually with arists; dense apical inflorescences; yellow corollas with villous and glandulous calyx; one, three or five leaflets (on rare occasions, seven leaflets per leaf); sizes of corollas, compared with calyxes; and dimensions of fruits (in some cases no longer than calyxes). These morphological characteristics overlap in taxa of both subsections. The existence of denticulate calyxes and edges are the morphological characters used to distinguish species and subspecies. The subsections analysed in this work have traditionally been considered as morphologically very close (Coste 1937;
Ivimey-Cook 1968; Franco 1971; Pignatti 1982; de Bolòs and Vigo 1984; Devesa 1987, 2000). That morphological similarity between the taxa of both subsections has also been associated with their taxonomic complexity. The lack of a representative subspecies of the specific taxon O. viscosa (as a consequence of the notorious morphological variability of this taxonomic group of subspecies), the restriction of subsection Viscosae along the Mediterranean basin or the higher morphological variability of subsection Natrix in this same area could be related to the life strategy of both subsections. Most of the specific taxonomic diversity observed in the Mediterranean basin, North Africa and Western Eurasia is concentrated in subsection Natrix.
The main aim of this work is to test the Yachi and Loreau’s insurance hypothesis (Yachi & Loreau
1999; Allison 2004) to describe ecological strategies of both subsections. This theory is used to explain the morpho-environmental variability under a resil-ience and resistance approach. Based on this theory, the strategy to describe the biogeographic responses of both subsections will be supported by the diver-sity of morpho-environmental responses: the higher
© 2016 Società Botanica Italiana
Correspondence: J. Rocha, Centre for the Research and Technology of Agro-Environmental and Biological Sciences, Universidade de Trás-os-Montes e Alto Douro, Quinta de Prados, Apartado 1013, 5000-801 Vila Real, Portugal. Tel: +351 919678905. Email: [email protected]
Morpho-environmental stragies in Ononis 15 were modelled in order to support and cement the morpho-environmental and biogeographic descriptions concerning these taxa. This tool showed itself very useful to test the results obtained by the morpho-environmental and biogeographic approaches, as it describes the persistence of the current environmental conditions under thermic and pluviometric variations.
Materials and methods
Study area and data collection
The study area of the present work comprises the Med-iterranean Basin, North Africa and South-western Europe (the area occupied by species of subsections response diversity leads to more resilience, the lower
response diversity leads to more resistance. Based on the Yachi and Loreau’s hypothesis, some taxa main-tained functioning even if others failed. In this case, life forms and taxonomic diversity were used to de-scribe which taxa or subsection guaranteed ecosys-tem functioning (resistance), under environmental stress conditions (more restricted environmental conditions).
As an approach to study their ecological strategies, potential geographic distributions of species under future climate change scenarios
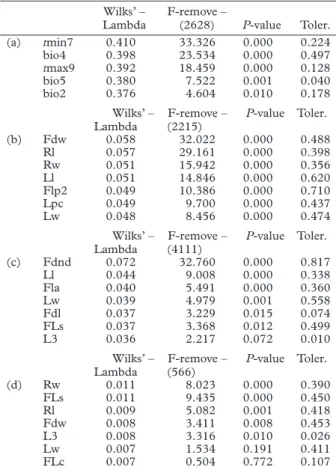
Table I. CDA values for: (a) the first three groups by cluster-ing the environmental matrix (tmin7 = minimal temperature of July, bio4 = temperature seasonality (standard deviation × 100),
tmax9 = maximal temperature of September, bio5 = maximal
temperature of warmest month, bio2 = mean diurnal range); (b) the first three groups by clustering the morphological ma-trix (Fdw = maximum calyx teeth width, Rl = maximum length fruit, Rw = maximum width fruit, Ll = maximum leave length, Flp2 = maximum pedicel length between arist and flower, Lpc = maximum length of the central leaflet petiole, Lw = max-imum leave width); (c) the first three groups by clustering the morphological matrix for subsection Natrix (Fdnd = maximum number of lobes in calyx teeth, L1 = maximum leave length, Fla = maximum arist length, Lw = maximum leave width, Fdl = maximum calyx teeth length, FLs = maximum corolle length, L3 = percentage of tri leaflet leaves); and (d) the first three groups by clustering the morphological matrix for subsection
Viscosae (Rw = maximum width fruit, FLs = maximum corolla
length, Rl = maximum fruit length, Fdw = maximum calyx teeth width, L3 = percentage of tri leaflet leaves, Lw = maximum leave width, FLc = maximum calyx length).
Wilks’ –
Lambda F-remove – (2628) P-value Toler. (a) tmin7 0.410 33.326 0.000 0.224 bio4 0.398 23.534 0.000 0.497 tmax9 0.392 18.459 0.000 0.128 bio5 0.380 7.522 0.001 0.040 bio2 0.376 4.604 0.010 0.178 Wilks’ –
Lambda (2215)F-remove – P-value Toler.
(b) Fdw 0.058 32.022 0.000 0.488 Rl 0.057 29.161 0.000 0.398 Rw 0.051 15.942 0.000 0.356 Ll 0.051 14.846 0.000 0.620 Flp2 0.049 10.386 0.000 0.710 Lpc 0.049 9.700 0.000 0.437 Lw 0.048 8.456 0.000 0.474 Wilks’ –
Lambda (4111)F-remove – P-value Toler.
(c) Fdnd 0.072 32.760 0.000 0.817 Ll 0.044 9.008 0.000 0.338 Fla 0.040 5.491 0.000 0.360 Lw 0.039 4.979 0.001 0.558 Fdl 0.037 3.229 0.015 0.074 FLs 0.037 3.368 0.012 0.499 L3 0.036 2.217 0.072 0.010 Wilks’ –
Lambda (566)F-remove – P-value Toler.
(d) Rw 0.011 8.023 0.000 0.390 FLs 0.011 9.435 0.000 0.450 Rl 0.009 5.082 0.001 0.418 Fdw 0.008 3.411 0.008 0.453 L3 0.008 3.316 0.010 0.026 Lw 0.007 1.534 0.191 0.411 FLc 0.007 0.504 0.772 0.107
Figure 1. Clustering tree of the environmental data for all the studied taxa of both subsections (C, O. crispa; T, O. talaverae; A,
O. angustissima; S, O. subcordata; R, O. ramosissima; Bv, O. breviflora;
Sb, O. sieberi; Pb, O. pubescens; P, O. porrigens; N, O. natrix; B,
O. brachycarpa; and Ct, O. crotalarioides).
Figure 2. Clustering tree of the morphological data for all the studied taxa of both subsections (C, O. crispa; T, O. talaverae; A,
O. angustissima; S, O. subcordata; R, O. ramosissima; Bv, O. breviflora;
Sb, O. sieberi; Pb, O. pubescens; N, O. natrix; B, O. brachycarpa; and Ct, O. crotalarioides).
Natrix and Viscosae). A very wide altitudinal interval represents the populations detected in this area, ranging from sea level up to 1980 m (Morocco, prov. D′Er-Rachidia, Hoher Atlas, Si. Yahia ou Youssef, SW Tounfite, 32º25′N 05°23′W; MA472348).
This contribution’s aim was to study and under-stand the morphological, environmental and bioge-ographical behaviour for all the taxa contemplated in the two subsections. The subsection Natrix includes O. natrix L., O. ramosissima Desf., O. talaverae Deve-sa and G. López, O. crispa L., and O. angustissima Lam. The subsection Viscosae includes O. pubescens L., O. viscosa subsp. breviflora (DC.) Nyman, O. viscosa subsp. sieberi (DC.) Širj., O. viscosa subsp. brachycar-pa (DC.) Batt., O. viscosa subsp. crotalarioides (Coss.) Širj., O. viscosa subsp. subcordata (Cav.) Širj. and O. vis-cosa subsp. porrigens Ball. Six hundred and thirty-five herbarium sheets from four Iberian (HVR and LISE in Portugal; MA and SALA in Spain) and two British (K and BM in England) collections, as well as material from field explorations (later included in the HVR herbarium), were examined. The herbaria designations and addresses are in accordance to Index Herbariorum codes (Thiers 2010 (continuously updated)).
Environmental analysis
The environmental matrix was elaborated from herbaria sheet locations. The environmental analysis was performed on thermic (monthly temperature) and pluviometric (precipitation averages) variables, a set of bioclimatic variables, in addition to the altitude of each location. The environmental layers were downloaded from WORLDCLIM (http://www. worldclim.org). This approach was already used in works for several taxa in the Iberian Peninsula, Western Mediterranean basin and the study area (Hodgins & Barret 2008; Rocha et al. 2012, 2014). Morphological analysis
For the morphometric analysis, 255 specimens were selected, based on the general distribution of each taxon. The criteria applied to this selection were:
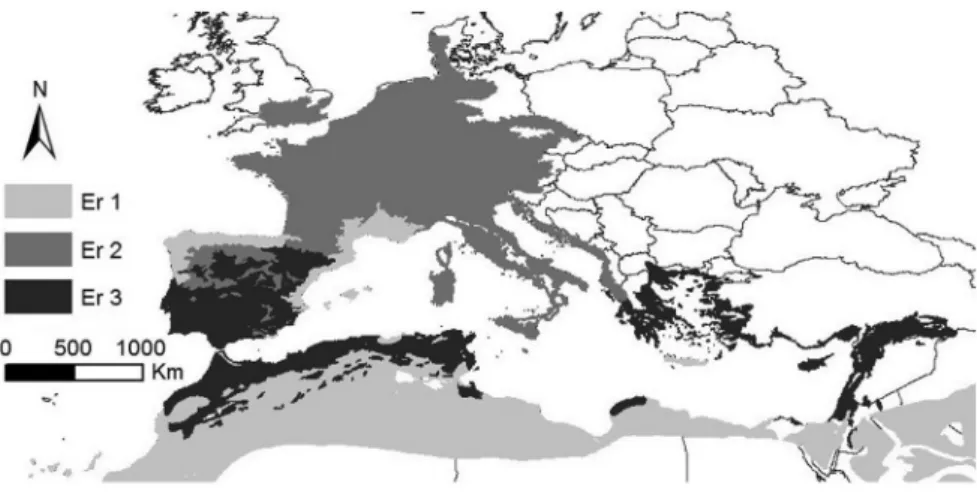
Figure 3. Clustering tree of the environmental data sorted by biogeographic areas (Er1: 1-Southeastern Iberian Shrubs and Woodlands, 8-English Lowlands Beech Forests, 9-Po Basin Mixed Forests, 12-Alps Conifer and Mixed Forests, 18-Eastern Mediterranean Conifer-Sclerophyllous-Broadleaf Forests and 25-Mediterranean Woodlands and Forests; Er2: 2-Southern Anatolian Montane Conifer and Deciduous Forests, 4-Tyrrhenian-Adriatic Sclerophyllous and Mixed Forests, 10-Pyrenees Conifer and Mixed Forests, 11-Western European Broadleaf Forests, 13-Mediterranean Conifer and Mixed Forests, 14-Aegean and Western Turkey Sclerophyllous and Mixed Forests, 21-Illyrian Deciduous Forests, 22-Italian Sclerophyllous and Semi-Deciduous Forests, 23-Mediterranean Acacia-Argania Dry Woodlands and Succulent Thickets, 26-Northeastern Spain and Southern France Mediterranean Forests and 27-Northwest Iberian Montane Forests; and Er3: 3-Southwest Iberian Mediterranean Sclerophyllous and Mixed Forests, 5-Arabian Desert and East Sahero-Arabian Xeric Shrublands, 6-Atlantic Mixed Forests, 7-Cantabrian Mixed Forests, 15-Canary Islands Dry Woodlands and Forests, 16-Crete Mediterranean Forests, 17-Cyprus Mediterranean Forests, 19-Iberian Conifer Forests, 20-Iberian Sclerophyllous and Semi-Deciduous Forests, 24-Mediterranean Dry Woodlands and Steppe and 28-North Saharan Steppe and Woodlands).
Morpho-environmental stragies in Ononis 17
were also applied for other contributions, where the same methodology was performed (Rocha et al. 2012; Almeida da Silva et al. 2014). The numbers of specimens measured per taxon were: 67 specimens of O. natrix, 51 of O. ramosissima, seven of O. talaverae, five of O. crispa, 15 of O. angustissima, 21 of O. pubescens, 26 of O. breviflora, seven of O. sieberi, nine of O. crotalarioides, 15 of O. brachycarpa, 14 of O. subcordata and 11 of O. porrigens.
Morphological variables used in the analysis were selected among the diagnostic variables used to distinguish and describe each taxon, according to the most relevant floras existing for the studied area (Coste 1937; Ivimey-Cook 1968; Franco 1971; Pignatti 1982; de Bolòs & Vigo 1984; Devesa 1987; Devesa 2000). Those variables were: maximum corolla length (FLs), maximum calyx length (FLc), maximum calyx teeth length (Fdl), maximum calyx teeth width (Fdw), maximum number of lobes in calyx teeth (Fdnd), maximum pedicel length until the arist (FLp1), maximum pedicel length between (a) all the areas occupied for each taxon should be
represented in the morphometric analysis in order to describe its morphological variability as good as possible; and (b) the morphological development and condition of the specimen, preferentially plants with flowers and fruits were measured. These criteria
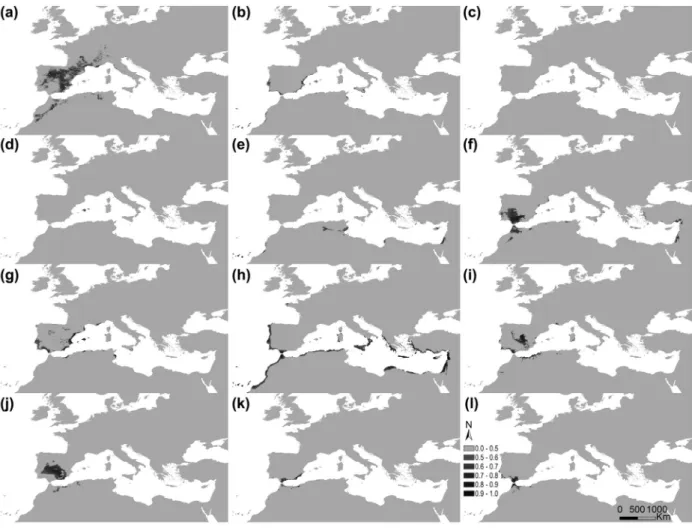
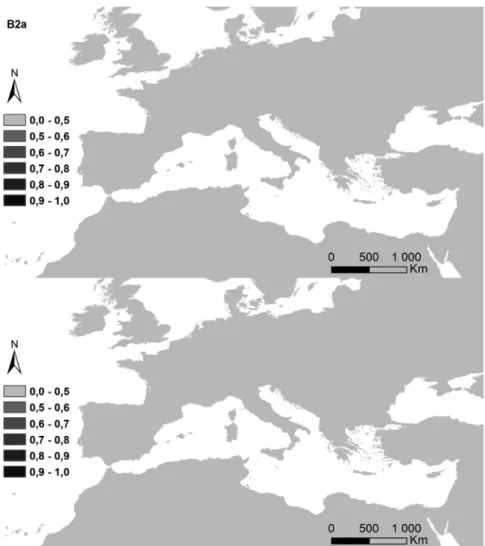
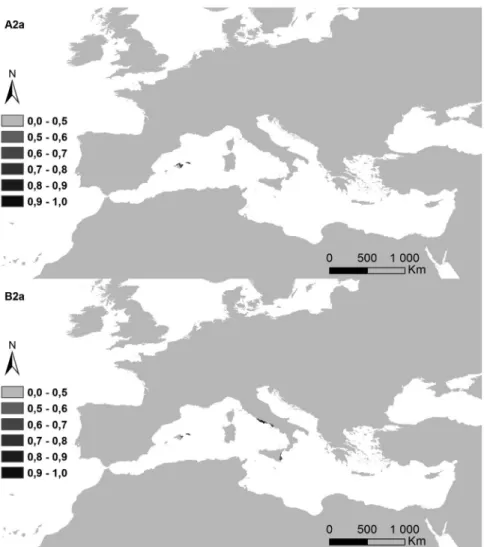
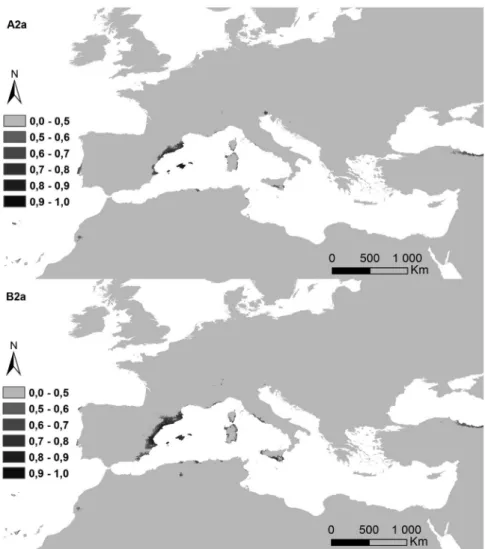
Figure 5. Potential distribution areas for Ononis taxa of subsections Natrix (a)–(e) and Viscosae (f–l): (a) O. natrix; (b) O. ramosissima; (c) O. talaverae; (d) O. crispa; (e) O. angustissima; (f) O. pubescens; (g) O. breviflora; (h) O. sieberi; (i) O. brachycarpa; (j) O. crotalarioides; (k) O. subcordata; and (l) O. porrigens. The probability of occurrence is evaluated from 0 to 50% (0.5) and by 10% intervals until 100% (1.0), in a grey scale.
Table II. Potential areas (km2) previewed for the current environmental conditions, for the A2a scenario and for B2a scenario in 2080.
Current A2a 2080 B2a 2080
O.natrix 541,235.000 338,883.000 461,488.000 O.ramosissima 87,768.000 81,155.000 109,692.000 O.talaverae 4413.000 0.000 72.000 O.crispa 5768.000 4933.000 10,333.000 O.angustissima 71,310.000 212,948.000 88,952.000 O.pubescens 291,027.000 213,187.000 172,601.000 O.breviflora 167,699.000 85,588.000 148,608.000 O.sieberi 568,698.000 423,005.000 382,443.000 O.brachycarpa 150,433.000 2402.000 21,309.000 O.crotalari-oides 220,357.000 679.000 7725.000 O.porrigens 56,429.000 1680.000 3451.000 O.subcordata 46,467.000 3531.000 44,237.000
endemism, ecological evolutionary phenomena, biomes rarity and biological distinctiveness index to distinguish territory differences. Each biogeographic area was environmentally characterized, based on the distribution of herbaria sheet. A clustering analysis was performed and the first three groups aredesigned as ecoregions 1, 2 and 3 (Er1, Er2 and Er3). The environmental and morphological matrices were biogeographically sorted by these ecoregions groups in order to describe morpho-environmental variation for each one of these ecoregion groups. At the same time, the percentage of taxa of both subsections per ecoregion was also considered. The percentage of taxa per ecoregion group was necessary to biogeographically describe the distribution of life forms (annual or perennial).
Statistical analysis
A similarity (clustering by UPGMA amalgamation and Manhattan City-Block distances) upon the arist and flower (FLp2), maximum arist length
(FLa), maximum inflorescence length (IL), maxi-mum number of flowers per inflorescence (Inf), max-imum stipule length (Lls), maxmax-imum leave length (Ll), maximum leave width (Lw), maximum petiole length (Lp), maximum length of the central leaflet petiole (Lpc), maximum fruit length (Rl), maximum width fruit (Rw), percentage of unileaflet leaves (L1), percentage of bi leaflet leaves (L2), percent-age of tri leaflet leaves (L3) and percentpercent-age of leaves with more than four leaflets (L4). The morphological study approach was firstly elaborated with all taxa together, and later separately (species of Viscosae and species of Natrix).
Biogeographic analysis
Olson and Dinerstein’s (2002) ecoregions layer was applied to the working area. Biogeographic characterization is based on the following criteria: congregation of taxonomic diversity, presence of
Morpho-environmental stragies in Ononis 19
between different analyses (morphological, environ-mental and biogeographic), as well as the discrimi-nant degree in each case (based on the respective F value and P-level obtained). Forward stepwise CDA was used as an appropriate multiple discrimi-nant analysis to identify which variables discriminate between groups (in the present case, morphological or environmental groups obtained from the cluster analysis). Statistical significance was evaluated by the F to remove, Wilks′ lambda and P-level values (Gabriel 1971; Morrison 1990; Hair et al. 1995). Due to standardization of measurements, the units employed were designated as a. u. (=arbitrary units), according to Olesen (1995).
Statistical values were also employed to describe each group per analytical description (morphologic, environment and biogeographical approaches). The average standard deviation for the first three groups was the statistic indicator applied to explain their variability.
average values per taxon, and discriminant anal-ysis (forward stepwise Discriminant Canonical Analysis – DCA) were applied with this purpose. The multivariate description followed Rocha et al. (2012) and Almeida da Silva et al. (2014). All statistical analyses were carried out using STATISTICA 9.1 (Statsoft Ltd.). The UPGA (Unweighted Pair-Group Average) amalgamation method and a City-Block distance metrics were employed to examine the similarity between morphological, environmental or biogeographic trends, graphically represented in a dendrogramatic-type format. The UPGA amalga-mation method (Sneath & Sokal 1973) is one of the most efficient for evaluating the distances of clusters (Farris 1969), as the average distance between all pairs of measured objects. In order to compare the morphological, environmental and biogeograph-ic results obtained, a discriminant analysis was elaborated for the first three groups obtained. This homogenization approach allowed the comparison
Bell 1997) and the area under curve approaches (Phillips et al. 2006). Locations with a random back-ground probability served as pseudo-absences for all analyses in Maxent (Phillips et al. 2004, 2006).
Several strategies are available for partitioning data (Pearson 2007): using independent data from different regions (Beerling et al. 1995), data at different spatial resolutions (Pearson et al. 2004; Araújo et al. 2005a) and data from surveys conducted by other researchers (Elith et al. 2006). This work followed Pearson (2007) and used a 10-fold cross-validation. For all models, the following parameters were used: 10 repetitions with cross-valida-tion, standard regularization multiplier (which affects how focused or closely fitted the output distribution is) and 500 iterations (for further details on these pa-rameters, see Phillips 2010). The obtained output (in ASCII format) was input into ArcGIS software version 9.2 (ESRI, Redlands, California, USA) as floating- point grids (Peterson et al. 2007). The probability of occurrence of the species at each site was mapped. Modelling distribution and predictions
This modelling approach was very useful to show the persistence of the current environmental condi-tions (thermic and pluviometric, in this case) under future climatic change scenarios. The persistence of environmental conditions was decisive to describe graphically the probability of failing of each taxon analysed. In this way, Maxent estimates the proba-bility distribution of a species occurrence, based on environmental constraints (Phillips et al. 2006), using species presence data and environmental variables in a GIS layer. Maxent v. 3.3.3 was used to estimate the probability of potential suitable habitat for the species occurrence, varying from 0 to 1, where 0 is the lowest and 1 the highest probability. Testing or validating the fit or accuracy of the modelling approach, as well as determining the probability of a location that indi-cated presence of a species, was ranked higher than a random background probability, was made through receiver-operating characteristic plots (Fielding &
Morpho-environmental stragies in Ononis 21
the first three branches of the clustering tree (Table I(a) and Figure 1). The environmental matrix for O. natrix + O. brachycarpa + O. crotalarioides reflected a higher continentally and more temperate climate (characterized by higher mean diurnal ranges, temperature seasonality and maximum temperature for the warmest month) than the environmental conditions for O. crispa + O. talaverae + O. angustissima + O. subcordata + O. ramosissima + O. breviflora + O. sieberi (where climate variations along seasons were clearly lower). The environmental conditions for O. pubescens + O. porrigens showed an intermediate mean diurnal range and temperature seasonality, but a higher maximum temperature for the warmest month, maximum temperature for September and wider climatic ranges in summer months.
A continuous transition from warmer and drier environments to cooler and temperate ones was de-duced by the statistical values exposed in the sup-plementary information (Annex 1): average value for tmin7 is 2.41°C in E1, 1.80°C in E2 and 1.66°C in E3. Average values for standard deviation per The climate predictors were derived from a general
circulation model (CCCMA: CGCM2) for the year 2080, under IPCC emission scenarios (SRES; A2a and B2a) for predicting future potential habitats (http://gisweb.ciat.cgiar.org/GCMPage; Ramirez & Jarvis 2008). A2a and B2a represent two scenarios with different greenhouse gas emissions. A2a describes a highly heterogeneous future world with regionally oriented economies. The B2a scenario is also regionally oriented but with a general evolution towards environmental protection. Compared to A2a, B2a has a lower rate of global warming, and therefore changes in temperature and precipitation are less intense (http://forest.jrc.ec.europa.eu/climate- change/future-trends).
Results
Environmental analysis
Both subsections, Natrix and Viscosae, presented a very low F value = 33.33 (P-level <0.00) for
obtained for subspecies brachycarpa and viscosa, and a higher morphological similarity was observed between subspecies sieberi and breviflora.
The analysis of the statistical values for the mor-phological variables showed (Annex 2) M3 as the most variable morphological group (average stand-ard deviation = 0.998), while M1 was revealed as the lowest variable morphological group (0.843).
The same analysis was performed independently for perennial and annual life forms (Table I (c) and (d)). In the first case, O. crispa was clearly separated from the other perennial species. The number of teeth in the sepals (Fdnd) was the only morpho-logical character significantly involved. The length of the central leaflet – Ll – was the most discrimi-nant character to distinguish between other taxa of subsection Natrix. Different morphological results were obtained for annual forms (subsection Viscosae). The width of fruits (Rw) and the length of calyx (Fls) were the morphological characters to environmental group reflected divergences between
E3 (136.661) and E1 (158.082) and E2 (161.989). Morphological analysis
The phenogramatic line for the first three groups obtained by similarity (F = 32.02, P-level < 0.00) distinguished the subsection Natrix from Viscosae (Figure 2), and in this last subsection distinguished O. pubescens from O. viscosa. The CDA confirmed these differences (Table I(b)), and a morphological continuity between subsection Natrix and Viscosae, by the taxon O. pubescens. Width of the calyx teeth and size of the fruits (usually longer and narrower in the section Natrix), along with the percentage of unifoliate leaves per individual (higher for O. viscosa subspecies) were the morphological characters that better described the results for the morphological differentiation of these taxa. No significant divergences were
Morpho-environmental stragies in Ononis 23
three ecoregions. The environmental characterization for these groups, based on the most discriminant environmental variables, showed that groups Er1 and Er2 have opposite environmental trends: Er1 is characterized by the highest temperature seasonality and the lowest maximal temperature for the warmest month (for September), and the lowest minimal temperature in July; Er2 had the lowest temperature seasonality, and the highest minimal temperature for July. The maximal temperature for the warmest month and the maximal temperature for September showed intermediate values between the Er1 and Er3. The Er3 also had the highest mean diurnal ranges (Er1 and Er2 have the lowest values for this parameter), maximal temperature for the warmest month and the maximal temperature for September.
The environmental statistical values (Annex 2) described Er2 with the lowest environmental variability (average standard deviation = 659.000), in contrast with Er3 (1083.000) and Er1 (1399.000). These ecoregions were firstly distinguished by distinguish the taxa of this subsection, without
sta-tistical significance to report.
Biogeographic analysis
Both subsections of genus Ononis are represented along 28 ecoregions. Three ecoregions were obtained for the phenogramatic line for the first three groups (F = 11.77, P-level < 0.00), upon the dendrogram obtained for similarity analysis (Figure 3): Er1, Er2 and Er3. The distribution map of these ecoregions is represented in Figure 4.
The percentage of taxa per ecoregion showed Er2 is clearly dominated by perennial forms: 94% taxa of subsection Natrix and 6% of subsection Viscosae. Annual forms were scattered by Er3 (50% annual forms) and Er1 (24% taxa of subsection Viscosae). O. natrix and O. ramosissima were the perennial species represented along the three ecoregion groups, while O. breviflora was the annual species detected in the
Algeria) and O. crispa (Mallorca Island, Balearean archipelago). An opposite result was detected for O. natrix (along the temperate regions of South-western Europe), O. angustissima (dispersed by the Arabian–Saharan and Macaronesian regions – Canary archipelago), O. ramosissima (littoral areas of western Mediterranean basin), O. sieberi, O. breviflora and O. pubescens (littoral areas along the entire Mediterranean basin). The remaining taxa described intermediate potential distributions, all of them concentrated in the Western Mediterranean basis. In this way, an important taxonomic effort was involved in this side of the Mediterranean region, more especially for subsection Viscosae taxa (exclusively concentrated in this area).
The potential surface occupied by each taxa in the current conditions and for both climatic change scenarios is exposed in Table II, and their maps in Figures 6a–6l). The highest decreases were observed for annual life cycles (subsection Viscosae), in annual oscillations of temperature (bio2). While Er2
maintained shorter variations for this environmental parameter, Er3 and Er1 were characterized by higher temperature oscillations along the year. Nevertheless, the areas included in Er1 are clearly the most diverse, according to higher values obtained for temperature seasonality (bio4).
On a morphological level (Annex 2), these re-sults described relevant differences between Er3 and the other two ecoregions. The statistical values per ecoregion showed higher morphological variability for Er3 (average standard deviation = 1.724), and lower values for Er2 (1.240) and Er1 (1.298). Modelling distribution and predictions
The potential distribution maps per taxon reflected the obtained environmental behaviour (Figure 5). Very restricted potential distributions were obtained for O. talaverae (South-east Spain and North- western
Morpho-environmental stragies in Ononis 25
conditions by lower taxonomic diversity, as well as a clear predominance of perennial life forms.
Discussion
Environmental, morphologic and biogeographical results obtained will contribute to the understanding of floristic strategies in Western Eurasia, the Med-iterranean Basin and North Africa. The environ-mental evolution of this region since Oligocene has induced substantial changes in its flora (Fauquette et al. 2007; Sadori et al. 2013). The morphological similarity between the taxa of both subsections an-alysed in this work has been associated with their taxonomic complexity, life cycle differences being the most remarkable character to distinguish them. A morphological characterization of the individuals was a necessary procedure in order to compare its variation against environmental variation. The cho-sen genera for this work were particularly interest-ing due to their known taxonomical uncertainties. contrast with perennial life forms (subsection Natrix).
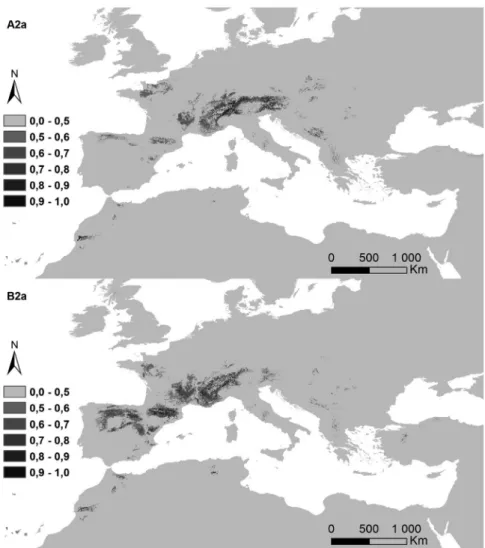
In fact, the impact of both future change scenarios reflected a decrease of 70% for A2a scenario, and 52% for B2a in the potential area of subsection Viscosae. In contrast, small increases were observed for both scenarios in the subsection Natrix. Several taxa influenced these results. For the subsection Natrix, O. angustissima increased its potential area for the harsher scenario, while O. ramosissima and O. crispa maintained similar values for both scenarios. O. talaverae was the exception, with extinction in the A2a scenario (O. talaverae). General decreases were observed for all the subsection Viscosae taxa.
The most restricted variations were depicted by Er2, while Er1 and Er3 were the most sensible to the future scenarios here applied (more evident-ly in Er3). The results exposed in Table III showed small variations for Er2, in contrast with the larg-est values obtained for the other ecoregions. Er2 was characterized in the current environmental
Balearic archipelago) and at higher altitudes. Simi-lar results have been observed for other taxa, where perennial forms expanded to northern and south-ern latitudes. These pattsouth-erns can be explained by postglacial genetic fluxes from warmer refugees (Lumaret et al. 2002; Schönswetter et al. 2005; Bhagwat & Willis 2008; Linares 2011). Annual forms adapted their biological cycles to Mediterra-nean climates, and only the taxa most resistant to drier conditions could increase their potential ar-eas (O. pubescens, O. sieberi and O. breviflora, in this case), as discussed for other genera (Paun et al.
2005; Fiz-Palacios et al. 2010).
Based on Yachi and Loreau’s insurance hypothesis (Allison 2004), environmental stress forced a greater resistance on individuals, decreasing their taxonomic diversity. In this sense, the higher environmental restrictions of Er2, in comparison with Er1 and Er3 where larger environmental variabilities were confirmed, should induce higher resistance as an ecological strategy for these taxa. The most diverse The unclear morphological differentiation of its
composing taxa, associated with its morphological variability and Mediterranean distribution, makes Ononis genus an ideal study case to test Yachi and Loreau’s hypothesis.
Both environmental and morphological approaches had very similar F value results, but not enough to detect remarkable discontinuities between both subsections. Despite no major dissimilarities, one important characteristic stands out: the high morphological variability detected for the subsec-tion Natrix (higher variance and standard deviasubsec-tion for their species than for subsection Viscosae). Along with this result, the analysis of their potential and biogeographical distribution areas showed a striking divergence between perennial and annual life forms. Perennial forms showed an expansion pattern to the extreme environments (northern or southern), limit-ing annual forms at Mediterranean areas. This is due to perennial forms occurring more frequently along occidental coasts (or in a very restricted areas of the
Morpho-environmental stragies in Ononis 27
compared with Er2, where the percentage of annual forms is extremely limited (just 6%).
Lower taxonomic diversity under higher environmental stress was also observed: eight taxa for Er2 – and sharply reduced percentages for annual taxa – whereas all the taxa of both subsections were detected across the other two ecoregions. This taxonomic performance was very similar at morpho-environmental level: greater variability for Er3, in contrast with lower variability for Er2, and intermediate results for Er1. That variability for Er2 was clearly concentrated on perennial forms of life (species of subsection Natrix), in contrast with the other environmental groups (Er1 and Er3), where that variability was spread along perennial and annual life forms. This result is also supported by the insurance hypothesis (Allison 2004), as the resilience for Er2 was almost entirely devoted to perennial species (a very small percentage of O. breviflora – annual life form – was here included), in contrast ecoregions observed in Er1 could be explained by the
geographic extension of this ecoregion. Er1 diverged from the Arabian Desert and East Sahara–Arabian Xeric Shrublands to Cantabrian Mixed Forests or Crete Mediterranean Forests. In this way, the strategy of life forms for both subsections of Ononis, which have remarkable morphological similarities (where morphological overlapping makes difficult the iden-tification of their species), could be explained as a response to those different environmental behaviours: perennial life forms reached better performances under higher environmental stress, whereas annual forms (with current distributions almost exclusively restricted to Er1 and Er3) experienced a restriction in their distributions. Differences in the percentage of annual forms (subsection Viscosae) may explain these results. In fact, the highest percentage of annual forms obtained in Er3, and the presence of more annual forms in Er1 (just 24% of taxa included in this ecore-gion) increased the morphological variability when
decreased the taxonomic and life form diversity, and transferred that resilience to the morphological vari-ability of the resistant taxa (subsection Natrix, in this case). In contrast, when lower environmental stress was observed, higher taxonomic diversity and lower morphological variability were also observed. In this sense, resistance was not correlated with taxo-nomical richness but with morphological variability under environmental stress conditions. Based on this description, the relevance of morpho-environmental variability and the associated life forms was assumed as decisive to guarantee the persistence of both sub-sections along the Mediterranean basin, Western Eurasia, North Africa and Macaronesian region.
In conclusion, the results of the current study on Ononis taxa described accurately a biogeographical dynamic as the result of the presence of perennial forms throughout the study area (higher ecological resistance), and of the concentration of taxonomic diversity in the most environmental diverse areas (higher ecological resilience), in accordance with Yachi and Loreau’s insurance hypothesis.
with Er1 and Er3 where resilience was represented by both life forms (annual and perennial).
Based on these results, the insurance hypothesis for both subsections was represented by higher re-silience in Er3 and Er1 (more diverse and heteroge-neous strategies, more intensive for Er3), and higher resistance in Er2 (less taxonomic diversification and homogeneous life form strategies). This perspective was confirmed by the application of future climate change scenarios, with smaller variations for Er2 in contrast with Er1 and Er3. Those future climatic changes involved lower taxonomic, morphological and environmental variabilities and, consequently, higher resistance behaviours gained importance in Er1 and Er3 (decreasing the potential distributions, more specially for subsection Viscosae, and their tax-onomic diversity for the most severe scenario – A2a). These results are in agreement with the Yachi and Loreau’s insurance hypothesis since taxonomic diversity is directly correlated with redundant and resilient environments, but indirectly correlated with resistant ones. Higher environmental stress
Morpho-environmental stragies in Ononis 29
Funding
This work was supported by the Fundação para a Ciência e a Tec-nologia (FCT) [grant number SFRH/BSAB/1424/2014].
Supplemental data
Supplemental data for this article can be accessed [http://dx.doi.
org/10.1080/11263504.2016.1244118].
References
Allison G. 2004. The influence of species diversity and stress intensity on community resistance and resilience. Ecol Monogr 74: 117–134.
Almeida da Silva R, Rocha J, Silva A, García-Cabral I, Amich F, Crespí AL. 2014. The Iberian species of Scilla (Subfamily Scilloideae, Family Asparagaceae) under climatic change scenarios in southwestern Europe. Syst Bot 39: 1083–1098. Araújo MB, Thuiller W, Williams PH, Reginster I. 2005a.
Downscaling European species atlas distributions to a finer resolution: Implications for conservation planning. Global Ecol Biogeogr 14: 17–30.
Beerling DJ, Huntley B, Bailey JP. 1995. Climate and the distribution of Fallopia japonica: Use of an introduced species to test the predictive capacity of response surfaces. J Veg Sci 6: 269–282.
Acknowledgements
A. L. Crespí thanks Fundação para a Ciência e a Tec-nologia (FCT) for a grant for the elaboration of the present work (SFRH/BSAB/1424/2014).
Figure 6l. Predictions for both future climate change scenarios, A2a and B2a, year 2080, for O. porrigens. Table III. Percentage of every taxa detected per ecoregion group
(Er1, Er2 and Er3) in the current environmental conditions, and for both climate change scenarios, A2a and B2a (C, O. crispa; T, O. talaverae; A, O. angustissima; S, O. subcordata; R, O. ramosissima; Bv, O. breviflora; Sb, O. sieberi; Pb, O. pubescens; P, O. porrigens; N, O. natrix; B, O. brachycarpa; Ct, O. crotalarioides).
Taxon
Current A2a B2a
Er1
(%) Er2 (%) Er3 (%) Er1 (%) (%)Er2 Er3 (%) Er1 (%) Er2 (%) Er3 (%)
C 100 0 0 58 0 0 42 0 0 A 76 0 24 38 0 19 38 0 14 N 14 36 50 3 10 2 4 21 10 R 53 17 30 10 3 17 21 5 19 T 60 13 27 0 0 0 0 0 0 Pb 10 1 89 9 0 21 4 0 34 B 5 5 90 0 0 0 0 5 19 Bv 46 4 51 35 0 7 38 2 10 Ct 9 0 91 0 0 0 0 0 0 P 5 5 90 0 0 0 0 0 0 Sb 0 29 71 0 14 43 0 14 43 S 33 0 67 0 0 0 30 0 22
Morrison DF. 1990. Multivariate statistical methods. 3rd ed. New York, NY: McGraw-Hill.
Olesen H. 1995. Properties and units in the clinical laboratory sciences I. Syntax and semantic rules (IUPAC-IFCC Recommendations 1995). Pure Appl Chem 67: 1563–1574. Olson DM, Dinerstein E. 2002. The global 200: Priority
ecoregions for global conservation. Ann Mo Bot Gard 89: 199–224.
Paun O, Lehnebach C, Johansson JT, Lockhart P, Hörandl E. 2005. Phylogenetic relationships and biogeography of Ranunculus and allied genera (Ranunculaceae) in the Mediterranean region and in the European alpine system. Taxon 54: 911–932. Pearson RG. 2007. Species’ distribution modeling for conservation educators and practitioners. Synthesis. American Museum of Natural History. Available: http://ncep.amnh.org.
Pearson RG, Dawson TE, Liu C. 2004. Modeling species distributions in Britain: A hierarchical integration of climate and land-cover data. Ecography 27: 285–298.
Peterson AT, Papes M, Eaton M. 2007. Transferability and model evaluation in ecological niche modeling: A comparison of GARP and Maxent. Ecography 30: 550–560.
Phillips SJ. 2010. Species’ distribution modeling for conservation educations and practitioners. Exercise. American Museum of Natural History. Lessons in conservation. Available: http://
ncep.amnh.org/linc.
Phillips SJ, Anderson RP, Schapire RE. 2006. Maximum entropy modeling of species geographic distributions. Ecol Model 190: 231–259.
Phillips SJ, Dudík M, Schapire RE. 2004. A maximum entropy approach to species distribution modeling. Proceedings of the 21st International Conference on Machine Leaning. New York, NY, ACM Press. pp. 655–662.
Pignatti S. 1982. Ononis L. In: Pignatti S, editor. Flora d’Italia [Flora of Italy]. Bologna: Edagricole. Vol. 1. pp. 698–705. Ramirez J, Jarvis A. 2008. High resolution statistically
down-scaled future climate surfaces. International Centre for Tropical Agriculture, CIAT. Available: http://gisweb.ciat.cgiar.
org/GCMPage.
Rocha J, Almeida da Silva R, Amich F, Martins Á, Almeida P, Aranha JT, et al. 2014. Biogeographic trends of endemic and subendemic flora in the western Iberian Peninsula under scenarios of future climatic change. Lazaroa 35: 19–35. Rocha J, Crespí AL, García-Barriuso M, Kozlowski G, Almeida
da Silva R, Honrado J, et al. 2012. Morpho-environmental characterization of the genus Baldellia Parl. (Alismataceae) in the Iberian Peninsula, Balearic and North Morocco.. Plant Biosyst 146: 334–344.
Sadori L, Bertini A, Combourieu-Nebout N, Kouli K, Mariotti Lippi M, Roberts N, et al. 2013. Palynology and Mediterranean vegetation history. Flora Mediterranea 23: 141–156.
Schönswetter P, Stehlik I, Holderegger R, Tribsch A. 2005. Molecular evidence for glacial refugia of mountain plants in the European Alps. Mol Ecol 14: 3547–3555.
Sneath PH, Sokal RR. 1973. Numerical taxonomy. San Francisco, CA: W. H. Freeman and Co.
Thiers B. 2010 (continuously updated). Index Herbariorum: A global directory of public herbaria and associated staff. New York Botanical Garden’s Virtual Herbarium. Available: http://
sweetgum.nybg.org/ih/.
Yachi S, Loreau M. 1999. Biodiversity and ecosystem productivity in a fluctuating environment: The insurance hypothesis. Proc Nat Acad Sci 96: 1463–1468.
Bhagwat SA, Willis KJ. 2008. Species persistence in northerly glacial refugia of Europe: A matter of chance or biogeographical traits? J Biogeogr 35: 464–482.
de Bolòs O, Vigo J. 1984. Ononis L. In: de Bolòs O, Vigo J, editors. Flora dels Països Catalans [Flora of the Catalan Countries]. Barcelona: Editorial Barcino. Vol. 1. pp. 530–545.
Coste H. 1937. Flore descriptive et illustrée de la France, de la Corse et des contrées limitrophes [Descriptive and illustrated flora of France, Corsica and neighboring regions]. Paris: Librairie Scientific et Technique Albert Blanchard. Tome 1. pp. 309–315.
Devesa JA. 1987. Ononis L. In: Valdés B, Talavera S, Fernández-Galiano E, editors. Flora de Andalucía ocidental [Flora of Western Andalucia]. Barcelona: Ketres Editora. Vol. 2. pp. 132–154.
Devesa JA. 2000. Ononis L. In: Talavera S, Aedo C, Castroviejo S, Herrero A, Romero Zarco C, et al., editors. Flora Iberica [Flora of Iberian Peninsula]. Madrid: Servicio de publicaciones del CSIC. Vol. 7. pp. 590–646.
Elith J, Graham CH, Anderson RP, Dudík M, Ferrier S, Guisan A, et al. 2006. Novel methods improve prediction of species’ distributions from occurrence data. Ecography 29: 129–151. Farris JS. 1969. On the cophenetic correlation coefficient. Syst
Zool 18: 279–285.
Fauquette S, Suc JP, Jiménez-Moreno G, Micheels A, Jost A, Favre E, et al. 2007. Latitudinal climatic gradients in the Western European and Mediterranean regions from the mid-Miocene (c. 15 Ma) to the mid-Pliocene (c. 3.5 Ma) as quantified from pollen data. In: Williams M, Haywood AM, Gregory FJ, Schmidt DM, editors. Deep-time perspectives on climate change: Marrying the signal from computer models and biological proxies. London: The Micropaleontological Society, The Geological Society, Special Publications. pp. 481–502.
Fielding AH, Bell JF. 1997. A review of methods for the assessment of prediction errors in conservation presence/absence models. Environ Conserv 24: 38–49.
Fiz-Palacios O, Vargas P, Vila R, Papadopulos AST, Aldasoro JJ.
2010. The uneven phylogeny and biogeography of Erodium (Geraniaceae): Radiations in the Mediterranean and recent recurrent intercontinental colonization. Ann Bot 106: 871–884. Franco JA. 1971. Ononis L. In: Franco JA, editor. Nova flora
de Portugal (continente e Açores) [New Flora of Portugal (Continental and Azores)]. Lisboa: Astória Lda. Vol. 1. pp. 345–351.
Gabriel KR. 1971. The biplot graphic display of matrices with application to principal component analysis. Biometrika 58: 453–467.
Hair JF, Anderson RE, Tatham R, Black WC. 1995. Multivariate data analysis with readings. 4th ed. Englewood Cliffs, NJ: Prentice-Hall International.
Hodgins KA, Barret SCH. 2008. Geographic variation in floral morphology and style-morph ratios in a sexually polymorphic daffodil. Am J Bot 95: 185–195.
Ivimey-Cook RB. 1968. Ononis L. In: Tutin TG, Heywood VH, Burges NA, Moore DM, Valentine DH, Walters SM, et al., editors. Flora Europaea. Cambridge: Cambridge University Press. Vol. 2. pp. 143–148.
Linares JC. 2011. Biogeography and evolution of Abies (Pinaceae) in the Mediterranean Basin: The roles of long-term climatic change and glacial refugia. J Biogeogr 38: 619–630.
Lumaret R, Mir C, Michaud H, Raynal V. 2002. Phylogeographical variation of chloroplast DNA in holm oak (Quercus ilex). Mol Ecol 11: 2327–2336.