Nova School of Business and Economics
Essays in Environmental and Happiness Economics
Author: Advisors:
Vladimir Otrachshenko Professor Maria A. Cunha-e-Sá
Professor Luis Catela Nunes
Contents
Acknoledgements iii
Preface v
Chapter 1. Protesting and Justifying: A Latent Class Model for
Con-tingent Valuation with Attitudinal Data 1
1.1. Introduction . . . 2
1.2. The Model . . . 5
1.3. Case Study . . . 10
1.4. The Data . . . 12
1.5. Estimation Results . . . 13
1.5.1. Justi…cation Bias . . . 14
1.6. Conclusion . . . 18
References . . . 20
1.A. Appendix . . . 24
1.A.1. Attitudinal Questions . . . 24
1.A.2. Tables . . . 25
1.A.3. Figures . . . 30
Chapter 2. Protest Attitudes and Stated Preferences: Evidence on Scale Usage Heterogeneity 33 2.1. Introduction . . . 34
2.2. The Model . . . 36
2.3. Case Study . . . 41
2.4. Estimation Results . . . 42
2.4.1. Scale Usage Heterogeneity . . . 44
2.5. Conclusion . . . 46
3.A. Appendix . . . 49
2.A.1. Attitudinal Questions . . . 49
2.A.2. Tables . . . 50
2.A.3. Figures . . . 53
Chapter 3. Life (Dis)satisfaction and the Decision to Migrate: Evi-dence from Central and Eastern Europe 55 3.1. Introduction . . . 56
3.2. Literature Review . . . 58
3.3. Methodology . . . 61
3.3.1. The Model . . . 61
3.3.2. Robustness Check . . . 66
3.4. The Data . . . 68
3.5. Results and Discussion . . . 70
3.3.1. Individual Level E¤ects . . . 70
3.5.2. Country Level E¤ects . . . 72
3.5.3. Migration Decisions in CEE and non-CEE Countries . . . 74
3.6. Conclusion . . . 79
References . . . 80
3.A. Appendix . . . 84
3.A.1. Tables . . . 84
Acknowledgements
I would like to thank my supervisors, Professor Maria A. Cunha-e-Sá and Professor
Luis Catela Nunes, who always encouraged and gave valuable advice during my PhD
journey. Without their support this thesis would not have been completed. Also, I
would like to thank my coauthor Olga Popova and my friends Bernardo Pimentel,
Fazer Rahim, Nuno Sobreira, Renato Rosa, Rodrigo Araujo, and Timur Gabunya.
I gratefully acknowledge …nancial support from Fundação para a Ciência a
Preface
This dissertation consists of three chapters in the …eld of Environmental Economics
and Happiness Economics. The …rst two chapters explore the willingness-to-pay for
the landscape preservation for individuals with di¤erent attitudes. The last chapter
examines the relationship between life satisfaction and the individual decision to
migrate.
In the …rst chapter, we develop a latent class model for estimating
willingness-to-pay (WTP) for public goods using simultaneously contingent valuation (CV)
and attitudinal data to identify individuals with similar characteristics, such as
WTP and protest attitudes. We …nd evidence that the answer to the CV question
in‡uences the responses to the attitudinal questions. In our case, this in‡uence
re‡ects rational behavior (budget constraint issues) and justi…cation biases related
to protest reasons, such as lack of trust in institutions or fairness issues with respect
to the distribution of the burden of preservation. The results from our empirical
application con…rm the importance of accounting for those biases.
Frequently, survey based techniques rely on the neoclassical theory of preferences
assuming that individuals behave rationally. However, the elicited preferences are
also a¤ected by individual attitudes. In order to capture the attitudes, follow up
questions are typically included. These questions are measured in discrete scale
ratings. The 5-point Likert scale (from "strongly disagree" to "strongly agree") is
quite popular. Based on the responses to the attitudinal and SP questions, a latent
class model can then be used to identify classes of individuals with similar attitudes,
preferences and underlying WTP. However, even individuals with similar preferences
and attitudes may interpret and use the same scale ratings (categories) di¤erently.
In the second chapter, we develop a latent class model that takes into account
scale usage heterogeneity within each class. In this way, individuals are classi…ed
into classes based on similarity of underlying attitudes and preferences. In addition,
we explore how this heterogeneity is associated with socio-economic and preference
variables. The …ndings of this chapter are as follows. First, we …nd evidence of the
presence of scale usage heterogeneity in the answers of a set of attitudinal questions
that varies across classes. Second, scale usage heterogeneity is associated with
socio-economic and preference variables. Third, scale usage heterogeneity is not related
to WTP. Finally, we also …nd evidence that respondents justify their response to
the CV question when answering the attitudinal questions.
In the third chapter, we provide empirical evidence of the impact of life
satisfac-tion on the individual intensatisfac-tion to migrate. The impacts of individual characteristics
and of country macroeconomic variables on the intention to migrate are analyzed
jointly. We allow for life satisfaction to serve as a mediator between
macroeco-nomic variables and the intention to migrate. Using the Eurobarometer Survey for
27 Central Eastern European (CEE) and Western European (non-CEE) countries,
we …nd that people have a higher intention to migrate when dissatis…ed with life.
The socio-economic variables and macroeconomic conditions a¤ect the intention to
migrate indirectly through life satisfaction. The impact of life satisfaction on the
intention to migrate for middle-aged individuals with past experience of migration,
low level of education, and with a low or average income from urban areas is higher
Chapter 1
Protesting and Justifying: A Latent Class Model
for Contingent Valuation with Attitudinal Data
coauthored with M. A. Cunha-e-Sá, L. Madureira, and L. C. Nunes
Abstract
This article develops a latent class model for estimating willingness-to-pay (WTP)
for public goods using simultaneously contingent valuation (CV) and attitudinal
data to identify individuals with similar characteristics, such as WTP and protest
attitudes. We …nd evidence that the answer to the CV question in‡uences the
re-sponses to the attitudinal questions. In our case, this in‡uence re‡ects rational
be-havior (budget constraint issues) and justi…cation biases related to protest reasons,
such as lack of trust in institutions or fairness issues with respect to the distribution
of the burden of preservation. The results from our empirical application con…rm
the importance of accounting for those biases.
Keywords: contingent valuation, attitudinal data, latent class model, protest
responses, justi…cation bias
1.1. Introduction
Stated preference (SP) survey techniques, such as the Contingent Valuation (CV)
approach, are widely used to elicit the economic value of public goods, such as
land preservation, biodiversity, and other environmental amenities. Often, public
agencies rely on those estimates to decide about the adoption of alternative policies.
However, many CV studies have found that some respondents do not state their
true value of the good in question (see Mitchell and Carson [33] and Carson and
Groves [9]). For instance, in open-ended formats some respondents state very high
bids (outliers) or zero willingness to pay (WTP), while in closed-ended formats some
respondents may refuse to accept any bid for reasons that are related to a rejection
of the valuation process. These are often called protest responses.1
There are many examples in the literature of di¤erent reasons for protest
re-sponses: scenario rejection, such as respondents’ beliefs that the polluter should
pay, lack of information, strategic acting, lack of trust in institutions, fairness
is-sues, disagreement with the vehicle of payment or, as Mitchell and Carson [33] (pg.
166) state, any situation leading to respondents refusing to play the game
econo-mists want them to play (see, more recently, Meyerho¤ and Liebe [32], and Olsen,
Moerkbak, and Meyerho¤ [36]).
The identi…cation and treatment of protest responses have been the subject of
a wide debate in the literature in the last two decades. In fact, in the presence
of protest responses the use of standard SP methods is not able to elicit the true
economic value that would allow for optimally providing the public good at stake,
with a resulting cost to society. In order to identify protest responses, the researcher
typically relies on the answers to a set of follow-up attitudinal questions, addressing
di¤erent reasons for protesting. Examples are given by Soderqvist [42] (ethical
1The presence of protest responses has also been examined in other formats. For instance,
beliefs indicated by lexicographic preferences), Jakobsson and Dragun [14] (ethical
beliefs indicated by fairness aspects), Morrison, Blamey and Bennett [47] (vehicle
of payment), Strazzera, Genius, Scarpa and Hutchinson [43] (method of payment
and fairness aspects), among others. Based on those answers, di¤erent criteria
have been proposed in the literature. However, these criteria are often ad hoc. In
fact, a protest response in one study could be identi…ed as a valid one in another.
This is illustrated in Dziegielewska and Mendelsohn [16]. After identifying protest
responses, the standard approach consists of removing protest responses from the
sample (see Mitchell and Carson [33], Whitehead, Groothuis, and Blomquist [45],
and Jorgensen, Syme, Bishop and Nancarrow [21] for a thorough discussion).2
In many studies, the attitudinal questions were only presented to the respondents
that were not willing to pay. However, Jorgensen and Syme [22] claim that protesting
re‡ects an attitude toward paying for the good based on a set of attitudes that are
mutually interdependent. This in‡uences respondents’ answers to the WTP question
even among those that are willing to pay. Therefore, the attitudinal questions should
be asked to all respondents (see also Carson, Mitchell, Hanemann, Kopp, Presser,
and Ruud [14], and, more recently, Meyerho¤ and Liebe [17], Dziegielewska and
Mendelsohn [16], and Meyerho¤ and Liebe [18]).
Recently, latent class models (LCM) have been used to endogenously identify
classes of individuals with similar characteristics, such as preferences or attitudes,
according to their responses to survey questions. Recent examples of empirical
appli-cations of LCM based on di¤erent types of data are given by Scarpa, Gilbride,
Camp-bell and Hensher [41] on landscape preferences from choice experiments, Walker and
Li [44] on household location decisions, and Scarpa and Thiene [39], Morey, Thacher,
2When protest responses are removed from the sample, a sample selection problem may occur
and Bre-e [34], Morey, Thiene, Salvo and Signorello [35],, Bestard, Font, and Hicks
[5], Scarpa and Beharry-Borg [40], and Bre-e, Morey and Thacher [9] on
recre-ational site choice. In the context of CV studies, and Meyerho¤, Bartczak, and
Liebe [29] use a LCM to identify classes of protesters. The methodology followed
only takes into account the responses to the attitudinal questions when estimating
the latent classes. However, since the answers to the CV questions are directly
af-fected by a respondent being a protestor or not, those answers could also be used
to better infer about class membership, which is not the case in their paper.
In this paper, we contribute to this literature by considering a LCM that allows
identifying di¤erent classes of individuals using simultaneously CV and attitudinal
data capturing di¤erent reasons for protesting, thus extending the standard CV
model. We also account for the presence of potential justi…cation biases, that is,
the possibility that for di¤erent reasons the response to the CV question a¤ects the
answers to the attitudinal questions. The justi…cation bias e¤ect was …rst suggested
by Ben-Akiva et al. [4], in the context of an integrated choice and latent variable
model, in order to capture systematic response biases in the respondents’ answers to
attitudinal questions. As an illustration, these authors mention the possibility that
in a brand choice model respondents may exaggerate their response in reporting
the perceived quality of the chosen brand. Justi…cation bias has also been
stud-ied in other contexts. For instance, in transportation literature, Polydoropoulou,
Gopinath, and Ben-Akiva [37] point out the possibility of justi…cation bias when
the respondents’ answers in stated preferences’ experiments are in‡uenced by their
actual choice. Also, in health and labor economics, Bound [7], Au, Crossley, and
Schellhorn [1], among others, analyze the relationship between self-reported health
evaluation and individual employment decision among di¤erent cohorts, …nding that
respondents that do not work state a given health problem as a more serious
limi-tation than those that work. To the best of our knowledge our paper is the …rst to
Our model is applied to a CV study regarding the preservation of the traditional
landscape of the Douro Region, a conservation area in the north of Portugal, which
has been classi…ed by UNESCO as World Cultural Heritage since 2001, due to its
unique natural and human environments. The estimation results obtained support
the existence of four classes of respondents in the sample, which di¤er in terms of
the estimated WTP and protest attitudes.
We …nd evidence that the answer to the CV question in‡uences the responses to
the attitudinal questions. In our case, this in‡uence re‡ects budget constraint issues
and justi…cation biases related to protest reasons, such as lack of trust in institutions
or fairness issues with respect to the distribution of the burden of preservation. In
fact, it may be the case that a non-protester tries to justify his negative CV response
by looking like a protestor when answering the attitudinal questions. In general, if
this justi…cation bias is ignored in the model, respondents are not adequately
classi-…ed, biasing the estimate of the economic value of the public good with implications
for policy purposes.
The remainder of the paper is organized as follows. In Section 1.2, the theoretical
setup is developed. The data is described in Section 1.3, and the case study in Section
1.4. Section 1.5 presents and discusses the estimation results. Section 1.6 concludes
the paper. Pictures, tables, and …gures are shown in the Appendix (1.A).
1.2. The Model
We develop a model that is able to describe the responses to the CV question and to
a set of attitudinal questions. The responses to these attitudinal questions contain
useful information about underlying unobserved attitudes with respect to di¤erent
elements in the survey setup such as budget constraint issues, or protesting related
to mistrust with respect to the institutional environment, or fairness issues, among
We assume that the population can be divided into a …nite number of latent
classes C that di¤er from each other in terms of their WTP and attitudes, which
in turn a¤ect the CV responses and the responses to the attitudinal questions.
Therefore, although individual class membership is not directly observed, it can be
inferred from the available data.
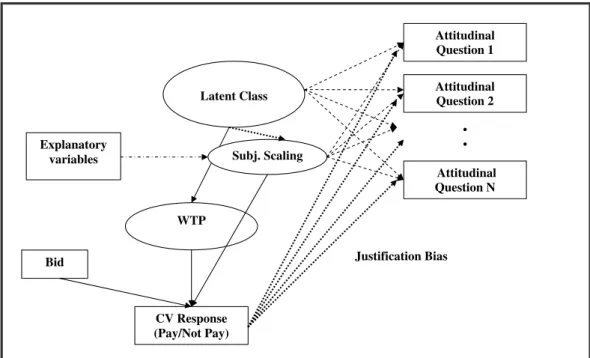
Figure 1.3 shows the general representation of our model. It is based on the
integrated choice and latent variable model proposed by Ben-Akiva et al. [4], and
Cameron and Trivedi [16] (pg. 516).3 Observed variables appear in rectangles while
unobserved variables, such as WTP and the latent class variable, appear in ovals.
The dashed arrows from the latent class variable to the responses to the attitudinal
questions represent the measurement equations describing how the probability
dis-tributions of the responses to the attitudinal questions vary across classes.
There-fore, our approach assumes that the responses to the attitudinal questions are a
manifestation of underlying latent preferences and attitudes, as in Ben-Akivaet al.
[4], Provencher, Baerenklau, and Bishop [38] and Morey, Thacher and Bre-e [34].
The solid lines represent the CV model, where the answer to the CV question
de-pends on the bid value and the underlying WTP, which in turn dede-pends on several
socio-economic and demographic variables within each class. WTP also depends
on underlying latent economic preferences that can be captured by a stochastic
component. Class membership may also depend on explanatory variables.
Finally, the model allows for justi…cation bias, represented by the dotted arrows
that link the CV responses to the responses to the attitudinal questions. This
corresponds exactly to what was proposed by Ben-Akivaet al. [4] (pg. 439). In their
case the direction of causality goes from the actual choice to the stated responses,
as the latter are obtained after the actual choices are made. Since in our application
both the CV answer and the answers to the attitudinal questions were obtained
3Our approach is exactly the same as followed in the Structural Equation Modeling (SEM)
during the interview, the direction of causality depends on the chronological order
in which they were presented. In particular, in our survey the attitudinal questions
always follow the CV question, implying that the direction of causality is as that
given by the dashed arrows that go from the CV answer to the answers to the
attitudinal questions in Figure 1.3.4
In the dichotomous choice CV question, respondents were asked whether they
would be willing to pay randomly assigned …xed amounts in order to preserve the
environmental good, or prefer not to pay, in which case environmental preservation
would be kept at a lower level (status-quo). To explain the responses to this question
we follow the random WTP approach as described in Batemanet al. [3], and Haab
and McConnell [13].
The WTP for an individual n belonging to a class c is written as follows:
WTPcn=V(Zn;#cn; c) (1.1)
whereZn is a (k 1)vector of explanatory variables that re‡ect individual-speci…c
socio-economic characteristics, #cn is a stochastic component capturing other
unob-servable individual heterogeneity, and c is a vector of parameters speci…c to each
class c = 1; :::; C. Assuming a log-linear model, we have that, conditional on the
individual belonging to classc;
ln(WTPcn)= cZn+#cn: (1.2)
In our application, we adopt the usual logit model and assume that #cn= c follows
a standard logistic distribution where c is a scale parameter a¤ecting the variance
of the stochastic term in class c such that the cumulative distribution function of
z #cn= c is given by F(z)=ez=(1 +ez):
4It can be easily observed from Fig. 1 that our model is recursive (no reciprocal or feed-back
It follows that an individual responds to the CV question with “Pay” or “Not
Pay” if his WTP is “greater” or “not greater” than the proposed bid amount,
re-spectively. De…ningun = 1when the response is “Pay”, andun = 0when it is “Not
Pay”, we have that:
un= 1 if WTP
c
n>Bidn
0 otherwise
(1.3)
where Bidn is the randomly proposed bid amount. Therefore, the probability that
an individualn belonging to class cchooses to pay is given by:
P(un=1jZn;Bidn; c) =F( c1Zn+ c
2ln(Bidn)) (1.4)
where c1 = c= c, and
c
2 = 1= c. The median WTP for an individual in class c
is given by Med(WTPcn) = exp[( c1Zn)=( c2)]:
The responses to the p attitudinal questions are denoted by a (p 1) vector
In = (In1; :::;Inp)0. These responses are categorically-ordered variables, given on a
Likert scale, taking values from 1 toT;as follows. For any given responsej = 1; :::; p,
we have that
Inj = 8 > > > > > > > > > > > > > > > > > < > > > > > > > > > > > > > > > > > :
T ; if c
j;T 1<Inj
T 1; if c
j;T 2<Inj< cj;T 1
:
:
:
2; if c
j;1<Inj< cj;2
1; if Inj< c
j;1
(1.5)
where c
j;k represents the threshold of switching from category (k 1) to category
k when an individual belongs to class c, and Inj represents in this case the
corre-sponding answers to the attitudinal questions. We denote by c the vector of all
c
The answers to the attitudinal questions are assumed to depend on the class c,
the explanatory variables Zn, and the response to the CV question un, capturing
the justi…cation bias, according to the measurement equation:
In= cZ
n+ cun+"cn (1.6)
where c and c are (p k) and (p 1) vectors of parameters, respectively, for
class c; and "cn is a p 1 vector of error terms that follows a logistic distribution
with a diagonal variance–covariance matrix c
"; which may vary across classes.
In case the CV question has no impact on the answers to the attitudinal
ques-tions, that is, if there is no justi…cation bias e¤ect, then c = 0 in equation(1:6):
This hypothesis can be tested by checking the signi…cance of the estimated vector
of parameters c.5
From equations(1:5)and(1:6)we derive the probability of individualn
respond-ingInconditional on belonging to a particular classc;having characteristicsZn;and
having responded un to the CV question, which is denoted as g(InjZn; un; c).
Finally, we also allow class membership to depend on explanatory variables:
P(cn=cjZn) =
e c+ cZn C
X
c=1
e c+ cZ n
for c= 1; ::::; C: (1.7)
As an identi…cation condition we normalize the coe¢cients in(1:7)to zero in class
C: Equation (1:7) represents the probability that individual n belongs to class c
given his socio-economic characteristics. In addition, the conditional probability
that individual n belongs to class c can also be computed using Bayes’ rule. By
using(1:4)and (1:7)we obtain the probability that an individual n belongs to class
5In the questionnaire used in our empirical application, as it is common in related studies, the
cconditional on In;un and Zn, as follows
P(cn = cjIn;un;Zn;Bidn; ) =
P(cn=cjZn)P(un=ijZn;Bidn; c)g(InjZn;un; c) C
X
c=1
P(cn =cjZn)P(un =ijZn;Bidn; c)g(InjZn;un; c)
(1.8)
The joint probability of the responses to the CV and to the attitudinal questions,
conditional only on the observable explanatory variables, is then given by
f(In; unjZn;Bidn)=
C X
c=1 Y
i=0;1
1(un=i)P(un =ijZn;Bidn; c)g(InjZn; un; c)P(cn =cjZn) (1.9)
where1( ) denotes the indicator function. The maximum likelihood estimator of the
parameters of this model are then obtained by
maxL( ) = max
N Y
n=1
f(In; unjZn;Bidn)
!
(1.10)
where =f( c1;
c 2;
c
; c; c"; c; c
; c); c= 1;2; :::; Cg and N denotes the
num-ber of observations in the sample: The estimations were performed using the EM
algorithm (see Dempster, Laird, and Rubin [12]).6
1.3. Case Study
Our empirical application is based on a survey conducted in The Alto Douro Wine
Region, located to the east of the city of Oporto, in the north of Portugal. The
cultural landscape of the Alto Douro represents an outstanding example of
hu-mankind’s unique relationship with the natural environment. The “Demarcated
Douro Region”, de…ned and regulated since 1756, is one of the oldest of all the
toric winemaking regions in the world, producing a world commodity, Port Wine,
famous for its quality around the globe. The building of its landscape pattern by
the wine producers over the last three centuries characterized by the land partition
and cultural diversity was recognized as an exceptional testimony to a living
cul-tural tradition, and the Alto Douro Wine Region became part of UNESCO’s World
Heritage cultural landscape in 2001.
In the last three decades, there has been an enormous pressure to transform
the old vineyards into modern ones with the associated destruction of the typical
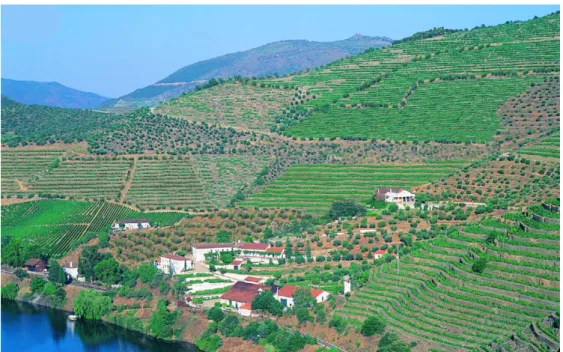
landscape, due to the need of increasing productivity.7 In this context, we investigate
the possibility of using an annual payment collected in addition to the annual income
tax to …nancially support the winegrowers in the region to prevent the destruction
of the landscape.8 However, the extent to which citizens trust public institutions
responsible for the implementation of this project or accept the vehicle of payment
are crucial issues in this context, and are not independent from the more general
economic conditions that have characterized Portugal in the last decade.
For the period 1996-2004, Kaufmann, Kraay, and Mastruzzi [23] constructed
aggregate measures of governance for 209 countries and territories, based on which
an index on Government E¤ectiveness was obtained. For the case of Portugal, this
index does not show an improvement in the country’s relative position. On the
contrary, from 2002 to 2004, it shows a negative trend.9 In the last decade, the
persistence of a large budget de…cit has been responsible for a long period of slow
growth, below the EU average, making convergence more di¢cult. Moreover, there
is recent evidence that shows a great deal of persistence in indicators related to
development, such as income, growth rates, and income inequality, as well as with
respect to institutional indicators, which are also highly correlated with development
achievements. Given the performance of the Portuguese economy in recent years,
7See pictures in the Appendix.
8This is a quasi-public good, because it is possible to exclude people from its use, by charging
a price to use the resource or making the agent spend money or time to use the resource.
a reversal of the observed trend is not expected.10 Therefore, the circumstances
described should have an impact on the attitudes regarding the provision of public
goods, and, consequently, on how people answer CV surveys.
1.4. The Data
Information was collected in the summer of 2006 through face-to-face interviews of a
random sample of visitors to the Alto-Douro Wine region.11 Interviewers followed a
worded script to avoid leading e¤ects. The questionnaire included a CV question to
measure the WTP for landscape preservation. The CV question format chosen was
the referendum dichotomous choice. Each respondent was asked a CV question for
an improvement in the level of preservation where the status-quo was the case of no
preservation, and the bids varied randomly among the respondents. The payment
mechanism that was proposed to respondents was an annual payment that would
be collected in addition to the annual income tax. The money raised would go to a
public institution that would compensate winegrowers for the incurred costs to keep
the traditional landscape.
Moreover, eleven attitudinal questions were also included in the survey
imme-diately following the CV question, and all respondents were asked to answer them
(see Appendix). The choice of these questions was based on similar studies, and
were previously tested in a pilot survey. The answers to those attitudinal questions
contain useful information about underlying unobserved attitudes with respect to
di¤erent elements in the survey setup, such as budget constraint issues (questions
B1-B4), protesting related to the lack of trust in institutions that are responsible
to implement the policy for preservation of the landscape (questions I1-I4), and,
…nally, fairness issues associated with the distribution of the burden of preservation
10Recent evidence shows that income per capita or its growth, as well as the achievements in the
areas of health, education, infrastructure, etc., are highly correlated with measures of institutional quality, ranging between 0.65 and 0.78, as mentioned in Gradstein [17].
11In order to account for the fact that the data is collected on-site would require an extension
(questions F1-F3).
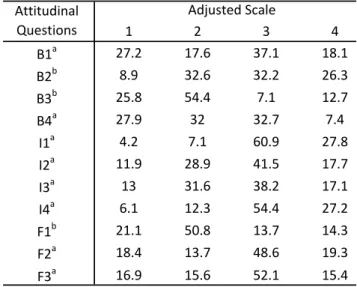
The sample used in this article consists of 706 observations. Table 1.1 provides
descriptive statistics for all the variables used in the estimations. In our survey, the
answers to the attitudinal questions were given in a …ve level Likert scale (from
1-strongly disagree to 5-1-strongly agree). Since in the …nal sample some of the extreme
levels had very few or even no observations, we decided to merge some of the levels:
levels 4 and 5 in the Likert scale were merged in questions B2, B3 and F1, while in
the remaining questions (B1, B4, I1-I4, F2-F3) levels 1 and 2 were merged instead.
Table 2 presents the resulting frequency distribution of the answers to the attitudinal
questions.
1.5. Estimation Results
In this section, we present and discuss the estimation results for the model described
in Section 1.2. Although we have considered several explanatory variables, only
gender, and an indicator of previous visits to the site were statistically signi…cant.
In order to select the number of classes we calculate six standard information criteria
(AIC, BIC, ABIC, AIC3, AICC, and CAIC). In Tables 1.3 and 1.4 we present the
results for the estimated models considering up to …ve classes, with and without
justi…cation bias. The number of classes is identi…ed by the lowest
information-criteria score. By inspection, we observe that for the model with justi…cation the
results indicate four classes, while for the model without some criteria point to four
classes while others suggest …ve. However, the model with four classes allowing for
justi…cation bias is always better than any other model without justi…cation bias
according to all criteria.12
Estimation results for the models with four classes are shown in Table 1.5, where
Model 1 does not allow for justi…cation bias, and Model 1J takes it into account.
This table is divided into four parts. The …rst corresponds to the CV equation (1.4),
and the second to the membership equation (1.7). The third presents the results
for the justi…cation bias e¤ect given by the estimated vector of coe¢cients c in
equation (1.6) for Model 1J. Finally, in the last part, the estimated median WTP,
the corresponding con…dence intervals, and the estimated proportion of individuals
in each class are presented.
For both models, the four classes di¤er with respect to both the estimated
coef-…cients in the CV model, and the probability distributions of the responses to the
attitudinal questions. Moreover, in Model 1J, there are also di¤erences in the way
the response to the CV question impacts the responses to the attitudinal questions,
that is, the four classes di¤er in terms of justi…cation bias. Regarding the CV part
of the model, the estimated coe¢cients of ln(Bid) are signi…cant in all classes in
both models, except for class 4, and have the expected negative sign. For class 1,
we …nd that those that have previously visited the site have a higher WTP.
We allow for the socio-economic characteristics to a¤ect class membership. In
particular, visit is signi…cant in class 2, while gender is signi…cant in class 1 in Model
1J. In Model 1 only gender is signi…cant in class 1. These results suggest that women
have a lower probability of belonging to class 1, while those that have previously
visited the site have a higher probability of belonging to class 2.
1.5.1. Justi…cation Bias
In our case, we consider eleven attitudinal questions. Some of them address protest
reasons related to the lack of trust in institutions that are expected to implement
the policy (questions I1-I4), fairness issues related to the distribution of the
bur-den of preservation (questions F1-F3), while others capture concerns with budget
constraint issues (questions B1-B4). In Model 1J the answer to the CV question
is allowed to in‡uence the response to the di¤erent attitudinal questions.
Conse-quently, the estimated conditional probabilities of the answers to these di¤erent
question. These estimated conditional probabilities are presented in Table 1.6 for
Model 1, and in Tables 1.7 for Not Pay, and Table 1.8 for Pay in Model 1J.
For each attitudinal question we can statistically test for the presence of the
justi…cation bias e¤ect, by checking if the coe¢cient of the answer to the CV question
is signi…cant in the third part of Table 1.5. We observe that when the justi…cation
bias e¤ect is signi…cant, the corresponding estimates are in general negative, meaning
that a positive answer to the CV question (“Pay”) has a negative impact on the
level of the Likert scale. Therefore, when a respondent answers negatively to the
CV question, that person tries to justify that response by in‡ating his responses to
those questions. For instance, it may be the case that a non-protester does not wish
to look guilty in the eyes of other people for not a¤ording to pay or not valuing
the environment highly enough, and, subsequently, tries to justify his negative CV
response by looking like a protestor when answering the attitudinal questions. As a
consequence, in each class, we may conclude that the probability distribution of the
responses to the attitudinal questions is shifted to the right in the case of “Not Pay”
when compared to “Pay”, as can be observed in Tables 5B and 5C. On the other
hand, in each class, for those questions such that the estimates of the coe¢cients
of the answers to the CV question are not signi…cant, we may conclude that all the
class members express a similar view with respect to those issues, regardless of their
response to the CV question.
In order to better understand the di¤erences between the four classes in Model
1J, we summarize the main …ndings in Table 1.9. This table is divided into three
parts. In the …rst part we identify rational behavior by checking whether ln(Bid)
is signi…cant and whether the answer to the CV question in‡uences the answers to
the questions related to budget constraint issues (questions B1-B4). In the
follow-ing part, we check for the presence of justi…cation bias related to protest reasons,
in particular, the lack of trust in institutions (questions I1-I4), and fairness issues
respon-dents answered to all the eleven questions. In particular, the results in Tables 1.7
and 1.8 are summarized by identifying for each group of questions the response level
in the Likert scale with the highest probability.
In what concerns rational behavior, we observe that ln (Bid) is signi…cant in
all classes, except for class 4. Moreover, in classes 1 and 3 all the answers to the
four questions associated with budget constraint issues are signi…cantly a¤ected
by the answer to the CV question. From the third part of Table 4, the negative
sign of the corresponding coe¢cients suggests that those that refused to pay the
bid feel more strongly about budget constraint issues, as expected, suggesting that
respondents in those three classes behave rationally from an economic perspective,
that is, consistent with constrained utility maximization.
Regarding class 4, the results suggest that the respondents in this class do not
relate the bid to the economic value of the good as ln(Bid) was found not signi…cant,
and yet they may value the good. In a di¤erent context, a class with similar
charac-teristics was found in Herriges, Kling, Liu and Tobias [19], labelled “inconsequential
group” (“if respondents do not believe the result of the survey might potentially
in‡uence an outcome they care about”), where the “Yes” response rate does not
decrease with the bid values.13
In the case of justi…cation bias related to protest reasons we observe that while
in the case of institutions, two questions out of four are signi…cant in class 3, and
three out of four in class 4, none is signi…cant in classes 1 and 2. Therefore, this
suggests that in class 3 respondents have used institutions as an argument to justify
their answer to the CV question. In contrast, in what concerns fairness issues, one
question out of three is signi…cant in all classes. Interestingly enough, fairness issues
are present across all classes, suggesting that for the sampled population this is a
13As mentioned before, a type of protest responses are invalid highs, which in the context of
rather sensitive issue.
From the last part of Table 1.9, and, in what concerns the questions related to
institutions, we may conclude that among those who “Pay” the majority of
respon-dents is indi¤erent in class 1, agrees in class 2, as well as in class 3, and is mostly
indi¤erent in class 4. For those who did not Pay, while in class 1 a large number
of indi¤erents is also observed, in class 2 respondents basically agree, and in class 3
the majority strongly agrees. In class 4 agreement is observed. So, more clear
state-ments are observed as we move from class 1 to class 3. In class 3 we also observe
that despite they value the good and state that preservation is their problem, the
majority of respondents strongly agrees that money will be used for other purposes,
that the payment will not insure the preservation of the landscape and that they
already pay enough taxes for it. In contrast, in class 1 they are indi¤erent with
respect to the statement that the payment will not insure the preservation of the
landscape, and agree that they already pay enough taxes for this preservation.
Ac-cording to these results, we may classify class 1 respondents as low protestors, class
2 respondents as medium protestors and class 3 respondents as high protestors.
With respect to fairness, we …nd a similar pattern to the above one for those
who pay, despite that we observe a smaller number of indi¤erents, and in class 3
respondents state more strongly their agreement. For those that do not pay, we
observe that there are no respondents stating indi¤erence. Hence, in classes 1 and
2 most of the respondents agree, while in class 3 strongly agree. In class 4, those
that pay present a very disperse pattern while the majority that does not pay agrees.
Thus, in classes 1, 2, and 3, we …nd that respondents that do not pay have in general
a clearer position with respect to fairness issues, when compared to protest reasons
concerning institutions. For instance, indi¤erence is not present. As mentioned
above, fairness is a rather sensitive issue for all the respondents.
When comparing Model 1 to 1J, we observe that class 1 in both models represents
classes 1 and 2 the estimated conditional probabilities in Model 1 are in between
those in Model 1J for “Not Pay” and “Pay”. Also, the pattern found in class
4 in Model 1 matches that found in class 4 for “Pay” in Model 1J, and class 3
in Model 1 matches class 3 for “Not Pay” in Model 1J. This is the result of the
rearrangement of respondents among classes, when taking account justi…cation bias,
as some respondents that were not willing to pay moved into class 4, while some
others that were willing to pay moved into class 3 in Model 1J. Ultimately, the
number of respondents in classes 2 and 4 have increased, and decreased in the
others.
For policy purposes, we may use the estimated median WTP for class 1 in the
model with justi…cation bias (48.1 euros) as an estimate of the true economic value,
as the results suggest that individuals in this class behave rationally and are mostly
indi¤erent with respect to the majority of the attitudinal questions related to the
di¤erent protest reasons. This estimated value is substantially higher than those
obtained for the other classes (6.53 euros in class 2, and 10.3 euros in class 3),
as well as the estimated value from the standard logit model (approximately 12.8
euros).14 Mostly important, we observe that by accounting for the justi…cation bias
the obtained median WTP estimates are also di¤erent. In particular, median WTP
for class 1 in Model 1 is 12 euros lower than that obtained for the same class in Model
1J. Notice also that this di¤erence in WTP is signi…cant, since the corresponding
con…dence intervals do not overlap. Therefore, the relevance of behavioral aspects,
as captured by justi…cation bias, should not be ignored.
1.6. Conclusion
In this article, we develop a latent class model for estimating WTP for public goods
using simultaneously CV and attitudinal data capturing attitudes related to di¤erent
14This corresponds to the estimation of equation (1.4) in Section 1.2 when including gender,
elements in the survey setup, such as budget constraint issues, protesting related to
the lack of trust in public institutions or fairness issues. Moreover, we allow for the
possibility of a justi…cation bias, that is, the potential impact of the response to the
CV question on the answers to the attitudinal questions. In fact, justi…cation bias
allows for a better characterization of the pattern of responses within each class,
compared to the case without justi…cation bias, by distinguishing those that pay
from those that do not pay.
Based on a CV study conducted in The Alto Douro Wine Region, located in the
north of Portugal, four classes of respondents are identi…ed. We show that in our
case omitting this justi…cation bias would underestimate the true economic value
for preserving the good as measured by the value of the estimated median WTP in
class 1, that is, the one in which most respondents indicate indi¤erence with respect
to protest attitudes. Therefore, for policy purposes, psychological factors should not
be disregarded in CV estimation.
Our methodology is ‡exible enough, and can be applied to other contexts
in-volving di¤erent behavioral aspects or attitudes. Moreover, it can be extended to
other stated preference elicitation formats, such as double-bounded CV and choice
References
[1] Au, D., T. F. Crossley, and M. Schellhorn, “The E¤ect of Health Changes and
Long-term Health on the Work Activity of Older Canadians”,Health Economics
10, 999-1018, 2005.
[2] Bound, J., “Self-Reported Versus Objective Measures of Health in Retirement
Models”, Journal of Human Resources 26, 106-138, 1991.
[3] Bateman, I., R. Carson, B. Day, M. Hanemann, N. Hanley, T. Hett, M. Jones-Lee, G. Loomes, S. Mourato, E. Ozdemiroglu, D. Pearce, R. Sugden, and J. Swanson, Economic Valuation with Stated-Preference Techniques: A Manual, Edward Elgar, 2002.
[4] Ben-Akiva, M., J. Walker, A. Bernardino, D. Gopinath, T. Morikawa, and A. Polydoropoulou, “Integration of Choice and Latent Variable Models”, in (H. Mahmassani, Ed.) In Perpetual Motion: Travel Behaviour Research Opportu-nities and Application Challenges, Elsevier Science, 431-470, 2002.
[5] Bestard, A., A. Riera Font, and R. Hicks, “Combining Discrete and Continu-ous Representations of Preference Heterogeneity: A Latent-Class Approach”,
Environmental & Resource Economics 47(4), 477–93, 2010.
[6] Bollen, K. A., “Structural Equations with Latent Variables”, Wiley 1989.
[7] Bonnichsen, O., and J. Ladenburg, “Using an Ex-ante Entreatry to Reduce Protest Zero bias in Stated Preference Surveys: A Health Economic Case”,
Journal of Choice Modelling 2(2), 83-98, 2009.
[8] Bonnichsen, O., and J. Ladenburg, “Reducing Status-Quo Bias in Choice Ex-periments: An Application to a Protest Reduction Entreatry”, FOI Working Paper, No. 7, Institute of Food and Resource Economics, LIFE, University of Copenhagen, 2010.
[9] Bre-e, W., E. Morey, and J. Thacher, “A Joint Latent Class Model: Combin-ing Likert-scale Preference Statements with Choice Data to Harvest Preference
Heterogeneity”,Environmental & Resource Economics 50, 83-110, 2011.
[10] Brouwer, R., and J. Martin-Ortega, “Modeling Self-Censoring of Polluter Pays Protest Votes in Stated Preference Research to Support Resource Damage
Es-timations in Environmental Liability ”,Resource & Energy Economics, 34(1),
151-166, 2012.
[11] Calia, P., and E. Strazzera, “A Sample Selection Model for Protest Votes in
Contingent Valuation Studies”, Statistica 61(3), 473-485, 2001.
[12] Cameron, A., and P. Trivedi, “Microeconometrics: Methods and Applications”, Cambridge University Press, 2005.
[13] Carson, R., T. Groves, “Incentive and Informational Properties of Preference
[14] Carson, R., R. Mitchell, M. Hanemann, R. Kopp, S. Presser, and P. Ruud, “Contingent Valuation and Lost Passive Use: Damages from the Exxon Valdez
Oil Spill”, Environmental & Resource Economics 25, 257-86, 2003.
[15] Dempster, A. P. , N. M. Laird, and D. B. Rubin, “Maximum Likelihood from
Incomplete Data via the EM Algorithm”, Journal of the Royal Statistical
So-ciety, Series B,39, 1-38, 1977.
[16] Dziegielewska, D., and R. Mendelsohn, “Does “No” Means “No”? A Protest
Methodology”,Environmental & Resource Economics 38, 71-87, 2007.
[17] Gradstein, M., “Institutional Traps and Economic Growth”,International
Eco-nomic Review 49, 1043-1066, 2008.
[18] Haab, T., and K. McConnell, “Valuing Environmental and Natural Resources”, Edward Elgar, UK, 2002.
[19] Herriges, J., C. Kling, C.-C.-C. Liu, and J. Tobias, “What are the Consequences
of Consequentiality?”, Journal of Environmental Economics and Management
59(1), 67-81, 2010.
[20] Jakobsson, K., and A. Dragun, “The Worth of a Possum: Valuing Species with
the Contingent Valuation Method”,Environmental &Resource Economics 19,
211-227, 2001.
[21] Jorgensen, B., G. Syme, B. Bishop, and B. Nancarrow, “Protest Responses in
Contingent Valuation”,Environmental & Resource Economics 14(1), 131-150,
1999.
[22] Jorgensen, B., and G. Syme, “Protest Responses and Willingness to Pay:
At-titude Toward Paying for Storm Water Pollution Abatement”, Ecological
Eco-nomics 33(2), 251-265, 2000.
[23] Kaufmann, D., A. Kraay, and M. Mastruzzi, “Governance Matters IV: Gov-ernance responses to the attitudinal questions for 1996-2004”, mimeo, World Bank, Washington DC, 2005.
[24] Lo, Y., N.R. Mendell, and D.B. Rubin, “Testing the Number of Components
in a Normal Mixture”, Biometrika 88, 767-778, 2001.
[25] Martin-López, B., C. Montes, and J. Benayas,“In‡uence of User Characteristics on Valuation of Ecosystem Services in Donana Natural Protected Area
(south-west Spain)”,Environmental Conservation 34(3), 215-24, 2007.
[26] McLachlan, G. J., and D. Peel, “Finite Mixture Models”, Wiley, New York, 2000.
[27] Meyerho¤, J., and U. Liebe, “Protest Responses in Contingent Valuation:
[28] Morrison, M., R. Blamey, and J. Bennett, “Minimizing payment Vehicle Bias
in Contingent Valuation Studies”, Environmental & Resource Economics 16,
407-422, 2000.
[29] Meyerho¤, J., A. Bartczak, and U. Liebe, “Identifying Various Types of Protesters in Contingent Valuation Using Latent Class Analysis”, Working Pa-per on Management in Environmental Planning 27/200, 2009.
[30] Meyerho¤, J., and U. Liebe, “Do Protest Responses to a Contingent
Valua-tion QuesValua-tion and a Choice Experiment Di¤er?”, Environmental & Resource
Economics 39, 433-446, 2008.
[31] Meyerho¤, J., and U. Liebe, “Status-Quo E¤ects in Choice Experiments:
Em-pirical Evidence on Attitudes and Choice Task Complexity?”,Land Economics
85(3), 515-528, 2009.
[32] Meyerho¤, J., and U. Liebe,“Determinants of Protest Responses in
Environ-mental Valuation: A Meta-Study”, Ecological Economics 70, 366-74, 2010.
[33] Mitchell, R.C., and R. T. Carson, “Using Surveys to Value Public Goods: The Contingent Valuation Method”, Resources for the Future, Washington, DC, 1989.
[34] Morey, E., J. Thacher, and W. Bre-e, “Using Angler Characteristics and At-titudinal Data to Identify Environmental Preference Classes: A Latent-Class
Model”,Environmental & Resource Economics 34:91-115, 2006.
[35] Morey, E., M. Thiene, M. De Salvo, G. Signorello, “Using Attitudinal Data to Identify Latent Classes that Vary in their Preference for Landscape
Preserva-tion”,Ecological Economics 68:536-46, 2008.
[36] Morkbak, M. R., S. Olsen, and J. Meyerho¤,“A Meta-Study Investigating the Sources of Protest Behavior in Stated Preference Surveys”, paper presented at the 4th World Congress of Environmental and Resource Economists, Montreal, Canada, 2010.
[37] Polydoropoulou, A., D. Gopinath, and M. Ben-Akiva, “Willingness to Pay for
Advanced Traveler Information System”,Transportation Research Record1588,
1997.
[38] Provencher, B., K. Baerenklau, and R. Bishop, “ A Finite Mixture Logit Model
of Recreational Angling with Serially Correlated Random Utility”, American
Journal of Agricultural Economics 844, 1066-1075, 2002.
[39] Scarpa, R., M. Thiene, “Destination Choice Models for Rock Climbing in the North-East Alpes: A Latent Class Approach Based on a Intensity of
Participa-tion”,Land Economics 81(3), 426-44, 2005.
[40] Scarpa, R., N. Beharry-Borg, “Valuing Quality Changes in Caribbean Coastal
Waters for Heterogeneous Beach Visitors”, Ecological Economics 69, 1124-39,
[41] Scarpa, R., T. J. Gilbride, D. Campbell and D. A. Hensher, “Modelling At-tribute Non-Attendance in Choice Experiments for Rural Landscape
Valua-tion”,European Review of Agricultural Economics 36(2), 2009.
[42] Soderqvist, T, “Why Give Up Money for the Baltic Sea?, Environmental &
Resource Economics 12, 249-54, 1998.
[43] Strazzera, E., M. Genius, R. Scarpa, and G. Hutchinson, “The E¤ect of Protest
Votes on the Estimates of WTP for Use Values of Recreational Sites”,
Envi-ronmental & Resource Economics 25, 461-476, 2003.
[44] Walker, J., and J. Li, “Latent Lifestyle Preferences and Household Location
Decisions”,Journal of Geographical Systems 9(1), 77-101, 2007.
[45] Whitehead, J., P. Groothuis, and G. Blomquist, “Testing for Non-Response and
Sample Selection Bias in Contingent Valuation”,Economic Letters 41, 215-220,
1.A. Appendix
1.A.1. Attitudinal Questions
- Budget Constraint Issues (B1–B4): B1. The values are too high
B2. I can’t a¤ord to pay anything right now B3. The landscape preservation is not my problem
B4. I would rather pay more important things
- Institutions (I1–I4):
I1. The landscape should be preserved with the current taxes I2. I think money will be used for other purposes
I3. This payment will not insure the preservation of the landscape I4. I already pay enough taxes for this preservation
- Fairness Issues (F1–F3):
F1. The residents of the region should pay for this preservation
F2. The local authorities and tourist operators should pay for this preservation F3. It is not fair to ask me to pay
1.A.2. Tables
Table 1.1: Descriptive Statistics
Variable Mean SD Min Max Description
CV answer 0.32 0.47 0 1 Answer to the CV question (1=Pay, 0=Not Pay) Bid 46.7 29.7 10 100 Bid for the CV question in Euros
Age 45.3 13.7 18 85 The age of the respondent
Emp 0.78 0.41 0 1 Employment Condition (1=Employed, 0=otherwise) Visit 0.59 0.49 0 1 (1=If respondent has visited this place before, 0=otherwise) Gender 0.47 0.25 0 1 (1=If respondent is a female, 0= respondent is a male)
Table 1.2: Distribution of Answers to the Attitudinal Questions (%)
1 2 3 4
B1a 27.2 17.6 37.1 18.1
B2b 8.9 32.6 32.2 26.3
B3b 25.8 54.4 7.1 12.7
B4a 27.9 32 32.7 7.4
I1a 4.2 7.1 60.9 27.8
I2a 11.9 28.9 41.5 17.7
I3a 13 31.6 38.2 17.1
I4a 6.1 12.3 54.4 27.2
F1b 21.1 50.8 13.7 14.3
F2a 18.4 13.7 48.6 19.3
F3a 16.9 15.6 52.1 15.4
Attitudinal Questions
Adjusted Scale
Notes:
Table 1.3: Model Selection Criteria for Model without Justi…cation Bias
2 classes 3 classes 4 classes 5 classes
LL ‐9239 ‐8939 ‐8786 ‐8734
AIC 18628 18107 17865 17820
BIC 18970 18627 18531 18623
ABIC 18732 18265 18067 18064
AIC3 18703 18220 18010 17996
AICC 18646 18151 17941 17938
CAIC 18767 18317 18134 18145
# of parameters 75 114 146 176
Number of Classes Criteria
Table 1.4: Model Selection Criteria for Model with Justi…cation Bias
2 classes 3 classes 4 classes 5 classes
LL ‐9023 ‐8840 ‐8653 ‐8605
AIC 18240 17968 17679 17705
BIC 18682 18625 18527 18831
ABIC 18347 18168 17936 18047
AIC3 18337 18112 17864 17951
AICC 18271 18042 17813 17972
CAIC 18419 18234 18022 18161
# of parameters 97 144 186 247
Table 1.5: Estimation Results
Class 1 Class 2 Class 3 Class 4 Class 1 Class 2 Class 3 Class 4 CV Equation (1.4)
constant 1.285 (0.14) 0.283 (0.81) 1.711 (0.19) 2.557 (0.04) 1.395 (0.17) 1.073 (0.33) 2.980 (0.02) 0.663 (0.52) visit 1.029 (0.01) ‐0.323 (0.54) 1.011 (0.20) ‐0.364 (0.45) 1.275 (0.01) 0.214 (0.71) 0.391 (0.61) ‐0.264 (0.61) ln(Bid) ‐0.501 (0.03) ‐0.544 (0.08) ‐1.366 (0.00) ‐0.452 (0.14) ‐0.505 (0.07) ‐0.655 (0.02) ‐1.382 (0.01) ‐0.287 (0.31) Membership Equation (1.7)
constant 1.333 (0.01) 0.042 (0.93) 0.655 (0.18) ‐ 0.716 (0.13) ‐0.772 (0.23) ‐0.712 (0.24) ‐ visit ‐0.121 (0.75) 0.413 (0.22) 0.094 (0.76) ‐ ‐0.330 (0.286) 0.884 (0.02) 0.345 (0.31) ‐ gender ‐0.806 (0.02) 0.046 (0.86) ‐0.399 (0.19) ‐ ‐0.642 (0.03) 0.272 (0.31) 0.103 (0.72) ‐ Estimated Ψc in Equation (1.6)
“Justification Bias”
B1 ‐2.373 (0.00) ‐1.451 (0.01) ‐1.620 (0.01) ‐0.762 (0.11)
B2 ‐1.807 (0.06) ‐0.069 (0.91) ‐1.678 (0.00) 0.094 (0.81)
B3 ‐1.229 (0.01) ‐0.654 (0.19) ‐1.489 (0.00) 0.355 (0.44)
B4 ‐8.448 (0.01) 0.009 (0.99) ‐2.123 (0.00) ‐0.865 (0.03)
I1 ‐0.393 (0.43) ‐0.081 (0.82) ‐0.749 (0.30) ‐0.490 (0.22)
I2 ‐0.475 (0.48) ‐0.194 (0.77) ‐1.106 (0.04) ‐1.34 (0.00)
I3 ‐0.354 (0.51) ‐0.801 (0.115) ‐1.998 (0.01) ‐1.608 (0.00)
I4 0.267 (0.60) ‐0.934 (0.152) ‐0.549 (0.55) ‐2.273 (0.00)
F1 0.257 (0.54) 0.229 (0.63) ‐0.622 (0.27) 0.091 (0.83)
F2 ‐0.084 (0.84) ‐0.359 (0.44) 0.935 (0.04) ‐0.126 (0.766)
F3 1.199 (0.05) ‐2.135 (0.00) ‐1.406 (0.11) ‐2.929 (0.00)
Median(WTP) / S.E. 36.30 / 1.44 1.14 / 0.10 5.38 / 0.25 182 / 31.92 48.10 / 1.55 6.53 / 0.33 10.30 / 0.28 6.36 / 0.55 Confidence Interval of Median (WTP) [35.77 , 41.43] [0.93 , 1.34] [4.89 , 5.86] [119.82 , 244.94] [45.90 , 52.00] [5.89 , 7.18] [9.70 , 10.80] [5.26 , 7.43]
Number of observation per Class 173 211 182 140 142 236 137 191
Probability 0.24 0.3 0.26 0.2 0.2 0.33 0.2 0.27
Entropy
Number of parameters Number of observations
0.83 146 186 706 706 0.84 ‐ ‐ ‐ ‐ ‐ ‐
Model 1 Model 1 J
LCM without Justification Bias LCM with Justification Bias
‐
‐ ‐ ‐
Notes:
In parentheses are p-values WTP is in Euros
Table 1.6: Estimated Conditional Probabilities of Answers to the Attitudinal Ques-tions in Model 1 (%)
1 2 3 4 1 2 3 4 1 2 3 4 1 2 3 4
B1a 18 43 34 4 11 13 61 15 37 5 20 39 48 11 28 14
B2b 0 13 74 13 0 21 23 56 25 48 8 19 12 52 28 8
B3b 26 66 8 0 3 57 15 25 37 44 2 17 45 50 1 4
B4a 20 59 21 0 11 25 60 5 41 11 26 22 46 39 15 1
I1a 3 14 79 3 7 3 78 12 3 0 23 74 4 14 62 21
I2a 10 68 22 0 7 15 69 9 4 11 33 51 31 26 35 8
I3a 11 72 17 0 11 19 65 5 3 9 31 58 31 33 32 4
I4a 1 21 74 4 1 4 82 13 1 2 18 79 25 27 38 10
F1b 3 62 29 6 2 53 15 31 48 39 5 8 35 51 6 8
F2a 12 20 65 2 15 15 63 7 23 4 24 48 25 16 39 20
F3a 5 34 61 0 9 5 75 10 2 3 48 47 59 25 14 2
Class 4 Attitudinal
Questions
Class 1 Class 2 Class 3
Notes:
a. Levels 1 and 2 in a Likert scale are measured in a level 1 in the table b. Levels 4 and 5 in a Likert scale are measured in a level 4 in the table
Table 1.7: Estimated Conditional Probabilities of Answers to the Attitudinal
Ques-tions in Model 1J, Not Pay (%)
1 2 3 4 1 2 3 4 1 2 3 4 1 2 3 4
B1a 3 31 54 11 12 11 65 13 31 3 22 44 32 13 27 27
B2b 0 3 81 16 0 22 20 58 18 51 4 27 15 51 31 4
B3b 14 74 12 0 3 54 15 27 25 47 3 26 51 47 1 1
B4a 0 56 44 0 17 24 56 3 37 9 29 26 31 36 23 10
I1a 2 14 80 3 7 4 79 11 0 0 11 89 4 7 60 29
I2a 7 70 23 0 8 17 66 8 3 7 29 60 15 22 42 22
I3a 9 69 23 0 10 21 63 5 1 2 20 77 12 30 45 13
I4a 1 23 74 2 2 5 78 15 0 0 6 94 6 14 56 24
F1b 4 65 27 4 1 54 17 28 49 39 5 8 38 50 5 7
F2a 13 19 67 2 15 16 63 6 27 4 21 48 20 12 41 27
F3a 7 45 48 0 6 7 76 11 4 2 41 53 13 20 48 19
Class 1 Class 2 Class 3 Class 4
Attitudinal Questions
Notes:
Table 1.8: Estimated Conditional Probabilities of Answers to the Attitudinal Ques-tions in Model 1J, Pay (%)
1 2 3 4 1 2 3 4 1 2 3 4 1 2 3 4
B1a 28 57 14 1 36 19 42 3 69 3 15 14 51 14 21 15
B2b 0 16 81 3 0 23 21 56 55 38 1 6 14 50 32 4
B3b 37 60 4 0 6 66 11 16 60 32 1 7 41 56 2 2
B4a 24 76 0 0 17 24 56 3 83 5 9 4 49 32 14 5
I1a 4 19 75 2 7 4 78 10 0 0 21 79 6 11 63 20
I2a 11 74 15 0 10 20 64 7 8 18 41 34 39 30 24 7
I3a 12 71 17 0 20 31 47 2 5 13 51 32 34 39 23 4
I4a 1 18 78 3 4 12 77 6 0 0 11 89 30 33 32 4
F1b 3 60 31 6 1 48 18 33 64 29 3 4 38 49 5 8
F2a 14 20 65 1 20 19 57 4 13 3 15 70 17 11 41 31
F3a 2 22 76 0 35 21 42 1 14 5 59 22 63 22 13 2
Class 4 Attitudinal
Questions
Class 1 Class 2 Class 3
Notes:
a. Levels 1 and 2 in a Likert scale are measured in a level 1 in the table b. Levels 4 and 5 in a Likert scale are measured in a level 4 in the table
Table 1.9: Summary of Estimation Results for Model 1J
Classes 1 2 3 4
Rational Behavior:
‐ Ln(Bid)‐significant Yes Yes Yes No
‐ # of significant estimated Ψ´s related
to budget constraint issues (B1‐B4) 4 1 (B1) 4 1 (B4)
# of significant estimated Ψ´s related to :
‐ Institutions (I1‐I4) 0 0 2 (I2, I3) 3 (I2, I3, I4)
‐ Fairness (F1‐F3) 1 (F3) 1 (F3) 1 (F2) 1 (F3)
Mode:
‐ Budget Constraint (B1‐B4):
‐ Pay Indifferent Agree Strongly Disagree Indifferent &
Strongly Agree
‐ Not‐Pay Agree & Indifferent Agree & Strongly
Agree
Disagree & Strongly
Disagree Strongly Disagree ‐ Institutions (I1‐I4):
‐ Pay Indifferent Agree Agree Indifferent
‐ Not‐Pay Indifferent Agree Strongly Agree Agree
‐ Fairness (F1‐F3)
‐ Pay Agree Agree Strongly Agree Agree+
‐ Not‐Pay Agree* Agree* Strongly Agree* Agree*
Notes:
1.A.3. Figures
Figure 1.1:Traditional Landscape of Alto Douto
Figure 1.2:The New Vineyards
Figure 1.3:General Representation of the Joint CV and Latent Class Models
Explanatory
variables Latent Class
Attitudinal Question 1
Attitudinal Question 2
Attitudinal Question N
• •
WTP
CV Answer (Pay/Not Pay)
Justification Bias Disturbance
Disturbance
Bid
Disturbance
Disturbance
• •
Chapter 2
Protest Attitudes and Stated Preferences: Evidence
on Scale Usage Heterogeneity
coauthored with M. A. Cunha-e-Sá, and L. C. Nunes
Abstract
We contribute to the stated preference literature by addressing scale usage
het-erogeneity regarding how individuals answer attitudinal questions capturing lack of
trust in institutions and fairness issues. Using a latent class model, we conduct a
contingent valuation study to elicit the willingness-to-pay to preserve a recreational
site. We …nd evidence that respondents within the same class, that is, with
simi-lar preferences and attitudes, interpret the Likert scale di¤erently when answering
the attitudinal questions. We identify di¤erent patterns of scale usage heterogeneity
within and across classes and associate them with individual characteristics. Our
ap-proach contributes to a better understanding of individual behavior in the presence
of protest attitudes.
Keywords: Scale usage heterogeneity; Likert scale; protest attitudes; contingent
valuation; latent class model.
2.1. Introduction
Survey based techniques, such as Contingent Valuation (CV) and Choice Modelling,
have been widely used in many research …elds, namely, economics, sociology, and
political science, to elicit the willingness-to-pay (WTP) for non-market goods. These
techniques rely on the neoclassical theory of preferences assuming that individuals
behave rationally. However, elicited preferences are also a¤ected by other individual
factors.1 Di¤erent individuals may have di¤erent WTPs, not only because they di¤er
in terms of preferences, but also in their beliefs or attitudes. A typical situation is
when respondents state zero values to open-ended questions or refuse to accept
any CV bids, even though they may value the good in question.2 This behavior
is frequently attributed to protest attitudes associated with the lack of trust in
institutions, fairness issues, strategic acting, or respondents’ disagreement with some
part of the survey.3 As a result, the elicited WTP obtained from the use of standard
SP techniques may not represent the “true” one if protest attitudes are ignored.
Latent Class Models (LCM) have been used in the literature to identify distinct
groups of people with di¤erent preferences, beliefs, or attitudes, where the individual
class membership is unknown or latent. In this context, recent valuation studies
include a set of follow-up questions in their surveys, representing an important source
of additional information regarding individual attitudes. In general, attitudinal
questions involve a discrete rating scale, such as the Likert scale. In particular, the
5-point Likert scale (from “strongly disagree” to “strongly agree”) is often used.
However, even individuals with similar preferences and attitudes may interpret and
use the same scale ratings (categories) di¤erently. For instance, some people answer
only in the middle of the scale, while others may use the lower or upper end on the
1For instance, Brown and Taylor [8] discuss gender di¤erences regarding hypothetical bias.
Another example is Botzen and van der Bergh [6] on individual risk attitudes related to climate change. For a general discussion see Batemanet al.[2]:
2See Carson and Groves [10], Mitchell and Carson [19], among others.
3See Mitchell and Carson [19], Blamey [5], Meyerho¤ and Liebe [17] and [18], Polomé [20],
Likert scale. This phenomenon is known as scale usage heterogeneity and has been
discussed in the context of consumer behavior literature by Rossi et al. [22], Wong
et al. [23], and Jong et al. [15], among others.
This paper contributes to the CV literature by addressing scale use heterogeneity
in the context of latent class analysis. We identify the factors that may explain
why respondents use the scale di¤erently, namely, by associating their answers with
socioeconomic and preference variables.
The results are discussed in the context of a CV study regarding the preservation
of a recreation site in the north of Portugal. After the standard CV question in
the questionnaire, a set of attitudinal questions related to the budget issues and
protest attitudes associated with the lack of trust in institutions and fairness issues
is included.
The estimation results suggest three classes that di¤er with respect to the
de-gree of protest attitudes as well as to the willingness-to-pay. We …nd evidence of the
presence of scale usage heterogeneity, varying across classes, which is not related to
WTP. Scale usage heterogeneity can also be associated with individual
characteris-tics. For instance, respondents that visited the site more than once and belong to
the classes that value the good use the upper end of the scale when answering the
institutional attitudinal questions. Therefore, independently of being protestors or
not, those that have visited the site more than once are more concerned with its
preservation, and, hence, with the quality of the institutions that are responsible
for it. Besides, among those that have higher protest attitudes, respondents that
are employed and have visited the site more than once state the higher value when
responding to institutional questions. Hence, these respondents are more critical
with respect to the quality of institutions, suggesting that misuse of …scal revenue
is an especially sensitive issue for employed individuals. Finally, we …nd evidence
answer attitudinal questions.4
The remainder of the paper is organized as follows. The next section presents the
theoretical methodology. Section 2.3 describes the data. Then, Section 2.4 presents
and discusses the estimation results, while Section 2.5 concludes the paper. Tables
and Figures are presented in the Appendix.
2.2. The Model
In this section, we describe the proposed statistical methodology to estimate the
underlying WTP for non-market-goods when using CV and attitudinal data. Our
model is based on the LCM as described in McLachlan and Peel [16]. Individuals
are assumed to belong to one of several classes that di¤er in terms of the underlying
WTP as well as unobserved behavioral, psychological, or attitudinal aspects. Even
though individual class membership is not directly observed by the researcher, it
can be inferred from the responses to the attitudinal and CV questions.
An important feature of our model is that it takes into account possible
indi-vidual scale usage heterogeneity in the responses to the attitudinal questions. This
unobservable heterogeneity is captured by a latent variable, designated as
subjec-tive scaling variable.5 As shown below, our model also allows to test for testing
heterogeneity associated or not with the underlying WTP.
The general representation of the model is illustrated in Figure 2.1. Rectangles
represent observed variables and ellipses represent unobserved variables, such as
WTP, latent class, and subjective scaling. This approach is similar to that of
Ben-Akivaet al. [3], Provencheret al. [21], Cunha-e-Sáet al. [11]. The only di¤erence is
that in this model we introduce the subjective scaling variable a¤ecting the responses
to the CV and the attitudinal questions. The solid lines represent the CV model,
4This bias is widely discussed in di¤erent economic …elds, such as health, labor, transportation,
and environment. See Auet al. [1], Bound [7], Ben-Akivaet al. [3], Cunha-e-Sáet al.[11], among others.