1
Effects of Product Characteristics and Brand Strength
on Brand Engagement in Instagram
Maria de Azevedo da Cunha Carpinteiro Albino
Dissertation written under the supervision of Professora Ana Isabel de Almeida Costa
Dissertation submitted in partial fulfilment of requirements for the MSc in Management with a Specialisation in Strategic Marketing, at Católica Lisbon School of Business and Economics
2 ABSTRACT
Title of the dissertation: Effects of Product Characteristics and Brand Strength on Brand Engagement in Instagram
Author: Maria de Azevedo da Cunha Carpinteiro Albino
Brands should focus their attention to SNS, allocating efforts into achieving a relevant and SMM strategy. After all, only relevant and targeted content will obtain relevant engagement from its consumers on SNS.
This dissertation aims to study the impact different types of product involvement (high and low involvement products) and brand strength might have on the levels of consumers engagement with a brand on SNS, namely Instagram. To this end, this study is divided into descriptive and explanatory research methods.
Results of the study show that product involvement does not have an impact on consumer engagement with branded content posts. However, product involvement has a significant impact on the willingness to follow a brand. The level of consumer engagement with branded content was found to be influenced by brand appeal and brand identity. Results show that brand strength has an impact on consumer engagement, since stronger brands typically display lower levels of consumer engagement. In conclusion, these findings are relevant for managers and marketers in allocating budget on social media marketing and in optimizing the levels of consumer engagement for their branded content posts on Instagram.
Keywords: Social Media Marketing; Social Networking Site; Product Involvement; Brand Strength; Brand Appeal; Brand Identity; Instagram.
3 SUMÁRIO
Titlo da Dissertação: Efeitos das Características dos Produtos e a Força das Marcas no Envolvimento dos Consumidores com as Publicações Feitas Pelas Marcas no Instagram.
Autor: Maria de Azevedo da Cunha Carpinteiro Albino
As marcas devem concentrar a atenção nas redes sociais, alocando esforços para alcançar uma estratégia de marketing relevante nas redes sociais. Afinal, apenas conteúdo relevante e direcionado obterá o envolvimento relevante dos consumidores nas redes sociais.
Esta dissertação visa estudar o impacto que diferentes tipos de envolvimento do produto (produtos de alto e baixo envolvimento) e a força da marca podem ter nos níveis de envolvimento dos consumidores com uma marca nas redes sociais, nomeadamente o Instagram. Para este fim, este estudo é dividido em métodos de pesquisa descritiva e explicativa.
Os resultados do estudo mostram que o envolvimento do produto não tem impacto no envolvimento do consumidor com as publicações da marca. Contudo, o envolvimento do produto tem um impacto significativo na vontade de seguir uma marca. O nível de envolvimento do consumidor com o conteúdo publicado pela marca é influenciado pelo apelo da marca e pela identidade da marca. Os resultados mostram que a força da marca tem um impacto no envolvimento do consumidor, uma vez que marcas mais fortes geralmente apresentam níveis mais baixos de engajamento do consumidor. Em conclusão, essas descobertas são relevantes para gerentes e gestores de marketing na alocação do orçamento no marketing de redes sociais e na otimização dos níveis de participação do consumidor com as publicações feitas pelas marcas, no Instagram.
Palavras-Chave: Redes Sociais; Marketing das Redes Sociais; Envolvimento do Produto; Força da Marca; Apelo da marca; Identidade da marca; Instagram
1 ACKNOWLEDGEMENTS
The conclusion of my thesis makes me feel quite sad for this studying chapter of my life to be over. I always enjoyed going to school and to get educated. I also feel proud since I never thought I would be able to conclude this thesis. By concluding this thesis, I can take that all challenges in life are possible to overcome if one puts their heart and soul into it.
First, I would like to thank my supervisor, Professor Ana Isabel Costa, who was extremely helpful and crucial to the conclusion of this thesis during the past four months. From the discussion of potential topics, to the realisation of the statistical analysis and to the final revision and feedback. Furthermore, I would like to thank my parents for allowing me to pursue my studies, without questioning my choices. I would also like to thank my grandparents, my best-friend, my friends and my boyfriend for all their support and for putting up with me in these stressful four months.
2 TABLE OF CONTENTS TABLE OF FIGURES ... 4 TABLE OF TABLES ... 5 TABLE OF ANNEXES ... 6 CHAPTER 1: INTRODUCTION ... 8
1.1 Background and problem statement ... 8
1.2 Aim and Scope ... 9
1.3 Research Methods ... 11
1.4 Relevance ... 11
1.5 Dissertation Outline... 13
CHAPTER 2: LITERATURE REVIEW AND RESEARCH HYPOTHESES ... 14
2.1 Branding in Social Networked Media ... 14
2.2 Branded Content and Consumer Engagement ... 14
2.3 Effects of Product Involvement on Consumer Engagement ... 16
2.4 Effects of Brand Strength on Consumer Engagement ... 17
2.5 Effects of Brand Identity on Consumer Engagement... 18
2.6 Conclusion and Derived Hypothesis ... 19
CHAPTER 3: METHODOLOGY ... 21
3.1. Research Approach ... 21
3.2 Research Methods ... 21
3.3 Secondary Data ... 22
3.3.1 Study Design ... 22
3.3.2 Population and Sample ... 22
3.3.3 Data Collection and Analysis ... 22
3
3.4 Primary Data ... 26
3.4.1 Study Design ... 26
3.4.2 Population and Sample ... 27
3.4.3 Data Collection and Analysis ... 28
3.4.3.1 Bivariate Correlation ... 28
3.4.3.2 Independence T-Tests ... 29
3.4.3.3 Factor Analysis ... 30
CHAPTER 4: RESULTS & DISCUSSION ... 31
4.1 Secondary Data ... 31
4.1.1 Engagement Rate ... 31
4.2 Primary Data ... 32
4.2.1 Paired Samples T-Test ... 32
4.2.2 Bivariate Correlation ... 33
4.2.3 Linear Regression ... 34
4.3 Discussion of the Results ... 36
CHAPTER 5: CONCLUSIONS AND LIMITATIONS ... 39
5.1. Conclusions ... 39
5.2. Limitations and Further Research ... 40
REFERENCES ... 42
4 TABLE OF FIGURES
5 TABLE OF TABLES
Table 1: Metrics of Consumer Engagement with each Brand Post ... 23
Table 2: Descriptive Statistics of the Consumer Engagement Metrics for each Brand Post ... 24
Table 3: Socio-Demographic Characteristics of the Survey Respondents (n=134) ... 27
Table 4: Frequency Descriptives of Which Brands Respondents had Bought Previously ... 33
Table 5: Coefficients of the Regression Models for Product Involvement and Brand Identification ... 35
Table 6: Coefficients of the Regression Models for Product Involvement, Brand Identification and Brand Appeal ... 36
6 TABLE OF ANNEXES
Annex 1: Primary Data Collection (Survey) in English ... 50
Annex 2: Bivariate Correlation of 3 Dependent Variables with Instagram Usage and Brands Followed ... 55
Annex 3: Bivariate Correlation of 3 Dependent Variables with Age ... 57
Annex 4: Bivariate Correlation of 3 Dependent Variables with Academic Degree ... 59
Annex 5: Results of the Independent T-Test Comparing Gender for Dependent Variables ... 61
Annex 6: Results of the Independent T-Test Comparing Nationality for Dependent Variables . 61 Annex 7: Results of the Independent T-Tests Comparing Main Occupation for the Dependent Variables ... 62
Annex 8: Factor Analysis for CIP Cars (Component Matrix) ... 62
Annex 9: Reliability Statistics for CIP Cars ... 63
Annex 10: Factor Analysis for CIP Bottled Water (Component Matrix) ... 64
Annex 11: Reliability Analysis for CIP Bottled Water ... 65
Annex 12: Paired Samples T-Test for Product Involvement ... 65
Annex 13: Factor Analysis for Brand Identity ... 65
Annex 14: Reliability Statistics for Brand Identity ... 66
Annex 15: Linear Regression for Ln_Likes and #Followers ... 66
Annex 16: Linear Regression for Ln_Comments and #Followers ... 67
Annex 17: Non Parametric Tests and Post Hoc Analysis for Engagement Rate ... 68
Annex 18: Descriptive Statistics of the Engagement Rate Metrics for each Brand Post ... 68
Annex 19: Paired Samples-T-Test for Brand Appeal for Type of Brand ... 69
Annex 20: Paired Samples-T-Test for Brand Appeal for Type of Product ... 70
Annex 21: Paired Samples-T-Test for Brand Identity for Type of Brand ... 70
7 Annex 23: Bivariate Correlation between Brand Identity and Product Involvement ... 72 Annex 24: Linear Regression for Willingness To Follow, Product Involvement and Brand Identity ... 73 Annex 25: Linear Regression Willigness to Follow, Product Involvement, Brand Appeal and Brand Identity ... 74 Annex 26: Bivariate Correlation between Product Involvement, Brand Engagement, Brand Appeal and Willingness To Follow ... 77 Annex 27: Bivariate Correlation between Brand Engagement and Brand Appeal ... 79
8 CHAPTER 1: INTRODUCTION
1.1 Background and problem statement
Social Networked Media (SNM) have been revolutionising marketing campaigns and the way consumers interact with brands. Through them, brands can now communicate in a more personal, close and diverse way with its consumers and in the process, get to know who they really are (Tsimonis & Dimitriadis, 2014). Indeed, SNM is recognised to be the most valuable asset a brand can currently have in terms of building relationships with both current and prospect consumers (Kane, et al., 2009) and in terms of brand success (Phan et al., 2011).
Over the last decade, traditional, one-way marketing communications have evolved to a two-way, peer-to-peer dialogue (Hutter et al., 2013), in which brands try to strengthen their relationships with consumers by engaging with them via SNM platforms like Facebook, Twitter or Instagram. As a result, consumers are moving from passive to active participants in digital marketing initiatives.
Nowadays, brands are increasingly allocating efforts into SNM and, therefore, expecting high levels of notoriety and engagement in the SNS (Wiertz and de Ruyter, 2007). That is why, when joining a SNS, brands want to maximise their consumer engagement (Phua and Ahn, 2014). The levels of engagement a brand has can be measured by the amount of likes, comments and shares its content gets (Sabate et al., 2014). However, the measures of engagement are only key performance indicators, not translating into sales figures, only measuring how well brands are performing in SNS (Li, Bernoff and Groot, 2011; Latiff and Safiee, 2015). The engagement a brand gets from its’ consumers is known as Consumer Brand Engagement (CBE) and besides de forms of engagements seen previously, there is another one often forgotten by managers; that is lurking, that occurs when a customer is engaged with a brand but not in an active way (Ferraro, Interdonato and Tagarelli, 2014; Pongpaew, Speech and Tiangsoongnern, 2017).
The starting point of CBE is the consumer involvement with a product category, which is a primary variable on the advertising strategy (Rothschild, 1979; Vaughn, 2000).
Brands are highly differentiated from each other, either by representing a high or low involvement product or having different qualities or characteristics. The value of differentiation between brands enables consumers to express their uniqueness in terms of the brands they choose to buy or consume. People buy different brands for different purposes, asides form the main purpose of a
9 product, one being the pleasure and symbol of success a product or brand may give a consumer. In fact, luxury products have been found to be bought due to their high symbol of success. (Lovett, Peres and Shachar, 2013). However, no matter the product that is being bought, consumers brand choice is sometimes affected by the availability of brands within a specific channel (Michaelidou and Dibb, 2008).
Little research has been conducted on the effect of products or brand characteristics on consumers’ engagement with brands in SNM. Lovett and co-authors (2013) have studied the impact of brand characteristics on Word-of-Mouth (WOM) generation, showing that the the higher the esteem, quality or luxury associated to a brand, the more WOM will be generated; and, that premium brands get more WOM than value brands. Other authors have focused on the effect that animosity towards the brand has on purchase intentions for low vs high involvement products (Park and Yoon, 2017), the impact of product characteristics on WOM generation (Dellarocas, Gao and Narayan, 2010) and the influence of brand type on E-WOM generation (Godey et al., 2016). On the other hand, brand strength has been studied by Brannon and Brock (2016) to increase consumers involvement, and by Warrignton and Shim (2000) to increase the commitment of the consumers, and therefore, the frequency of their interactions with brand posts. However, to the best of our knowledge, no study has yet focused on how product or brand characteristics may moderate consumers’ level of engagement with a brand on SNM.
Considering that product characteristics are the basis of most branded content in SNS, and that they are the basis for the different product involvement categories, it is crucial to understand whether high and low involvement products get the same levels of engagement from consumers.
1.2 Aim and Scope
This dissertation aims to study the impact of product and brand characteristics on consumers’ engagement with brands in SNM, namely by investigating how these may impact their responses to branded content.
In view of this, the following specific questions were proposed as object of research:
RQ1: Does product involvement affect consumers’ level of engagement with a brand in SNM? RQ2: Does brand strength affect consumers’ level of engagement with a brand in SNM? To answer these questions, empirical primary and secondary research was conducted.
10 To study the impact product involvement and brand strength had on consumers level of engagement with a brand in SNM, three things had to be defined: the products, the brands and the SNM.
There are two product involvement categories, low and high involvement products. According to the CIP scale (Kapferer and Laurent, 1985, 1993), and afterwards supported by the results from the primary research data, bottled water is considered a low involvement product and cars are considered a high involvement product. A high involvement product can be defined has having a high personal interest, a strong hedonic pleasure, a high symbolic value, a high purchase risk and a high probability of error. On the other hand, a low involvement product can be defined as having a low personal interest, a low hedonic pleasure, a low symbolic value, a low purchase risk ad a low probability of error.
In view of this, two brands were selected for each level of product involvement considered. When determining which brands to study, the main idea was to choose a highly popular brand on Instagram (to represent high brand strength) and a less popular brand (to represent low brand strength). The most popular brand for each level of product involvement considered were Voss and BMW. However, for the less popular brands, the decision was harder because the low number of followers meant that the engagement with the brand posts would not be relevant for this study. Hence, Evian and Mini, which have way less followers than the other two brands, were chosen as representatives of the low involvement product
The SNS chosen for this dissertation study was Instagram. Being named the fastest growing SNS globally, this research focused on Instagram due to its increasing popularity and strong visual oriented culture (Lee et al., 2015; Sheldon and Bryant, 2016). Since its launch in 2010, Instagram has been very successful in capturing millennials’ attention in recent years, being a trendy and convenient SNS for users to adapt to (Latiff and Safiee, 2015). Statistics even point that the interaction rate on Instagram is higher than on Facebook (Quintly, 2015). Being a simple and creative platform, the idea behind Instagram is to share photos and videos using a hashtag and a filter (Lee et al., 2015; Sheldon and Bryant, 2016). When using Instagram, consumers can engage with a brand by liking, commenting, sharing and saving the posts a consumer or a brand shares. However, Instagram is not primarly relevant for consumers since it is also relevant for brands that want to promote and sell its products.
11 The secondary data form the four brands’ Instagram pages was taken on the November 5th, 2017 and it represented brand posts that were published between June 7th and November 3rd of 2017. For the primary data, a survey was conducted from November 28th to December 12th, 2017, and having been closed on this last day.
1.3 Research Methods
In the view of the aim of the dissertation stated above, a descriptive and an explanatory research approach were followed. In the first part of this dissertation, a descriptive approach was pursued by collecting secondary data from the selected brands Instagram page. This collection of data entitled 55 posts from each brand, allowing for an analysis of 220 Instagram brand posts, and was taken on November 5th of 2017, recording interactions between June 7th and November 3rd of 2017. The collection of this data allowed for the analysis of the number of likes and comments each brand got for each of the 55 branded content posts, on Instagram. This information was used to study in which product category consumers were spending more time engaging with brands; that is, find for each product category, where consumers were engaging the most.
In the second part of this dissertation, a more explanatory approach was undertaken through the collection of quantitative data. This data was retrieved through the performance of a survey from the 28th of November to the 12th of December, testing the consumers’ appeal to brands, involvement with products and engagement with the brand posts.
1.4 Relevance
The results of this dissertation aim at providing a better understating of how different product characteristics may moderate the impact of a brands’ SNM activities on Instagram.
Social Media, being the most powerful medium for relationships building, provides extended channels and interaction points between consumers and brands (Zahoor and Qureshi, 2017; Bartlett, 2010). By effectively using SM, brands can expect increases in their brand loyalty, brand equity, brand attitude, brand awareness, perceived quality, brand associations and brand loyalty (Zahoor and Qureshi, 2017; Erdoğmuş & Çiçek, 2012; PrakashYadav and Rai, 2017; Schivinski and Dabrowski, 2016). For brands, an investment in SM marketing can mean an increase in sales, in the involvement of consumers in the creation process of a brand, a better targeting of customers, an increase in WOM and eWOM and an increase in website traffic (Tsimonis and Dimitriadis, 2014; Sabate et al., 2014).
12 When joining a SNS, brands want to maximise their consumer engagement (Phua and Ahn, 2014); however, that can only be possible by acknowledging this is a long-lasting activity that will not present itself in the form of revenue in the short-term (Barger, Peltier and Schultz, 2016). Hence, a brand cannot just be present in a SNS, it needs to conduct well thought investments and marketing strategies. This goes in line, with previous studies that show that the content a brand puts up needs to be relevant (with value-added information), posted regularly, fun, entertaining and out-of-the-box, stimulating consumers interaction with a brand and its’ engagement (Sabate, et al., 2014; Scott, 2007; Sterne, 2010; Erdoğmuş & Çiçek, 2012);
Marketeers and brand managers need to identify the best way to create efficient content that will attract the attention of the consumers, allowing for their engagement with the brand. For this reason,brands need to understand that low and high involvement products have a different impact on consumers’ engagement on Instagram. Regarding this, marketers can better segment consumers, granting better targeting promotion strategies (Michaelidou and Dibb, 2008). This is especially true, since involvement has been proven to influence consumers decision making, information processing and communication behaviours (Laurent and Kapferer, 1985; Michaelidou and Dibb, 2008). Hence, by studying how different levels of product involvement affect the consumers’ engagement with a brand on SN, marketers can maximise their use of SM platforms, increasing their brand awareness, online sales and brand loyalty (Momany and Alshboul, 2016; Orzan et al. 2016).
The results of this dissertation are, therefore, helping marketers and brand managers create more accurate content for its’ Instagram page. A better understanding of how products characteristics impact the consumers’ engagement with a certain brand post, may help brands to better allocate resources into content that it knows will have a higher engagement; thus, helping brands optimism their social media network strategies. After all, by having a relevant presence in SNS, marketers can expect an increase in customer retention, brand awareness, customer lifetime value, share-of-wallet, sales growth and profitability (Cummins et al. 2014; Barger, Peltier & Schultz, 2016; Tsimonis and Dimitriadis, 2014; Pongpaew, Speech and Tiangsoongnern, 2017). Marketers and brands should continue their presence on Social Media, by having a present position and by continuously producing engaging and relevant branded content, to stimulate consumers into “liking”, commenting and sharing the branded content (Schivinski, Christodoulides and Dabrowski, 2016).
13 1.5 Dissertation Outline
Chapter 2 will review relevant literature for this dissertation on branding in social networked media, on branded content and consumer engagement, on the effects of product involvement on consumer engagement and on the effects of brand strength on consumer engagement; from which the research questions were drawn from. Chapter 3 presents a research approach and the methods used, while chapter 4 reports and discusses the results obtained. In the end, chapter 5 will draw the dissertations’ main conclusions, implications to marketing research and its potential limitations and suggested directions
14 CHAPTER 2: LITERATURE REVIEW AND RESEARCH HYPOTHESES
2.1 Branding in Social Networked Media
SNM has changed marketing communications decisively by enabling brands to the reach larger audiences in a more cost-effective manner. One the other hand, SNM has empowered consumers by promoting peer-to-peer communication and thereby paving the way for a true dialogue to exist between consumers and brands (Campbell, Ferraro and Sands, 2014; Schivinski and Dabrowski, 2016). SNM offers an important way for brands to get closer to consumers and become more relevant in their lives (Tsimonis and Dimitriadis, 2014; PrakashYadav and Rai, 2017). Among other activities, it enables brands to create and/or share relevant and engaging content with customers and prospects, in the hopes of attracting their attention and inspiring them to interact with them, evaluate it positively and further disseminate it among their peers (Schivinski and Dabrowski, 2016; Phua and Ahn, 2016; Tsimonis and Dimitriadis, 2014).
Marketing budgets for activities in social media are growing, since brands are interested in establishing their presence in SNS (Latiff and Safiee, 2015). A well-crafted and strong presence in SNM should therefore translate into higher levels of customer engagement with the brand, as well as more positive attitudes, and ultimately higher sales, satisfaction and loyalty (Zahoor and Qureshi, 2017; PrakashYadav and Rai, 2017; Schivinski and Dabrowski, 2016). In practice, brand engagement translates into a set of measurable actions that consumers take on SNM in response to a brands’ presence and activities. These entail “liking”, commenting, sharing branded content, as well as posting their own content (e.g., product reviews) (Barger, Peltier and Schultz, 2016; Gummerus et al., 2012).
Brands have been adopting SNS into their SM marketing efforts, in particular, with the use of Instagram. This SNS seems to fit most brands since it attracts a large crowd for a minimal capital invested, and allows for a strong visual description of a brands products, which in turn increases the effectiveness of the communications (Latiff and Safiee, 2015).
2.2 Branded Content and Consumer Engagement
Brands are increasingly using social media platforms as a part of their marketing and communication strategies, yet few research has been done to understand consumers behaviours
15 towards a brand on social media (Araujo et al, 2015; Fulgoni and Lipsman, 2015; Yadav and Pavlou, 2014).
According to Van Doorn and co-authors (2010), consumer engagement is based on behaviours, extends beyond purchase and centres its focus on a brand or a firm. Vivek and co-authors (2017) defined consumer engagement as “the intensity of an individual’s participation in and connection with an organisation’s offerings and/or organisational activities, which either the customer or the organisation initiate”. As it has been stated previously, consumer engagement is defined as a common objective for brands when using social media (Ashley and Tuten, 2014). The definitions of consumer engagement behaviours vary between brands and must be defined by them; hence managers need to understand how their consumers behave and interact with brands on social media before effectively employing marketing strategies on social media. However, it is recognised that engaged consumers choose how involved they become with a brand, and their behaviours can be active ones where they participate and share brand content; or their participation can be a passive one, known as lurkers, meaning they are involved simply by consuming the content a brand posts (Pongpaew, Speech and Tiangsoongnern, 2017; Ashley and Tuten, 2014). Generally, for a SNS, consumer engagement can be defined as a set of measurable actions that consumers take in response to a brands’ content post, such as “liking”, commenting, sharing and posting UGC (product reviews) (Barger, Peltier and Schultz, 2016; Gummerus et al., 2012). For a SNS like Instagram, consumer engagement is defined by the amount of likes and comments a brand posts gets.
Content creation is a key part of a brands’ SNM strategy. Content that is relevant and posted regularly is essential to capture attention, stimulate interaction and increase engagement (Sabate et al, 2014). Hutter and co-authors (2013) concluded that by posting high quality branded content on SNS, brands can increase awareness, positive WOM and buying intentions. Additionally, content with high information and entertainment motivations will likely increase engagement (Campbell et al., 2014). Brands should always try to only publish content that its’ consumers will want to see, by providing value-added information, by being fun, entertain and out-of-the-box (Scott, 2017; Sterne, 2010). Nonetheless, brands should be careful not to annoy or disengage consumers with too much content (Hutter et al, 2013; Lipsman et al., 2012).
16 2.3 Effects of Product Involvement on Consumer Engagement
The Consumer Involvement Profile (CIP) has been proposed as a valid, unidimensional, psychometric measure of consumers’ level of involvement with specific products or categories (Laurent and Kapferer, 1985). It comprises five antecedents of this construct: 1) the personal interest a consumer has in the product; 2) the hedonic value or the pleasure a consumer gets from the product; 3) the sign, symbolic or self-expressive value of the product; 4) the perceived magnitude of the purchase risk; and 5) the perceived probability of the purchase risk. According to Mittal (1995), an object is considered involving either because it has a positive sign value and/or pleasure value, and/or it has risk importance. From this CIP model, two different product types can be obtained: high and low involvement products. A high involvement product can be defined, from this scale, has having a high personal interest, a strong hedonic pleasure, a high symbolic value, a high purchase risk and a high probability of error. On the other hand, a low involvement product can be defined as having a low personal interest, a low hedonic pleasure, a low symbolic value, a low purchase risk ad a low probability of error.
Other scales can also be used to classify product involvement. One study conducted by Vaughn (2000) showed that products could be classified into two dimensions: the “think” dimension that is related to function or performance, and the “feel” dimension that is related to pleasure or self-expression. However, Kapferer and Laurent (1985) pointed out that the two dimensions of “think” and “feel” correspond to their CIP scale dimensions of perceived symbolic value and perceived pleasure value. Products can also be classified into having hedonic or symbolic value. From the same scale of Kapferer and Laurent (1985), hedonic products have an emphasis in pleasure or self-expression and utilitarian products have an emphasis in function or performance. From this product involvement classification, a high utilitarian product is used to solve specific problems and a high hedonic product is bought to give the consumer a feeling or pleasure (Babin, Darden, & Griffin, 1994). Furthermore, Product Category Involvement (PI) is generally understood as the perceived relevance of a product category to an individual costumer based on this or her inherent values, needs and interests
Product involvement is a marketing construct that reflects the level of personal relevance of a product or a category to consumers. (Michaelidou and Dibb, 2008).
The degree of a consumers’ involvement with a product category has been considered, for a long time, a major variable relevant to the advertising strategy (Rothschild, 1979). Research conducted
17 by Thongthip and Jaroenwanit (2016) has concluded that the five dimensions of the CIP profile have a positive influence on consumer brand engagement. The authors stated that this relationship should not be surprising since product involvement is one of the factors that helps to build customer brand engagement, by focusing on the importance, interest, arousal and motivation that an individual feels towards a brand. Involved consumers will, therefore, be more loyal to a brand within the same product category (Traylor 1981; Iwasaki & Havitz 1998). These studies are supported by further research conducted by Cheung and co-authors (Cheung, Lee and Jin, 2011) which studied that involvement in online structured communities has a positive impact on consumer brand engagement in online communities.
Among other important effects, product involvement dictates the level of attention and effort consumers are willing to devote into making product-related decisions, including responses to advertising and other forms of marketing communication (Laurent and Kapferer, 1985). Park and Moon (2003) studied that product type is one of the variables that influences the correlation between product involvement and product knowledge.
Product involvement is therefore an important segmentation and targeting criteria, that helps brands make efficient promotional strategies (Michaelidou and Dibb, 2008).
Some research has been done to evaluate product involvement; however, none has focused on how product characteristics and brand content affect product involvement.
2.4 Effects of Brand Strength on Consumer Engagement
Brand strength can be related to brand associations and brand attitudes. That is, how strong a brand is, can be related to the strength of associations a brand has in the consumer’s mind and the attitude they have towards the brand (Aaker, 1996; Page and Herr, 2002).
Another way of discussing brand strength is brand equity. Brand equity is a consumers’ subjective and intangible perception of a brand (Kim et al., 2008; Lemon et al., 2001). Hence, when talking about brand equity the power lies in within the consumers and not the brand (Dillon et al., 2001). Brand equity compromises brand loyalty, brand knowledge, perceived quality, brand associations, market fundamentals and marketing assets that help brands differentiate from other brands and influence consumer’s perceptions about brands. When these elements are agreeable in a consumer’s mind, the brands’ equity is also considered positive. On the other hand, if these elements are negative, the brand equity will also be negative (Tiwari, 2010).
18 Brand strength has been studied, and condensed by Park and Moon (2003), to affect consumers responses to adverting (Dahlen and Lange, 2005), consumers judgement of product quality (Page and Herr, 2002), retailing context (Woodside and Walser, 2007), brand extension pricing strategy (DelVecchio and Smith, 2005). Others, have studied that weak brands are perceived as more prototypical to the product category because they do not have any other type of information to base their opinions on (Brannon and Brock, 2006). Hence, weak brands, that have predominantly more uninvolved and uncommitted customers, will experience a phenomenon of having their customers switch brands more easily, since the brand will be perceived as being unimportant in their decision making-process. On the other hand, customers that are more committed to a brand (more common in stronger brands) will experience less brand switching, since their attitudinal beliefs are stronger (Warrington and Shim 2000).
For this dissertation, brand strength will be calculated by the number of followers a brand has. That is, a stronger brand will be perceived as a brand with a strong following on Instagram, e.g. 1 Million followers, and a weak brand will be perceived as a brand with a weaker following on Instagram, e.g. 50.000 followers.
2.5 Effects of Brand Identity on Consumer Engagement
Brands have been shown to play a crucial role on the construction and preservation of consumers identities (Keller, 1993). Consumer-Brand Identification (CBI) has been described has the consumers state of oneness with a brand, or in other words it is the degree to which a brand expresses and enhances a consumers’ identity (Stokburger-Sauer, Ratneshwar & Sen, 2012; Kim et al., 2008). Bagozzi and Dholakia (2006) have defined brand identification as ‘‘the extent to which the consumer sees his or her own self-image as overlapping with the brand’s image’’. Overall, a consumer may feel an identification with a brand if that brand has a similar personality to him, if it is unique or distinctive and prestigious.
Importantly, the extent to which a consumer identifies with a brand, will determine his engagement with branded content posts on SNS and increase brand commitment (Muntinga, Moorman & Smit, 2011; Bhattacharya and Sen, 2003). Tuten and Solomon (2014) have studied that by using SMM, in advertising or events, brands are enhancing their brand image and brand identification, resulting in a more positive and increased purchase behaviour.
19 Stokburger-Sauer and co-authors (2012) studied that there are six antecedents for consumer-brand identity. This means that, consumers will identify more with brands if (1) the brand is similar to the consumers’ personality, (2) the brand is perceived to be distinctive, (3) the brand is perceived to be prestigious, (4) the more social benefits a brand provides consumers with, (5) brands are perceived to possess a warm personality and (6) the brand provides memorable experiences. The brand self-similarity antecedent is the extent to which a consumer might feel a similarity between his personality and that of a brand. The brand distinctiveness aspect of CBI is that an individual always strives to distinguish himself from others in social occasions, and through the consumption of certain brands, consumers seek to affirm their identity (Tajfel and Turner, 1986; Thompson et al., 2006). The brand prestige antecedent is associated with the prestige, status or esteem that is associated with a brand. The brand social benefits aspects refer to the fact that by identifying with certain brands, consumers connect with certain groups or communities. The brand warmth antecedent refers to the fact that brands may be perceived as cold or warm, due to its attributes, positioning or marketing communications. The memorable brand experiences antecedent is the extent to which consumers have had positive memories with the consumption of a brand. The study of Stokburger-Sauer (2012) also pointed out that the higher a consumer’s involvement with a product category, the stronger role these antecedents will play in the construction of a CBI.
2.6 Conclusion and Derived Hypothesis
SNM engagement is crucial for brands since it allows for an increase in loyalty, customer retention, brand trust, brand commitment, brand satisfaction, brand awareness, WOM, among others (Van Doorn et al, 2010; Gambetti and Grattigna, 2010; Brodie et al, 2011; Dessart, 2017; Brodie et al., 2013). To reach this, brands need to post relevant and interesting content in their platforms. Content that the audience will enjoy and feel empowered to engage with, by sharing, “liking” or commenting (Schivinski and Dabrowski, 2016; Tsimonis and Dimitriadis, 2014; Lipsman et al., 2012). Consumers engagement with branded content is considered a key metric to evaluate the success of a brands’ social media marketing efforts (Nelson-Field et al., 2012). However, little is still known about how consumers respond to branded content on Instagram, particularly about how this response may vary with different product characteristics.
20 RH1: Consumers’ engagement with branded content in SNS is higher for high than for low involvement products.
According to Lovett and co-authors (2013), premium and luxury products, that are perceived as high involvement products, get higher WOM. Electronic and offline WOM is one way for consumers to engage with brands; thus, it can be said that for high involvement products, consumers will provide higher levels of engagement with a brand. Further, consumers that are strongly involved with a brand will be more loyal to a brand within the same product category (Traylor 1981; Iwasaki & Havitz 1998). Hence, high involvement products have more loyal and therefore, more engaged consumers. Furthermore, Thongthip and Jaroenwanit (2016) concluded that the five CIP dimensions have a positive influence on consumer brand engagement. According to the CIP scale by Kapferer and Laurent (1985), high levels for the CIP dimension represent high involvement products. Thence, high involvement products will generate higher levels of consumer brand engagement.
The second and third research question this dissertation will study are the following:
RH2: Consumers’s engagement with branded content in SNS is higher for stronger than for weaker brands.
RH3: Consumers’ engagement with branded content in SNS is higher for high involvement products of stronger brands than for low involvement products of weaker brands.
A stronger brand in this thesis is described as a brand with a stronger number of followers, compared to a weaker brand that has few number of followers. Research has concluded that brand strength is associated with brand attitudes and brand associations (Aaker, 1996; Page and Herr, 2002). Hence, if consumers display higher levels of brand attitudes, it can be derived that they will interact more actively with branded content on social media. Brand strength has also been studied to affect the level of consumers attention and response to advertising (Park and Moon, 2003). Thus, consumer when faced with advertising from a stronger brand, will be more attentive to said advertising, or in the case of this thesis - brand content. Brannon and Brock (2016) have concluded that weaker brands have more uninvolved and uncommitted consumers. Hence, it is not surprising that for weaker brands consumers’ will not spend much time interacting with branded content. In accordance, Warrington and Shim (2000), concluded that for stronger brands, with more committed consumers, brand post interactions will be more common since consumers’ attitudinal beliefs are higher.
21 CHAPTER 3: METHODOLOGY
3.1. Research Approach
According to Aaker and co-authors (2010) there are three types of research approaches: exploratory, descriptive and explanatory. The exploratory research is used when identifying and explaining a new and complex phenomenon about which little is yet known. A descriptive approach is used to provide a detailed picture about a known phenomenon, that has a lot of research done about it, that allows for the formulation of generalisations. Finally, the explanatory research is used to test casual relationships underlying a phenomenon, about which there is a lot of theoretical background that allows researchers to test cause-effect relationship (Saunders, Lewis, & Thornhill, 2009).
The dataset extracted from Instagram entailed the number of users that “liked” and “commented” a brand post on Instagram, allowing for the calculation of the “engagement rate”. The “likes” and “comments” were the only information available to calculate the engagement rate since the other functionalities on Instagram are not easy to access or have not, yet, been developed (unlike the case of Facebook). For instance, at the time of this dissertation, a brand cannot access the number of users that “saved” or “shared” a post; and, since Instagram does not allow for brand posts to have a direct link, it is almost impossible to calculate the referral traffic to the brands website. This can now be done only on Instagram Stories, but that is not the focus of this research.
3.2 Research Methods
This dissertation undertook a descriptive and explanatory approach to determine whether product involvement and brand strength affects the consumers’ level of engagement with a brand in SNM, namely Instagram. Firstly, undertaking a descriptive approach, secondary data from past brand posts, from the selected brands Instagram pages were collected and statistically analysed to assess the impact that product involvement and brand strength had on the consumers engagement with a brand. Additionally, undertaking an explanatory approach, primary data was conducted, through a survey, to assess how consumers perceived brand engagement, brand appeal and brand identity of the selected brands and how they assessed the involvement of the chosen products. Both data were essential to test the proposed hypotheses.
22 3.3 Secondary Data
3.3.1 Study Design
The secondary data was collected from the four brands chosen Instagram pages, and compiled into an SPSS dataset. As it was explained previously, these brands were selected to effectively represent each of the two products chosen to represent low and high involvement products. The products selected were bottled water and cars; moreover, the brands selected for each one was Evian and Voss, and Mini and BMW, respectively.
The collection of the secondary data aimed at analysing the impact of product involvement and brand strength on the consumers’ engagement with each brand. When collecting this data, 55 posts from each brand were assessed, to get a sample size of 220 posts. The 55 posts were selected in ascending order, meaning that the first 55 posts were selected, without any discrimination. From each post the variables likes and comments were extracted. The variable for the number of followers was extracted on November 5th, 2017, the same date for the extraction of the brand posts variables.
3.3.2 Population and Sample
The population of the secondary data are the 220 brand posts collected from Instagram. The data was collected from 55 Instagram brand posts from each of the four brands (Evian, Voss, BMW and Mini), on the 5th of November, 2017, recording interactions between June 7th and November 3rd of 2017. As explained before, there was no exclusion method when selecting each 55 posts; simply, they were selected based on the newest 55 branded content posts published by the brand.
3.3.3 Data Collection and Analysis
The secondary data dataset was created on the 5th of November 2017, recording brand post interactions between June 7th and November 3rd, 2017. There is no program available to extract this data from Instagram, so the extraction of the data was made by hand and introduced in an Excel file. After extracting the data onto an Excel file, the data preparation and analysis was done with IBM SPSS statistical software.
The objective of the recollection of the data was first to see the engagement each brand had on each branded content post. The way total engagement was calculated on Instagram was by
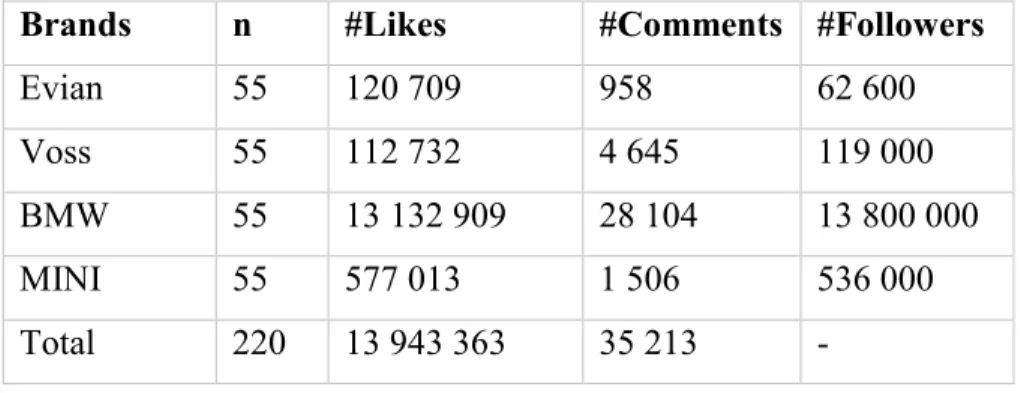
23 counting the number of likes and comments a branded content post had. The engagement rate was later calculated by dividing the total engagement by the number of followers the brand’s Instagram page had. The dataset with the consumer engagement on Instagram contained 220 posts (55 posts for each brand) that were uploaded by the four different brands during the second semester of 2017. Since the results of these study will be a 2x4 metric, then the relevant amount of posts that must be studied are at least 210 posts. A total of 13,978,576 users interacted with these brand posts: 13,943,363 by “liking” it and a total of 35,213 by commenting this brand posts. Table 1 presents the information taken from each Instagram page or brand post.
Table 1 –Metrics of consumer engagement with each brand post.
Brands n #Likes #Comments #Followers
Evian 55 120 709 958 62 600
Voss 55 112 732 4 645 119 000
BMW 55 13 132 909 28 104 13 800 000
MINI 55 577 013 1 506 536 000
Total 220 13 943 363 35 213 -
Table 2 provides the mean, standard deviation, minimum and maximum values of the dependent variables of the brands Instagram posts. From the results, it is possible to conclude that the values for the number of likes were higher than comments. It is important to state that commenting on a post is considered to be more engaging than liking the same posts, since it is a more time-consuming activity (Ferraro, Interdonato and Tagarelli, 2014). Also, due to different brand strengths (calculated by the number of followers of each brand on its’ Instagram page) it is normal to have big discrepancies on the number of likes and comments between brands.
24
Table 2 - Descriptive statistics of the consumer engagement metrics for each brand post (n=220).
Dependent Variables Mean Standard Deviation Minimum Maximum
Likes Evian 2194.71 4 408.68 314 22 840 Likes Voss 2049.67 636.70 726 4 286 Likes BMW 238 780.16 79 017.67 24 772 405 698 Likes Mini 10 491.15 4 725.78 3 111 21 397 Comments Evian 17.42 29.24 1 187 Comments Voss 84.45 247.04 4 1 797 Comments BMW 510.98 247.96 69 1 321 Comments Mini 27.38 22.57 1 140
Engagement Rate Evian 3.53 7.08 0.51 36.78
Engagement Rate Voss 1.79 0.61 0.62 4.04
Engagement Rate BMW 1.73 0.57 0.18 2.95
Engagement Rate Mini 0.08 0.04 0.02 0.16
Results show that BMW branded content posts, having the highest brand strength, showed the highest amount of likes in total. Surprisingly, even though Evian had the least brand strength, it was Voss that showcased the least number of likes in total. This can be due to branded content of Evian being more engaging than the branded content of Voss, or that Voss has a higher number of “ghost” followers. Evian, out of the four brands, also showed a higher value of skewness which means that their posts have a high discrepancy of likes per post, meaning that some posts get far more likes than others. It comes as no surprise that the high involvement products have a higher sum of likes.
When analysing the descriptive statistics for the “comments” brands received from the brand posts that were analysed, BMW shows the highest value and Evian the lowest value, without surprise due to each brands’ strength. Interestingly, Voss, having lower followers than Mini, registered a higher number of comments, with a very significant difference of more than 3.000 comments. For low involvement products the number of comments was lower than compared to high involvement products.
As for the engagement rate descriptive analysis, the highest value of engagement rate was achieved by Evian, which is a low involvement brand and, out of the four, has the lower number of followers.
25 This can be due to either low involvement products having higher engagement rates or because of lower number of followers will get higher engagement rates. However, this last is not consistent since form the high involvement products Mini has the lowest number of followers (compared to the other high engagement product brand - BMW) and the lowest engagement rate. Furthermore, low engagement products got a higher engagement rate compared to high engagement products.
3.3.4 Test of Normality
Figure 1 presents the histograms of the dependent variables considered (likes, comments and engagement rate). When analysing the frequencies of the aforementioned metrics, it was possible to observe that they were not following a normal distribution. To solve this, the dependent variables likes and comments were linearised through transformations (natural logarithm). Meanwhile, the independent variable (brand) was changed into n-1 dummy variables. Dummy variables were used to classify the variable brands into four different brands: Evian (1), Voss (2), BMW (3) and Mini (4). Furthermore, as it is shown in Figure 1, the variable Engagement Rate was not found to follow a normal distribution. To solve this, the variable was linearised through transformations (natural logarithm). However, when testing for its’ distribution it was also found not to follow a linear distribution. Hence, appropriate non-parametric tests were employed for this variable.
26 Figure 1 – Histograms of the distributions of Likes, Comments and EngagementRate.
3.4 Primary Data
3.4.1 Study Design
The secondary data was validated and complemented through the collection of primary data, through the performance of an online consumer survey. The survey was administered through Qualtrics and distributed essentially among Facebook contacts between the 28th of November 2017 until the 12th of December 2017. The survey was available in both English and Portuguese versions (Annex 1).
27 Survey respondents were essentially asked to evaluate the appeal of the branded content posts, of the four brands studied, to report their level of involvement with the corresponding product categories and their level of engagement with the brands’ posts. To this end, respondents were exposed to a set of six branded content posts from each of the four brands, and were asked to rate each post on a scale from 1 (not appealing at all) to 7 (extremely appealing), to asses each consumers’ engagement with a brand post. Participants were also asked to respond to a CIP scale (Kapferer and Laurent, 1985, 1993) from 1 (strongly disagree) to 7 (totally agree) to evaluate its’ involvement with water and cars. Furthermore, respondents were asked to evaluate their appeal or identification with a brand, through a series of sentences that had to be evaluated from 1 (totally disagree) to 7 (totally agree).
3.4.2 Population and Sample
The survey was administrated through Qualtrics. A total of 311 responses were recorded, of which 17 did not complete at least 75% of the survey (n=294). From the remaining 294 respondents, only 134 passed the first two screening questions, having ages comprised between 50 and 16 years old, and being an Instagram user. From the remaining 134 respondents, over 50% were aged between 18 and 23, ca. 67,8% were female, ca. 76% Portuguese, ca. 63,6% student and ca. over 80% with an undergraduate or graduate university diploma. Table 3 presents the information about the socio-demographic characteristics of the survey respondents.
Table 3 - Socio Demographic Characteristics of the Survey Respondents (n=134)
Gender Female 67.8% Male 32.2% Nationality Portuguese 76% Other 24% Main Occupation Student 63.6% Full-Time Job 31.4% Unemployed 5% Highest Academic Qualification
Less than high school diploma 0.8%
High school diploma 17.4%
28 Graduate university diploma 40.5%
Age 18-25 67.7%
25-35 13.2%
35-45 9.9%
45-52 9.1%
3.4.3 Data Collection and Analysis
The primary data dataset was created, with a total of 311 respondents, on the 12th of December 2017, the same date that the survey was closed. The data preparation and analysis were conducted with the help of IBM SPSS statistical software.
The primary data had three main groups of dependent variables: brand appeal with the branded content posts, brand engagement and willingness to follow the brand after seeing the branded content posts. The independent variables considered in the analysis of the primary data were the frequency of Instagram usage, the number of brands followed on Instagram, the identification with the presented brands, the product involvement and the demographic variables: age, gender, nationality, academic degree and main occupation. The variable Willingness to Follow was considered a relevant variable in this study since it evaluates if respondents would be willing to follow the brands after seeing and evaluating the brands’ branded content posts. This would be relevant to study whether respondents that did not follow the brands would be usual followers, but were not since they did not know the brand or did not know that the type of content would be appealing to them. Further in this study, this variable was relevant due to the variable that measured the engagement with a brand, already followed by respondents, did not have a significant sample size as most of the respondents did not follow these brands on Instagram.
The first step taken was to compute four new variables, to get the mean of the brand appeal for each brand. This was relevant to study the mean of each of the brands appeal on the six branded content posts presented to consumers, instead of having six brand appeal variables for each of the brands.
3.4.3.1 Bivariate Correlation
Pearson correlations were computed to study if there were no significant associations between the dependent variables, and the socio demographics (age and academic degree) and Instagram use.
29 Results show (Annex 3) that there is no significant statistical correlation between the age of the respondents and the three dependent variables at p < 0.05. Results also show (Annex 4) that there is no significant statistical association between academic degree and the three dependent variables. When analysing the Bivariate Correlation for Instagram usage and the number of brands followed on the same platform (Annex 2), this was found to be negatively correlated (p < 0.01), meaning that the higher a respondent’s Instagram usage, the higher the number of brands he or she follows. There is also a negative correlation between Instagram Usage and Willingness to Follow (WTF) Voss (p < 0.01) and the other three brands (p < 0.05); meaning that the higher the time a consumer spends on Instagram, the lower the willingness to follow the four brands, with special emphasis on low involvement products. As for the number of brands followed, there is a positive correlation between the WTF Evian (p < 0.05) and the other three brands (p < 0.01); meaning that the more brands respondents follow, the higher the chances they will follow the four brands. There is also a correlation between the brand appeal of Voss and the respondents Instagram Usage (p < 0.01) and the number of brands followed (p < 0.01).
3.4.3.2 Independence T-Tests
When testing for the differences in means of the three dependent variables and gender (Annex 5), results show that most variables present equality of variances, since sig > 0.05, except for the willingness to follow Evian and BMW. When testing for the homogeneity of the variables, most variables were found to be dependent of the gender of the respondents (since sig > 0.05) except for the willingness to follow Evian, the brand appeal of BMW and Mini. Hence, most variables are dependent of the gender of the respondents. From the results, it was possible to conclude that the willingness to follow Evian is higher for female respondents (Mean = -0.86; SD = 0.25), the brand appeal of BMW is higher for male respondents (Mean = 0.94; SD = 0.22) and that the brand appeal of Mini is higher for male respondents (Mean = 0.47; SD = 0.20).
The next t-test was conducted to study the means of the demographic variable nationality and the three dependent variables (detailed in Annex 6). Results show that most variables do not present equality of variances (since sig > 0.05), except for the willingness to follow Evian, Voss and Mini, the brand appeal of Evian and the brand engagement of Evian and BMW. When testing for the homogeneity of the means of the variables, most of the variables were found to be dependent of the nationality of the respondents (since sig > 0.05) except for the willingness to follow BMW and
30 Mini, and the brand engagement of BMW. Hence, from the results, it was possible to conclude that the willingness to follow Mini (Mean=1.19; SD=0.40) and BMW (Mean=1.04; SD=0.28) was higher for Portuguese respondents and the brand engagement of BMW was higher for Portuguese respondents (Mean=1.50; SD= 0.67).
The last independence t-test was conducted to study the means of the demographic variable main occupation and the three dependent variables (detailed in Annex 7). Results suggest that the assumption of homogeneity of variances is accepted for all the variables, being sig > 0.05, expect for the variables willingness to follow BMW and brand engagement of Voss. When testing for the homogeneity of means all the variables were found to have equal means. Hence, the dependent variables were found to be dependent of the respondents’ occupation.
3.4.3.3 Factor Analysis
A factor analysis was performed to calculate the product involvement, based on the Kapferer and Laurent CIP scale (1983, 1995). The analysis for bottled water (Annex 10) yielded 3 main components; still, the reliability index (Cronbach’s alpha) for of the whole scale was 90,1% (Annex 11). Similarly, the analysis for cars yielded a 4-component matrix (Annex 8), Again, the reliability index for the whole scale was 84,7%, which was deemed satisfactory (Annex 9). Therefore, mean scale scores were computed for cars and water, for each respondent, using all scale items. Mean of mean scale scores for bottled water were 2.48 (with a standard deviation of 1.10) and for cars was 4.65 (with a standard deviation of 1.01). Later, paired samples t-test results (Annex 12) showed that these means were significantly different (p < .000). Hence, it is possible to conclude that respondents’ involvement with cars was, as expected, much higher than that of bottled water.
Another factor analysis was conducted with answers to the brand identity scale. The factor analysis yields a unidimensional matrix, with just one component (Annex 13), and with a reliability index of 97,1% for Evian, 94% for Voss, 92,5% for BMW and 94,4% for Mini (Annex 14). Therefore, mean scale scores were computed for all brands for each respondent, using all scale items.
31 CHAPTER 4: RESULTS & DISCUSSION
4.1 Secondary Data
To test the impact that the number of followers had on the number of likes and on the number of comments, two linear regressions were performed.
When testing for the impact the number of followers had on the number of likes (Annex 15), it was deduced that the number of followers explains 80,6% of the number of likes (R2 = 0.806). Since β has a positive and high value, it can be concluded that the higher the number of followers, the higher the number of likes a brand will achieve.
When testing the impact of the number of followers had on the number of comments (Annex 16), it was deduced that the number of followers explains 66,1% of the number of comments (R2 = 0.661). Since β has a positive and high value, it can be concluded that the higher the number of followers, the higher the number of comments a brand will achieve.
Since the variable for the engagement rate is not linear, just like it’s linearization, it was not possible to perform a liner regression to study the impact of the number of followers.
4.1.1 Engagement Rate
A non-parametric Kruskall-Wallis test was conducted to investigate if the means of the engagement rate for each brand were significantly different from each other. Subsequently, post-hoc tests accommodating non-homogeneity of variance (Tamhane test) were computed, to check which brands differed significantly in engagement rate (Annex 19). The null hypothesis that the distribution of the engagement rate was the same across the different categories of brand was rejected (p <.0001).
Mean engagement rate was higher for Evian and lowest for Mini (Annex 18). Overall, brands of the low involvement product (Evian and Voss) produce higher engagement rates than high involvement product (cars).
The differences were statistically different, as can be seen in Annex 18, and the main ones were the ones between Evian and Mini (Mean = 3,46; sig = 0,004), Voss and Mini (Mean = 1,72; sig = 0,000) and BMW and Mini (Mean = 0,08; sig = 0,000). Looking only at the descriptive statistics, it may seem that Evian is the brand that shows the most differences, mainly due to their standard deviation (SD = 7,08); it is Mini that shows the most differences between brands, in terms of
32 Engagement Rate. The differences in the standard deviation of Evian may be explained due to the many outliers Evian has.
4.2 Primary Data
4.2.1 Paired Samples T-Test
A paired samples t-test was conducted to compare the means of the appeal between brands. From the results, shown it Annex 19, it was concluded that the highest brand appeal was found in Voss (Mean = 4.70; SD = 1.16) and the lowest brand appeal was found in Evian (Mean = 3.02; SD = 0.09). From a second analysis of the paired samples t-test, shown in Annex 20, comparing the means of appeal of the types of products, it was concluded that the mean of appeal for high involvement brands was higher than for low involvement brands (Mean = -0.23; SD = 0.96). In conclusion, the mean appeal is statistically different between brands (p < 0,05) and between products (p < 0,05). Moreover, the main differences were found between the brand appeal of Evian and Voss (Mean=-1.68; SD = 1.12) and Evian and BMW (Mean = -1.18; SD = 1.19); on the other hand, the smallest difference was found between BMW and Mini (Mean = 0.29; SD= 0.93). The big differences found between Evian and Voss and BMW can be due to the large numbers of outliers on Evian. Nevertheless, the small difference found between BMW and Mini can be because these are two car brands, with almost the same type of appeals.
A paired samples t-test was conducted to compare the means of the brand identity between brands. From Annex 21, it can be concluded that the brand identity between brands is statistically different (p ≤ 0.05) just like the brand identity between products is different (p ≤ 0.05). From the results, it
can be concluded that, the brand identity for Mini is the highest (Mean = 2.6459) and the brand identity for Evian is the lowest (Mean = 1.6984). From Annex 21, it is concluded that there are no statistically differences between the brands BMW and Mini (T(121) = -.064; p=.949) and the brands Evian and Voss show some difference (T(121) = -2.149; p=.034). Furthermore, shown in Annex 22, the brand identity for high involvement products is higher than for low involvement products. Moreover, the mains differences between brands were shown for Evian and Mini (T(121) = -6.761; p=.000), and Evian and BMW (T(121) = -6.523; p=.000). In conclusion, respondents tend to identify more with high involvement products, since there is a correlation between the two.
33 4.2.2 Bivariate Correlation
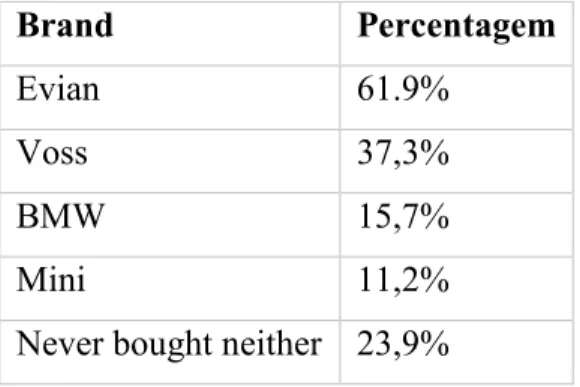
A correlation analysis was conducted to study if there was a statistically significant correlation between brand identity and product involvement (CIP). From the results, shown in Annex 23, it was concluded that the brand identity with low involvement products was correlated with the CIP of bottled water; and, additionally, the brand identity with high involvement products was correlated with the CIP of cars. An outlier on these correlation, was the brand identity with Evian that was shown to be correlated with the CIP of cars. In conclusion, the CIP of bottled water is strongly correlated with the brand identity of water, and vice-versa. Meaning, that the product is very important for a consumer, hence why they identify with a brand. And, a consumer identifies with a brand if they consider the product to be very important. Additionally, the CIP of cars is correlated with Evian, BMW and Mini. These results can be explained since all these three brands are considered to be luxury brands. Voss is also considered to be a luxury brand, however, (Table 4) only 37,3% of the responds had bought Voss compared to 61,9% that had bought Evian before. Hence, in our sample Voss is not so well known.
Table 4 - Frequency Descriptives of Which Brands Respondents Had Bought Previously
Brand Percentagem
Evian 61.9%
Voss 37,3%
BMW 15,7%
Mini 11,2%
Never bought neither 23,9%
A second correlation analysis was conducted to study if there was a statistically significant correlation between product involvement, brand engagement, brand appeal and willingness to follow a brand. From this, presented in Annex 26, it was concluded that the product involvement of cars affects the brand appeal BMW and Mini (p < 0.01); and the willingness to follow BMW (p < 0.01) and Mini (p < 0.05). The product involvement of bottled water, affects the brand appeal of Evian (p < 0.01) and the willingness to follow Evian (p < 0.05) and Voss (p < 0.01). Hence, product involvement affects the brand appeal and the willingness to follow; however, it does not influence
34 the brand engagement. These may be due to the fact that the variable for brand engagement is not significant, due to its low number of respondents.
A new bivariate correlation was conducted to test the correlations between brand engagement and brand appeal. From the results, presented in Annex 27, it can be concluded that there is not a correlation between the two variables, except for the brand appeal of Mini and the brand engagement of Mini (p < 0.01) and the brand engagement of BMW (p < 0.05)
4.2.3 Linear Regression
A linear regression analysis was conducted to study whether the brand engagement is a function of brand identity and product involvement. However, the variable engagement was not enough to have significant results, due to its low sample size. Hence, the variable for the willingness to follow a brand was considered the main engagement variable and the only that will be used.
The first linear regression was conducted for Evian, as shown in Annex 24 and Table 5. The results show that product involvement with bottled water had no influence on willingness to follow Evian (p > 0,05), unlike the brand Identity with Evian (sig < 0,05). Meaning that the willingness to follow a brand is influenced by the identity with a brand and not by the involvement with a product. The same can be concluded for the other three brands, as Annex 24 and Table 5 shows. Furthermore, R2 for low involvement products is lower than for high involvement products meaning that the brand identity for these products is not the sole significant variable that affects engagement; other irrelevant variables affect the willingness to follow a brand. In conclusion, when testing the willingness to follow a brand, the brand identity is always a strong determinant, unlike product involvement.
35
Table 5 – Coefficients of Regression Models for Product Involvement and Brand Identity
Model Dependent Variable Unstandardised Coefficients Standardised Coefficients t Sig. B Std. Error Beta 1 (Constant) .999 .360 2.773 .007 Mean_CIP_BottledWater WTF_Evian .195 .135 .154 1.446 .152 ID_Evian .387 .154 .268 2.514 .014 1 (Constant) 1.742 .404 4.310 .000 Mean_CIP_BottledWater WTF_Voss .210 .172 .126 1.220 .225 ID_Voss .463 ,162 .295 2.862 .005 1 (Constant) 1.070 .671 1.594 .114 Mean_CIP_Cars WTF_BMW .141 .158 .086 .896 .372 ID_BMW .490 .113 .419 4.352 .000 1 (Constant) 1.574 .720 2.188 .031 Mean_CIP_Cars WTF_Mini .017 .164 .009 .102 .919 ID_Mini .681 .112 .535 6.075 .000
To support this finding, four new linear regressions were conducted to study whether willingness to follow is a function of brand identity, brand appeal and product involvement. The first linear regression was conducted for Voss. As Annex 25 and Table 6 shows, the R2 of this model equals 0,405, meaning that 40,5% of the willingness to follow Voss is explained by the three independent variables and it is statistically significant (sig < 0,05). From our views, it would be logic that people would follow a brand on Instagram if they liked the brand, they liked the content of the brand posts and if they identified with the product. However, for Voss, people will have a higher willingness to follow if they identify with the brand (p ≤ 0.05) and with the content of the brand posts (p ≤
0.05). Once more, the involvement with the product is not relevant for the willingness to follow a brand (p > 0.05). In the same way, for the other three brands the same was concluded. The content of a branded content post and the identification with a brand is a function of the willingness to follow, unlike the involvement with a product. Furthermore, the brand appeal is considered the strongest variable that influences the WTF of all three brands.