Dissertation submitted in partial fulfillment of requirements for the
Master in Management
with Specialization in Strategy & Entrepreneurship,
at the Universidade Católica Portuguesa
___________________________________________________
"Mobile Commerce Adoption in India, a
Revised Technology Acceptance Model"
__________________________________________________
Supervisor
Daniel FERNANDES
Assistant Professor of Marketing
Católica Lisbon School of Business and Economics
Student
Beatrice PINI
Double Degree Student, Bocconi University
ID 152113219
3
Acknowledgements
To mom and dad,
backbones of my existence.
To my friends,
laughs in my life.
To my beloved,
serenity of my soul.
For all they have done,
For supporting me,
For loving me,
Thank You.
5
INDEX
LIST OF ABBREVIATIONS ... 7! LIST OF TABLES ... 8! LIST OF FIGURES ... 9! ABSTRACT ... 10! 1.! OVERVIEW ... 12!1.1.! Background and Motivation ... 13!
1.2.! Objective of the study ... 14!
1.3.! Problem Definition ... 14!
1.4.! Research Questions ... 15!
1.5.! Practical and Theoretical Value of the Study ... 15!
1.6.! Structure of the Study ... 16!
2.! MOBILE COMMERCE ... 18!
2.1.! Mobile Commerce Adoption ... 20!
2.2.! Theoretical Framework and Hypothesis ... 22!
2.2.1.! Consumer Behavior ... 22!
2.2.2.! Consumer Adoption ... 24!
2.2.3.! Theory of Reasoned Action (TRA) ... 25!
2.2.4.! Theory of Planned Behavior (TPB) ... 26!
2.2.5.! Technology Acceptance Model (TAM) ... 27!
2.2.5.1.!Perceived Usefulness ... 29!
2.2.5.2.!Perceived Ease of Use ... 29!
2.2.6.! Unified Theory of Acceptance and Use of Technology (UTAUT) 30! 2.2.7.! Personal Innovativeness and TAM ... 32!
2.2.8.! Trust and TAM ... 33!
2.2.9.! Behavioral Intention to Use (BI) ... 34!
2.2.10.!Summary of Hypotheses ... 35!
3.! INDIA ... 37!
3.1.! Country Profile ... 37!
3.1.1.! Indian Culture ... 38!
3.2.! State of the Mobile Industry ... 39!
3.2.1.! Smartphones Market ... 39!
3.2.2.! Mobile Phone Internet Penetration in India ... 39!
6
3.2.4.! Mobile Commerce in India ... 40!
4.! METHODOLOGY ... 42!
4.1.! Research Approach ... 42!
4.2.! Sampling and Data Collection ... 42!
4.3.! Measurement of Constructs ... 43! 4.4.! Sample Adequacy ... 44! 4.5.! Quality Standards ... 45! 4.5.1.! Reliability ... 45! 4.5.2.! Validity ... 46! 5.! DATA ANALYSIS ... 49! 5.1.! Demographics ... 49! 5.2.! Data screening ... 51!
5.3.! Structural Equation Modeling ... 52!
5.3.1.! Measurement Model, CFA ... 52!
5.3.2.! Structural Model, SEM ... 53!
5.3.3.! Results of Hypotheses Tests ... 54!
5.3.4.! Results Graphical Representation ... 56!
5.4.! DISCUSSION ... 57!
5.4.1.! Explaining Behavioral Intention ... 57!
5.4.2.! Explaining Perceived Usefulness ... 59!
5.4.3.! Explaining Perceived Ease of Use ... 60!
5.4.4.! Explaining Trust ... 61!
6.! CONCLUSIONS ... 63!
6.1.! Academic Contributions of the Study ... 64!
6.2.! Practical Implications of the Research ... 64!
6.3.! Limitations and Further Research ... 66!
BIBLIOGRAPHY ... 67!
APPENDIX A ... 80!
Electronic vs. Mobile Commerce ... 80!
APPENDIX B ... 82!
Wallet Payment Ecosystem in India ... 82!
APPENDIX C ... 82!
Questionnaire Format ... 82!
APPENDIX D ... 84!
7
APPENDIX E ... 85!
Confirmatory Factor Analysis, AMOS 23 ... 85!
APPENDIX F ... 86!
Structural Equation Model path diagram and output, AMOS 23 ... 86!
LIST OF ABBREVIATIONS
ATB Attitude Toward Behavior BI Behavioral Intention
CFA Confirmatory Factor Analysis FC Facilitating Conditions
ICT Information and Communication Technology IDT Innovation Diffusion Theory
MC Mobile Commerce
PBC Perceived Behavioral Control PEOU Perceived Ease of Use
PU Perceived Usefulness SEM Structural Equation Model SI Social Influence
SN Social Norm
TAM Technology Acceptance Model TPB Theory of Planned Behavior TRA Theory of Reasoned Action
TRAI Telecom Regulatory Authority of India UTAUT Unified Theory of Acceptance
8
LIST OF TABLES
Table 1 - Theories Applied to Mobile Commerce Adoption and Relevant Variables 21!
Table 2 - Research Model Variables and Related Literature ... 22!
Table 3 - Theoretical Foundations of TAM ... 27!
Table 4 - Summary of Hypotheses: Direct Effects ... 35!
Table 5 – Hypothesized Mediation Effects ... 35!
Table 6 - Measurement of Constructs ... 43!
Table 7 - KMO and Bartlett's Test ... 44!
Table 8 - Reliability of Constructs ... 45!
Table 9 - Factor Loadings ... 46!
Table 10 - Correlation between latent variables ... 51!
Table 11 - Goodness-of-fit measures for CFA ... 53!
Table 12 - Goodness-of-fit measures for SEM ... 53!
Table 13- Results of Hypotheses Test, Direct Effects ... 54!
Table 14 - Mediation Effects ... 55!
Table 15 - Result of Hypotheses Test, Mediated Effects ... 55!
Table 16 - Electronic vs. Mobile Commerce ... 80!
Table 17 - Communalitites ... 84!
9
LIST OF FIGURES
Figure 1 - Structure of the Study ... 16!
Figure 2 - A model of stage in the Innovation-Decision Process, Rogers (1995) ... 24!
Figure 3 - Theory of Reasoned Action, Fishbein & Ajzen (1975) ... 25!
Figure 4 - Theory of Planned Behavior, Ajzen (1985) ... 26!
Figure 5 - Technology Acceptance Model, Davis (1989) ... 28!
Figure 6 - Unified Theory of Acceptance and Use of Tehcnology, Venkatesh et al. ... 30!
Figure 7 - Trust and TAM, Gefen (2003a) ... 33!
Figure 8 - Proposed Model ... 34!
Figure 9 - CAGR Smartphone Shipments, 2013-2017 ... 39!
Figure 10 - Hypothesis Test Results ... 56!
Figure 11 - Confirmatory factor Analysis Output ... 85!
10
ABSTRACT
Nowadays, Mobile Commerce (M-Commerce) is expected to make a substantial impact on the business landscape. In India, the mobile cellular market is the fastest growing telecommunication market in terms of subscribers and popularity and is expected to grow by 55% from its present size of $2 billion to $19 billion by 2019.
This research presents an extended Technology Acceptance model (TAM) that integrates extracts from the Unified Theory of Acceptance and Use of Technology (UTAUT), Personal Innovativeness and Trust into the TAM to investigate what determines user Mobile Commerce (MC) acceptance in India. The proposed model was empirically tested using data collected from a survey of 249 Indian Mobile Commerce users. Confirmatory Factor Analysis (CFA) was performed to examine the reliability and validity of the measurement model and Structural Equation Modeling (SEM) to evaluate the causal model.
The findings demonstrate the applicability of the modified TAM in assessing Mobile Commerce acceptance in India. From the study it can be seen that Mobile Commerce acceptance in India is influenced directly by Perceived Usefulness (β=0.443, p<0.001) Perceived Ease of Use (β=0.442, p<0.001) less so by Social influence (β=0.086, p<0.05) and indirectly by Facilitating Conditions (β= 0.554, p<.001) and Trust (β=0.068, p<0.05).
A Multi-Group analysis based on gender (exogenous) and Frequency of Use (endogenous) was also conducted to gain a better understanding of the underlying Sub-Group dynamics. The recommendations made for the Indian Mobile Commerce sector based on the implications of the research and the typology for future research are also outlined.
11
CHAPTER 1
Introduction
This chapter will be focused on the research approach, the background
and motivations and the research questions leading to this study.
Contributions to research and the thesis structure will also be outlined.
12
1.!OVERVIEW
Mobile Commerce incorporates all e-commerce transactions completed through “hand held” mobile devices and for this reason it has been defined by Hameed et al. (2010) as “doing business in a state of motion”. Thanks to the advancement in cutting edge wireless technology, together with the growing penetration rate of the Internet, Mobile Commerce has been inexorably promoted as a critical application for both consumers and enterprises (Pascoe et al. , 2002; Rupp & Smith, 2002).
The reasons linked to the increasing success of Mobile Commerce in the business arena are not only limited to easier communications and financial transactions (Balasubramanian et al., 2002), but also to the creation of new business scenarios implemented over mobile such as sales-force automation, advertising, inventory management and many other functions that are being released from the limitations of space and time (Scornavacca et al., 2006; Varshney & Vetter, 2002).
This said, Mobile Commerce can be deemed as “the natural successor of Electronic Commerce” (Mahil, 2008; Au & Kauffman, 2006) and ought not to be seen as a constrained form of E-Commerce, but rather a new kind of E-Business with its own characteristic s and novel advantages (Scornavacca et al., 2006). In last two decades both the business community as well as industries around the globe have witnessed major changes induced by the introduction of Mobile Commerce. Considering that in several countries the number of mobile phone subscribers has overcome that of internet users (Xie et al., 2009), M-Commerce is poised to make an impact comparable to, if not greater, than that of E-Commerce. With the hastening of business competition, it is therefore imperative to understand the factors that would entice users to accept and take advantage of M-Commerce services.
By virtue of its lower cost, the higher flexibility and the convenience provided to its users if compared to the traditional wired line, mobile has been chosen by Indians as the primary mean for accessing communications (Singh, 2007). Despite the fact that mobile Commerce in India is still at its embryonic stage (Gupta & Vyas , 2014), this sector, fostered by the booming mobile telephony sector and the declining average selling price for the devices, is intended to grow rapidly in the near future since, as anticipated, India’s mobile cellular market is the fastest growing telecommunication market in terms of subscriber numbers and popularity in the world (TRAI).
13
1.1.!
Background and Motivation
As anticipated, Mobile Commerce defines wireless transactions executed through mobile devices. According to Tsalgatidou & Pitoura (2001), due to its unique characteristics, the limitation to mobile terminals and the dependence upon wireless technology, M-Commerce operates in a partially different domain when compared to E-Commerce as it not only opens up opportunities for business-to-consumer (B2C), but it also uncovers prospects for business-to-business (B2B) commerce to be done more productively through the use of mobile technology.
In a country like India, where the majority of people are first time, mobile-only internet users (60% or of total 354 million internet users in India), M-Commerce seems to be the natural successor of E-Commerce (IAMAI). It is also worth to notice how such numbers increased exponentially in a rather short time span, quadrupling in scale since June 2012.
This said, India’s E-Commerce platforms are rushing to embrace this recent, game-changing innovation, with some forsaking their web platforms entirely to go mobile only like Myntra and India’s E-Commerce giant Flipkart. It is a revolutionary innovation; for the first time Indians are getting connected to the Internet, they are coming upon and getting national and international products and services at very competitive prices right at their doorsteps.
Owning to this remarkable success and the considerable number of business opportunities that opened up in the Indian market, understanding the dynamics that lead to the adoption of M-Commerce in India seems to be a worthwhile topic to study. In line with Giaglis et al. (2002) whom postulated that it is key to comprehend M-Commerce dynamics and value network as such awareness can provide tremendous management insights into developing successful marketing strategies allowing companies to remain competitive and hold their market. Anyhow, if compared to E-Commerce, academic research covering this matter is limited, chiefly in India because M-Commerce is still in an emergent stage.
Hence, the aim of this research is to validate the factors that determine consumer M-Commerce acceptance adopting the Technology Acceptance Model developed by Davis (1989) integrated with Social influence (Venkatesh & Davis, 2000), Facilitating Conditions (Venkatesh, Morris, Davis, & Davi, 2003), Personal Innovativeness (Agarwal & Prasad, 1998) and Trust (Gefen, Karahanna, & Straub, 2003a).
14
1.2.!
Objective of the study
The fundamental aspiration of this research is to identify the factors that predict the intention to use M-Commerce systems in India. An important goal throughout is to provide an empirical basis on which Mobile Commerce services providers can ground their marketing strategy. In this research, factors from various theories are combined in order to develop a model able to:
•! Investigate the adoption and use of Mobile Commerce in India to shed light on the behavioral pattern characterizing this developing country.
•! Elaborate constructs concerning the current state of consumer beliefs and attitudes toward M-Commerce, develop and validate the relationships between the factors that drive the adoption and acceptance of such services.
•! Propose opportunities for both participants and researchers to uncover unseen problems, thereby improving the use and acceptance of M-Commerce in India.
1.3.!
Problem Definition
Although people started experimenting with M-Commerce, some still diher to introduce this new technology in their routine life. This paper aims at evaluating which are the most relevant factors affecting M-Commerce adoption in the Indian scenario. Some issues have already been highlighted by Agarwal & Bhatawal (2015) and grouped accordingly to the analysis that will be carried out in this research.
•! Perceived Usefulness and Perceived Ease of Use o! Lack of Mobile Commerce awareness,
o! Little brand recognition,
o! Cash on delivery preference due to low Credit Card penetration (~0.15%), •! Personal Innovativeness
o! Late adopters bias, •! Trust
o! Research Online and Purchase Offline tendency, o! Security and privacy concerns,
15
o! Insufficient 2G and 3G coverage especially in rural areas, o! Unstable wireless infrastructure due to power outages,
o! Low Internet speed (India ranks 133th in the world with 6.60 Mbps), •! Social Influence
o! Strong influence by family members
1.4.!
Research Questions
The research questions of this study are:
•! What are the factors influencing M-Commerce adoption in India? •! What is the role of Social Influence on M-Commerce adoption in India?
•! What is the role of Personal Innovativeness on M-Commerce adoption in India? •! What is the role of Trust on M-Commerce adoption in India?
•! What is the role of Facilitating Conditions on M-Commerce adoption in India?
1.5.!
Practical and Theoretical Value of the Study
Discerning the factors inhibiting the adoption of Mobile Commerce in India is important for managers, providers and researchers. Some of the practical and theoretical applications of this study can be defined as follows:
1. Mobile Commerce is a rather new technology in India and as such it is worth to study the factors affecting its adoption. Results could be used to improve the way in which Indian local and foreign companies conduct business through this new media, enhancing the quality of the service and foster its future diffusion. Research insights could foster Mobile Commerce operators’ understanding of consumers’ mobile behavioral pattern in India.
2. Undertaking investigation on technology acceptance could enrich the research centers in India, providing insights that may receive wider future recognition.
The battle for customers has never been fiercer than it is today. Therefore, understanding who are their customers and how they behave is critical in order to gain a competitive edge over rivals.
16
1.6.
Structure of the Study
This dissertation is organized into 6 Chapters as shown below.
Ch. 1 • Introduction
Ch.2 •Literature Review
Ch.3 • Country Profile
Ch.4 • Methodology
Ch.5 • Data Analysis & Discussion
Ch.6 • Conclusions
17
CHAPTER 2
Literature Review
Chapter two is structured along several themes. First, the basic aspects
of Mobile Commerce and Mobile Commerce Adoption are explained.
Second, the definition of technology adoption according to various
schools of thought is outlined. Third, the modified TAM model relevant
to this study is introduced. Finally, the research model and hypotheses
are summarized.
18
2.!MOBILE COMMERCE
The unfolding of the Internet, coupled with the progress in information and communication brought forth new ways of conducting business which revolutionized the economic arena, the E-Commerce (Zwass, 2003; Turban, King, Lee, & Viehland, 2004). As a consequence of this, Mobile Commerce materialized allowing for business-to-business (B2B) and business-to-consumer (B2C) transactions without constraints of time and place. Wu and Wang (2005) defined Mobile Commerce as “any transaction, either direct or indirect, with monetary value implemented via a wireless telecommunication network”, with or without an intermediary (Mallat et al., 2004).
If used wisely, M-Commerce technologies can enhance business automation mechanisms by means of reduced operational costs, greater efficiency and improved decision making leading to a higher degree of productivity and customer satisfaction (Lee & Park, 2008). In the same way, M-Commerce notably boost user efficiency as mobile users are able to gain access to information, communicate and purchase anywhere, at any time.
For these reasons, M-Commerce has been adopted by countless companies in developed countries as it provides grounds for major innovations while inducing a number of opportunities for organizations (Steendern, 2002; Snowden al., 2006; Chong Chang & Ooi, 2011) to engender or sustain their competitive advantage (Daniel & Grimshaw , 2002). Henceforth, as companies consistently strive to create better products and services for their customers, M-Commerce progressively grows to become an indispensable part of firm’s business strategies to effectively complement other business channels (Martin, 2012; Heng-Sheng & Gururajan, 2005; Ling, 2001; Whiteley, 1998; Longenecker et al., 1997).
According to Shankar et al. (2010) M-Commerce is creating a shift in the sales paradigm where consumers are not required to enter the company’s sales environment anymore as the seller itself is able to directly influence the consumer’ behavior through mobile. In this regard, Chaffey (2009) discussed five advantages that M-Commerce provides to its users: (1) Ubiquity, (2) Reachability, (3) Convenience, (4) Security and (5) Instant access. See Appendix A for basic differences between E & M Commerce and Chaffey’s Mobile-Commerce advantages definitions.
With respect to previous literature, several researchers studied antecedents and determinants for M-Commerce (Langendoerfer, 2002; Martin, 2012; Jaradat & Rababaa, 2013). According to a study of the factors affecting mobile shopping by Lu
19
and Su (2006), the primary obstacles experienced by the user when interfacing with mobile are poor connectivity and the limited functionality of the device which leads to users feeling stress and uncertainty towards conducting mobile transactions. In line with Lu and Su’s findings, the low network speed of service and the confined screen size of mobile devices was found by Carlsson and Walden (2002) to be the main deterrent to mobile commerce adoption. Mobile terminals restrictions were deemed to be the cause of the fragmentary and inadequate information received by M-Commerce users (Wu and Wang ,2005) whereas Langendoerfer (2002) hypothesized psychological factors i.e. trust and privacy rather than technological ones to be the main barrier to effective M-Commerce adoption.
To conclude, even though M-Commerce is a burgeoning business model in developing countries, academic and business research highlighted some of the determinants that are likely to influence the diffusion of Mobile Commerce in the market. “The M-Commerce wave is quickly catching on in other markets across the region (Asia-Pacfic), and will play a key role in shaping the future of retail in Asia” (Nielsen, 2013). Mobile Commerce is meant to have a prosperous future.
20
2.1.!
Mobile Commerce Adoption
According to Qingfei et al. (2008), user acceptance is one of the key fundamentals for the development and success of new technologies. Once acceptance is achieved, marketers can effortlessly access real time information and develop new business opportunities. Nonetheless, M-Commerce adoption has to be treated differently if compared to general technology acceptance decisions since M-Commerce users are not only choosing whether to adopt or reject a technology per se, but a new way of doing business. Moreover, because said decisions integrate both transactional and non-transactional dimensions, consumers’ intentions should be regarded as multi-dimensional (Pavlou, 2002).
The pioneers in Mobile Commerce review were Scornavacca, Barness and Huff (2006). An analytical framework based on reviews of technological application articles was developed by Ngai and Gunasekaran (2007) and later applied to review papers on M-Commerce trends (Park & Saplan, 2011; Kourouthanassis & Giaglis, 2012).
With respect to country specific cases, a study conducted by Malik et al. (2013) revealed that M-Commerce acceptance in India is positively affected by perceived usefulness and ease of and negatively influence by perceived financial risk. An analysis similar to the one proposed in this study based on the Technology Acceptance Model in India was performed by Thakur & Srivastava (2013). In line with Malik et al. they found that perceived usefulness, perceived ease of use together with social influence significantly impacted M-Commerce adoption whereas perceived risk and security issues had the opposite effect.
The phenomenon of mobile Internet acceptance was also studied in Korea by Je and Myeong-Cheol (2005) whom developed an extended version of the original TAM as it will be done in this paper to better reflect the country’s peculiar context. With respect to China, Park et al. (2007) found performance expectancy, effort expectancy, social influence, and facilitating condition as major factors influencing the adoption of M-Commerce. “Good pricing”, “Quality of Service” and “Ubiquity” of M-Commerce were instead identified by Kini and Bandyopadhyay (2006) as the main drivers of M-Commerce acceptance in Thailand.
Demographical factors such as gender, age and education level were instead investigated by Alkhunaizan and Love (2013) in Saudi Arabia. The findings indicated
21
that gender and education level did not impact actual use unlike age, which was statistically significant in contrast with Park et al. (2007).
With respect to the European setting, Vrechopoulos et al. (2002) found significant differences in M-Commerce adoption rates among consumers in Finland, Germany and Greece. High adopting rates were associated to better devices quality, security, coverage and speed, user friendly interfaces and more useful applications.
Taking clues from all previous studies, this paper aims at creating a theoretical base for the study of Mobile Commerce adoption with reference to Indian consumers. To summarize, Table 1 shows the principal theories applied to Mobile Commerce adoption and respective variables of interest.
Table 1 - Theories Applied to Mobile Commerce Adoption and Relevant Variables
Table 2 instead shows the factors relevant for this study in explaining Mobile Commerce Adoption and related theoretical framework.
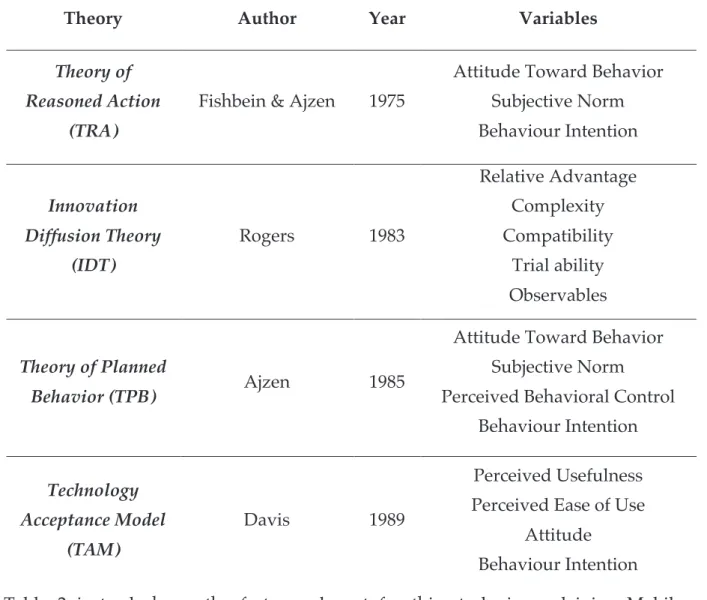
Theory Author Year Variables
Theory of Reasoned Action
(TRA)
Fishbein & Ajzen 1975
Attitude Toward Behavior Subjective Norm Behaviour Intention Innovation Diffusion Theory (IDT) Rogers 1983 Relative Advantage Complexity Compatibility Trial ability Observables Theory of Planned Behavior (TPB) Ajzen 1985
Attitude Toward Behavior Subjective Norm
Perceived Behavioral Control Behaviour Intention Technology Acceptance Model (TAM) Davis 1989 Perceived Usefulness Perceived Ease of Use
Attitude Behaviour Intention
22
Table 2 - Research Model Variables and Related Literature
2.2.!
Theoretical Framework and Hypothesis
2.2.1.!
Consumer Behavior
Variable Definition Reference
Perceived Usefulness
The extent to which a person believes that using a particular application would enhance
his or her performance
Davis et al. (1989) Perceived Ease of
Use
The extent to which a person believes that using a particular application would be free of
effort Behavioral
Intention
The user’s likelihood to engage in online transactions via Mobile Commerce
Personal Innovativeness
Individual’s willingness to try out any new technology Agarwal & Prasad (1998) Social Norms, Influences
Person’s perception that people who are important to him/her think he/she should
perform the behavior in question
Venkatesh & Davis (2000)
Facilitating Conditions
Extent and type of support provided that influences the use of the technology
Venkatesh et al. (2003)
Trust
Trustworthiness of the wireless mobile environment
Gefen (2003)
23
Consumer buying behavior is studied as a part of marketing and its main objective is that of understanding the way in which individuals, groups or organizations behave in the marketplace when purchasing a product or services (Kotler & Kelle, 2015). Tough it may sound straightforward and comprehensible, said needs can vary tremendously as they depend both internal i.e. age, psychology, personality and external factors acting beyond the consumers’ control.
Considerable research has been conducted by academics and researchers to identify those factors influencing consumer’s buying behavior and several elements have been determined. Wiedermann et al. (2007) classified them into external and internal factors, Winer (2009) grouped them into social, psychological and personal factors however, the various categorizations brought about similar outcomes in purpose and scope (Rao K. , 2011).
It has to be noted how these aspects are generally beyond the bounds of marketers yet, they have to be taken into consideration when trying to untangle the complex behavior of the consumers. For this reason, the study of consumer behavior is defined as the scrutiny of the processes involved when individuals or groups “select, purchase, use, or dispose of products, services, ideas, or experiences to satisfy needs and desires” (Solomon, 2014). Or, similarly “those acts of individuals directly involved in obtaining, using and disposing of economic goods and services, including the decision processes that precede and determine these acts” (Lancaster et al., 2010).
Because simple observation has limited power in providing a detailed understanding of the intricate nature of consumer choice, researchers have progressively looked for more refined concepts and tactics provided by behavioral sciences to discern, predict and conceivably control consumer behavior in a more efficient manner.
24
2.2.2.
Consumer Adoption
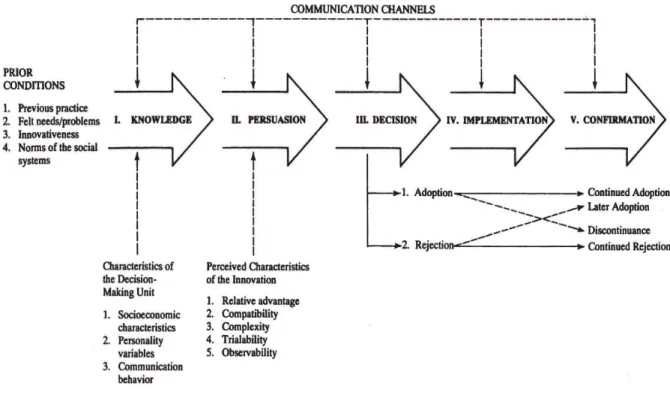
The “acceptance and continued use of a product, service or idea” has been defined by Sathye (1999) as the process identifying consumer adoption. According to Rogers and Shoemaker (1971), before being ready to embrace a product or service, consumers go through five steps as shown in Figure 2.
The first stage is about creating awareness of the product in the market, the second is to stimulate interest towards the product, the third is related to product comparison and evaluation, the fourth about product trial and the last, of course, about product adoption. Moreover, in his research, Rogers identified five attributes affecting the rate of technological adoption: (1) Relative Advantage, (2) Compatibility, (3) Complexity, (4) Trialability, (5) Observability. However, a study by Chen et al. (2000) found that only relative advantage, compatibility and complexity are persistently related to innovation adoption.
25
2.2.3.
Theory of Reasoned Action (TRA)
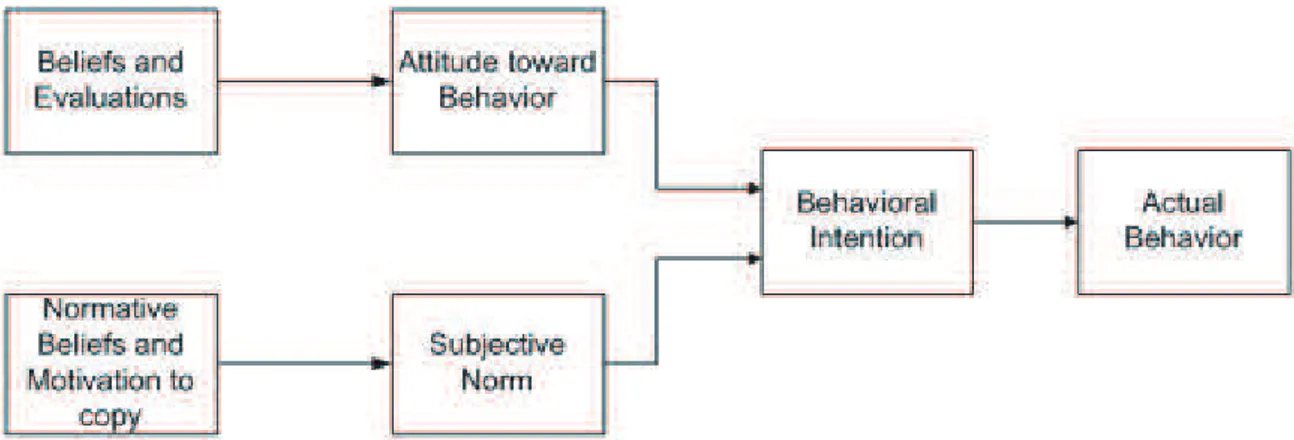
The Theory of Reasoned Action is an extensively studied persuasion model from social psychology used to anticipate individuals’ behavior in relation to pre-existing attitudes and beliefs (Fishbein & Ajzen, 1980; 1975). Expectancy value models provide groundwork for understanding the relationship between a person's attitudes and their elemental beliefs. Expectations about the consequences of an action are defined as “Outcome Expectancy” whereas the intrinsic value associated to that outcome is known as “Outcome Value” (Ajzen & Fishbein, 1980; Eagly & Chaiken, 1993; McGuire, 1985); algebraically !""#"$%& ' ()*&+",-+./)/0,1$&. The higher the outcome value
associated to a given behavior, the higher the motivation to perform said behavior. Figure 1 is a schematic representation of the relationships among constructs in TRA. In the hypothesized model of TRA, Behavioral intention (BI), the motive to perform a given demeanor, is simultaneously determined by the individual's Attitude Toward performing the Behavior (ATB) and Subjective Norm (SN), which is the overall perception of what relevant others think the individual should or should not do. By all means, the importance of ATB and SN to predict BI will vary by behavioral domain. This model has been successfully applied to a large number of situations to predict the performance of behavior and intentions proving its robustness across settings.
26
2.2.4.
Theory of Planned Behavior (TPB)
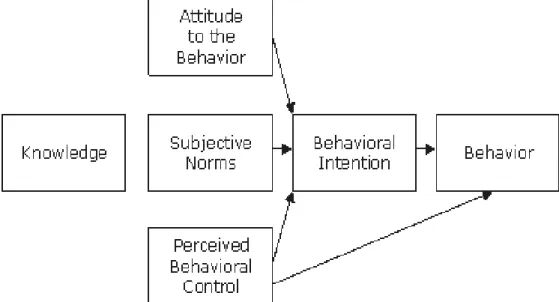
In spite of the reported consistency of the TRA, the model becomes problematic if the behavior under study is not under full volitional control. Two major issues with TRA were brought up by Sheppard et al. (1988). First, TRA requires the researcher to be abele to discern the tricky difference between behavior and intention and secondly, whether failing to perform is due to failures in one’s behavior or one’s intention.
For these reasons, in his Theory of Planned Behavior, Ajzen (1985) included an additional determinant of Behavioral Intention called Perceived Behavioral Control (PBC) and defined as “people’s perception of the ease or difficulty in performing the behavior of interest”. In addition, as Figure 2 shows, TPB broadens TRA’s boundaries by elaborating two additional constructs: (1) Attitude toward Behavior (ATB), defined as a person’s mindset over a certain behavior and (2) Subjective Norm (SN), the perceived social pressure which leads to perform a certain behavior (Ajzen & Fishbein, 1980).
As with TRA, the relative significance of BI predictors varies with the behavioral domain. Similarly, the capacity of PBC and BI to predict AB will also vary across conditions. To conclude, TPB has been prosperously applied to various circumstances in predicting behaviors and intentions’ performance. The general conclusion was that TPB proved to be more efficient in predicting behavior if compared to TRA.
27
2.2.5.!
Technology Acceptance Model (TAM)
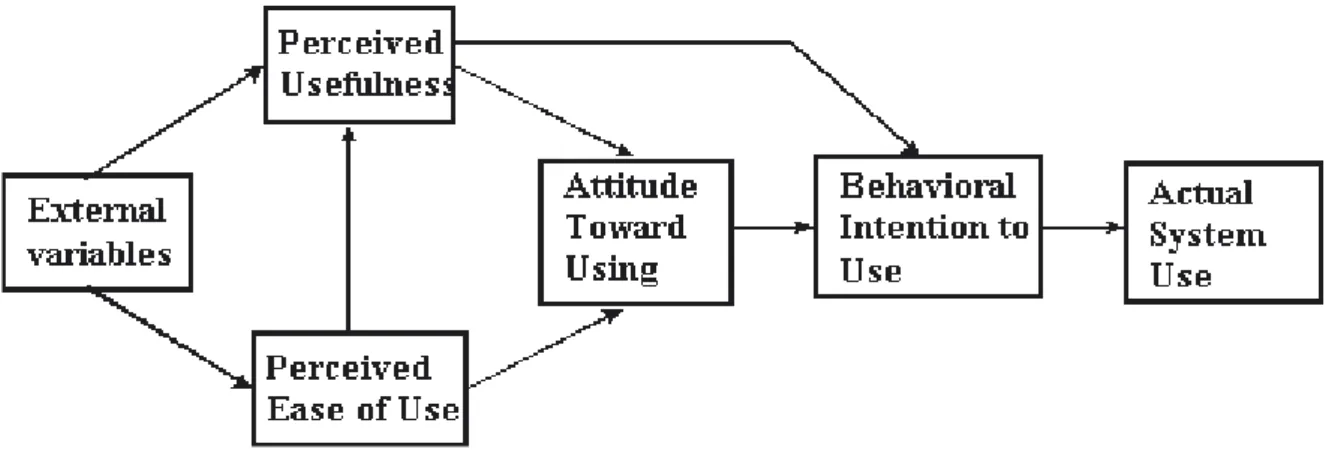
The Technology acceptance model (TAM) (Davis, 1989) received upscale empirical support throughout the years and is considered as one of the most influential theories in the field of information systems (Lee et al., 2003). In his study, Davis (1989) identifies two important concepts: perceived usefulness (PU) and perceived ease of use (PEOU) as determinants of Behavioral Intention. Perceived usefulness represents the subjective belief of how much the usage of certain application will increase one’s performance whereas Perceived Ease of Use identifies one’s expectations of how easy the application is to use.
TAM is based on the theory of reasoned action (Fishbein & Ajzen, 1975) and has been influenced by at least five Management Information System (MIS) studies and few non-MIS ones. With reference to these theories, the underlying factors resulting in high technology acceptance rate were elaborated, revised and simplified. The five ground theories and the marketing study by Hauser and Simmie (1981) are briefly presented in Table 1 to provide a basic theoretical understanding of the model’s fundamentals.
Table 3 - Theoretical Foundations of TAM
Theory Fundamentals
Self-Efficacy
(Bandura, 1982)
Self-efficacy, which is similar to PEOU, is the extent to which individuals believe in their own ability to complete tasks and fulfill goals.
Cost-benefit paradigm from behavioral decision
theory
(Beach & Mitchell, 1978)
CBP explains people’s choice in terms of cognitive trade-off between the effort and the quality of the resulting strategic decision.
Adoption of innovations
(Tornatzky & Klein, 1982)
Like TAM, it advocates for a prominent role of PEOU in shaping adoption of innovations, as it proved to have the most significant link.
28
Evaluation of information Reports
(Larcker & Lessig, 1980)
Echoes the distinction between usefulness and ease of use.
Channel disposition model
(Swanson, 1982)
Explains the choice and use of information reports. Based on the tradeoff between attributed information quality and attributed access quality, potential users choose and use information reports.
Non-MIS studies Marketing study by Hauser and Simmie (1981) examined use perceptions of alternative communication technologies similarly derived two underlying dimensions: ease of use and effectiveness. In short, the model clarifies how the user’s intention to use a technological solution is determined by certain factors which, in turn, lead to the actual usage behavior i.e. acceptance or dismissal of the application. The aim being that of providing a general framework to exemplify the antecedents of computer acceptance while explaining user behavior over an extensive variety of end-user computing technologies and populations. According to Chooprayoon et al. (2007), the primary goal of TAM is to introduce an innovative way to “study the effects of external variables towards people’s internal beliefs, attitudes and intentions”. As anticipated, TAM relies on two main constructs: Perceived Usefulness (PU) and Perceived Ease of Use (PEOU) as shown in Figure 5 and defined in the next section.
29
2.2.5.1.!Perceived Usefulness
Davis (1989) defined Perceived Usefulness (PU) as “the extent to which an individual believes that he or she would benefit from using a given technology”. It has been found that perceived usefulness is generally regarded as the benchmark for the evaluation of the consequences of one’s actions (Kim et al., 2009) ans, as a consequence, will most likely influence the intention to adopt a given system (Bhatti, 2007). In the context of M-Commerce, people might use it to save time and money. Benefits are also observed by users in the form of increased product variety by online suppliers. This leads to our first hypothesis:
Hypothesis 1 (H1): “Perceived Usefulness has a positive and significant effect on Behavioral
Intention to Use Mobile Commerce.”
2.2.5.2.!Perceived Ease of Use
Refers to the “degree to which a prospective user believes that using a particular system would be free of effort” (Davis, 1989). Because effort is a scarce resource that can be allocated to the various activities, ceteris paribus, the likelihood that a technology will be accepted by users increases as the perceived easiness of use increase (Venkatesh and Morris, 2000).
Previous studies have shown that perceived ease of use (PEOU) has a significant effect on usage intention, either directly or indirectly through its effect on perceived usefulness (Davis, 1989; Venkatesh, 2000; Venkatesh and Davis, 1996). In the context of M-Commerce, information such as details of products or services, their benefits, and usage guidelines needs to be provided in order to make it easier for consumers to adopt said technology. This leads to the second and third hypothesis:
Hypothesis 2 (H2): “Perceived Ease of Use has a positive and significant effect on Perceived
Usefulness.”
Hypothesis 3 (H3): “Perceived Ease of Use has a positive and significant effect on
30
2.2.6.!
Unified Theory of Acceptance and Use of
Technology (UTAUT)
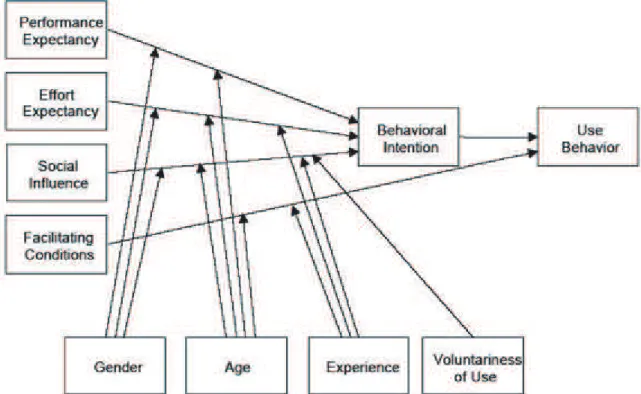
Because productivity gain can occur exclusively if a certain technology is accepted and used by target users, Venkatesh (1998; 2003) developed and refined the Unified Theory of Accetance of Technology, an enhancement of Davis’ TAM introduced in the previous section. As shown in Figure 6, UTAUT consists of four core determinants of intention and usage: (1) Performance Expectancy, (2) Effort Expectancy, (3) Social Influence and (4) Facilitating Conditions and also of four moderators of key relationships: Gender, Age, Experience and Voluntariness (Venkatesh et al. 2003, 447).
The core constructs represent the key factors, which directly influence behavioral intention whereas moderators are factors which reinforce or weaken the influence of the key factors on Behavioral Intention and Use Behavior.
Next, the factors of the UTAUT model relevant for this study (Social influence, and Facilitating conditions) will be discussed.
31
2.2.6.1.! Social Influence
Venkatesh et al. (2003) defined Social Influence (SI) as “the degree to which an individual perceives that important others believe he or she should use the new system.”. This construct was incorporated in several e-commerce studies finding a discrete degree of empirical support (Hsu & Chiu, 2004; Lewis et al., 2003; Lu et al., 2003; Venkatesh et al., 2003). In particular, Chin et al. (2009) focused on two prominent components affecting willingness to purchase online (1) trust in the Internet structure and (2) susceptibility to social influence. The hypothesis that trust and social influence are significantly correlated to consumer intention to purchase online is backed by the findings, in line with Lee & Turban (2001) and George (2002; 2004). This leads to the fourth and fifth hypothesis:
Hypothesis 4 (H4): “Social Influence has a positive and significant effect on Perceived
Usefulness.”
Hypothesis 5 (H5): “Social Influence has a positive and significant effect on Behavioral
Intention to Use.”
2.2.6.2.! Facilitating Conditions
Facilitating conditions (FC) is defined by Venkatesh et al. (2003) as the “degree to which an individual believes that an organizational and technical infrastructure exists to support use of the system”. It mirrors the consciousness of external constraints on behavior that encompass resource and technology facilitating conditions (Ajzen, 1991; Taylor & Todd, 1995a; 1995b). The study by Gu et al. (2009) proved that Facilitating Conditions directly affect the perceived Ease of Use of a given technology, which leads us to the sixth hypothesis:
Hypothesis 6 (H6): “Facilitating Conditions have a positive and significant effect on
32
2.2.7.!
Personal Innovativeness and TAM
Derived from IDT and TAM, perceived innovativeness (PI) has been proposed by Agarwal & Prasad (1998) and is defined as the willingness of an individual to try out any new information systems. Behavioral scientists assert that psychological traits such as personal innovativeness, significantly influence technology adoption given that individuals with a higher degree of personal innovativeness are more likely to take risks as they are generally more open to new ideas and experiences (Agarwal & Karahanna, 2000; Compeaue et al., 1999; Eastlick & Lotz, 1999; Jackson et al., 1997).
Although a number of empirical studies acknowledged the impact of personal innovativeness (PI) on different technologies (Agarwal & Karahanna, 2000; Lewis et al., 2003; Hung & Chang, 2005; Lu et al., 2005; Lassar et al., 2005; Yiet al., 2006; Lian & Lin, 2008), relatively few studies have been carried out regarding the potential effects on Mobile Commerce. Considering that personal innovativeness alters individuals beliefs about new technologies as well as the perception of their capabilities (Thatcher & Perrewé, 2002), it is expected to have a positive effect on the adoption of Mobile Commerce (Bhatti, 2007; Li, Liu, & Ren, 2007). And because it has been found that the formation of a favorable attitude towards mobile services is associated to the individual’s creative propensity (Agarwal & Prasad, 1998; Pagani, 2004; Bauer et al., 2005; Rao & Troshani, 2007) this study will investigate for the first time the effects of Personal Innovativeness on Trust and the potential indirect effect on Behavioral Intention to use Mobile Commerce. Hence the seventh hypothesis:
33
2.2.8.!
Trust and TAM
Trust is a convoluted construct that has been defined from different perspectives and by various disciplines. Due to the uncertain environment characterizing the M-Commerce environment, Trust is deemed to be an important “ingredient” affecting technology adoption (Holsapple and Sasidharan, 2005). As indicated by Lu (2003), M-Commerce is associated to a higher degree of insecurity if compared to traditional E-Commerce, fact that corroborates the relevance of Trust in this context.
The relationship between Trust and TAM have been broadly discussed in literature with reference to the online business environment (Gefen et al, 2003a, b; Pavlou, 2003; Saeed et al., 2003; Gefen, 2004); noteworthy is the study by Gefen et al. (2003a). As can be seen in Figure 7, the above mentioned model explicitly indicates their relationship of trust as an antecedent of PU and directly affecting Intended Use.
Trust is one of the determinants of PU, specifically in an online environment, because a portion of the expected usefulness derived from web interactions is intrinsically determined by the sellers behind the web site. In short, if consumers trust their e-vendors, they will believe the online service is useful (Gefen et al., 2003a). This leads to the eight and last hypothesis:
Hypothesis 8 (H8): “Trust has a positive and significant effect on Perceived Usefulness”
34
2.2.9.
Behavioral Intention to Use (BI)
Davis et al. (1989) defined BI as “the degree to which a person has formulated conscious plans to perform or not perform some specified future behavior.”. According to TAM, BI is directly and positively affected by PU, indirectly affected by PEOU and directly influencing the individual’s Actual Use. Since the introduction of TAM by Davis in 1989, researchers tested this model into several research streams. Some focused on establishing the roots cause of perceived ease of use and perceived usefulness (Karahanna & Straub, 1999; Koufaris, 2003; Wixom & Todd, 2005). In this research the direct effects of Perceived Usefulness, Perceived Ease of Use, Social Influence and the indirect, mediated effects of Facilitating Conditions, Trust and Personal Innovativeness on Behavioral intention will be tested. Below the proposed model and hypothesized relationship are reported.
35
2.2.10.!
Summary of Hypotheses
Table 4 - Summary of Hypotheses: Direct EffectsH1 “Perceived Usefulness has a positive and significant effect on Behavioral Intention to Use M-Commerce.”
PU ! BI
H2 “Perceived Ease of Use has a positive and significant effect on Perceived Usefulness.”
PEOU ! PU
H3 “Perceived Ease of Use has a positive and significant effect on Behavioral Intention to Use.”
PEOU ! BI
H4 “Social Influence has a positive and significant effect on Perceived Usefulness.”
SI ! PU
H5 “Social Influence has a positive and significant effect on Behavioral Intention to Use.”
SI ! BI
H6 “Facilitating Conditions have a positive and significant effect on Perceived Ease of Use:”
FC ! PEOU
H7 “Personal Innovativeness has a positive and significant effect on Trust.”
PI ! TT
H8 “Trust has a positive and significant effect on Perceived Usefulness.”
TT ! PU
Table 5 – Hypothesized Mediation Effects
H9 “Perceived Usefulness mediates the effect of Perceived Ease of Use on Behavioral Intention”
PEOU ! (PU) ! BI H10 “Perceived Usefulness mediates the effect of Social
influence on Behavioral Intention”
SI ! (PU) ! BI H11 “Perceived Usefulness mediates the effect of Trust
on Behavioral Intention”
FC ! (PEOU) ! BI H12 “Perceived Ease of Use mediates the effect of
Facilitating Conditions on Behavioral Intention”
36
CHAPTER 3
India
This chapter features a brief description of of the world’s largest
democracy’s geography, demography and key economic facts relevant
to this study.
37
3.!INDIA
3.1.!
Country Profile
India, officially the Republic of India Bhārat Gaṇarājya (Clémentin-Ojha, 2014), is located in South Asia and evolved from Indus Valley Civilization, one of the oldest in the World. With its 1,27 billion people, it is second most populated country and the world’s biggest democracy. It is a federal constitutional republic governed under a parliamentary system consisting of 29 states and 7 union territories.
India’s currency is the Indian Rupee (INR), which is equivalent to USD 0.15 or USD 1 equals 67 Indian Rupees. According to the International Monetary Fund (IMF), as of October 2015, the Indian economy is nominally worth USD 2.182 trillion. It is the 7th-largest economy by market exchange rates, and is, at USD 8.027 trillion, the third-largest by purchasing power parity, or PPP. The Indian economy is expected to grow at 7.5 % in 2015-16, followed by further acceleration to 7.9 %in 2016-17 and 8 % in 2017 (World Bank). The 492.4 million worker Indian labour force is the world's second-largest, as of 2014, following China.
Against this background, India is one of the world's fastest-growing economies and one of the most significant achievements of our times. After barely six and half decades since independence, the country has accomplished some remarkable revolutions: life expectancy has more than doubled, literacy rates have quadrupled, health conditions have improved, and a sizeable middle class has emerged. Today, India hosts numerous globally recognized companies in sectors ranging from pharmaceuticals to IT and space technologies, and is proving to be growing voice on the international stage.
With more than 50% of population below the age of 25 and over 65% below the age of 35, India now has that rare window of opportunity to improve the quality of life for its citizens and lay the foundations for a truly prosperous future that will impact the country and its people for generations to come.
38
3.1.1.!
Indian Culture
Hofstede defines culture as “the collective programming of the mind that distinguishes the
members of one group or category of people from another”. Therefore, culture reflects how people think and solve every-day struggles (Kumar & Sethi, 2005). Four dimensions were specified by Hofstede to explain countries’ cultural differences:
1.! Individualism-Collectivism: the role of an individual and the group in a society; 2.! Power Distance: the degree of unequally distributed power in a society;
3.! Uncertainty Avoidance; 4.! Masculine-Feminism.
While India has traditionally been portrayed as a collectivistic society (Neelankavil et al., 2000; Nelson & Devanathan, 2006), coexistence of individualism and collectivism in India is well evidenced in research literature (Hofstede, 2001; Kumar & Sethi, 2005). Some scholars reported that Indians tend to behave in an individualistic fashion when they interact with non-family members. This could be justified by the high power distance, which implies expected dependence and paternalism, reported by Hofstede with reference to the Indian context.
On the Uncertainty avoidance dimension, India scores low, meaning that Indians feel less threatened by uncertain or unknown situations, which is pragmatically evidenced by a favorable disposition towards products and services coming from different countries and characterized by different cultures (Kumar & Sethi, 2005).
Lastly, India retains the masculine dimension, suggesting the preponderance of assertiveness and the abhorrence of failures in favor of achievements (Kumar & Sethi, 2005). To summarize, India has a coexistence of individualism and collectivism, high power distance, weak uncertainty avoidance, and the masculine dimension.
39
3.2.!
State of the Mobile Industry
3.2.1.!
Smartphones Market
The ever increasing need for consumers to take on the Internet through their mobile devices and the former’s rapidly declining average selling price have been the key drivers of smartphones uptake in India. Smartphones have become the device of choice for Indians as smartphones shipment grew about 80% Y-o-Y in 2014 to reach 79 million units with sales expected to keep on their growth trajectory at a projected CAGR of 53.8% in the period 2013-2017. As highlighted in Figure 10 highlight India witnessed a much higher smartphone’s shipments growth if compared to other developed and developing markets.
With 122 million smartphone users in 2014, India is the third largest smartphone market in the world after China and U.S. Although the overall smartphone user base is high, the smartphone penetration is low (~17 per cent) in the country, which implies good margins for future growth (KPMG & IAMAI, 2015).
3.2.2.!
Mobile Phone Internet Penetration in India
In India, the number of people who own mobile phones is greater than the number of people who own desktops or personal computers. More than 50 per cent of Internet users are mobile-only Internet users (Avendus, 2013). The number is growing continuously; it accounted for approximately 159 million in 2014 and is expected to reach 314 million by end of year 2017 registering a CAGR of 27.8 per cent for the period 2013-2017 (IAMAI & IMRB, 2014).
40
3.2.3.!
Mobile Payments
The rapid expansion in the urban population, the heightened popularity of online shopping and the increased acceptance of cards by organised retailers were among the most important driver of the growth in plastic money in 2015. The majority of cashless payments came from retail electronic clearing ≈71%, whereas prepaid instruments contributed to not even 1% of the total. Customers and merchants are holding two poles of the ecosystem, while different players are attempting a ‘land-grab’ in different areas to ensure they’re not marginalized as the sector continues its rapid development. See Appendix B for Indian Mobile Wallet Ecosystem.
3.2.4.!
Mobile Commerce in India
India has the third largest Internet user base in the world and in 2014 the country topped as fastest growing smartphone market in the world. According to the Indian telecom regulator TRAI, in the first half of 2015 the number of mobile phone subscribers in India reached 980.81 million users, recording a 6.71% YoY compared to the same duration last year. As anticipated, the number of Mobile Internet users is expected to reach 314 million by end of 2017 (IAMAI) whereas the number of 3G subscribers is projected to 284 million by the end of 2017 from 100 million in 2015. Further, 4G user base is expected to grow at an annual growth rate of 344 % and a CAGR of 103% from 2013 to 2018 (Cisco VNI report 2014).
According to PayPal mobile commerce transactions increased by over 250% in 2014 compared with the last financial yearn as major E-Tail companies in India are promoting M-Commerce by offering special discounts on purchases made from their mobile apps. Indeed, more than 50 % of E-Tailers’ online orders come from mobile handsets only. Modern retail, with a penetration of only 5%, is expected to grow about six times from the current 27 billion USD to 220 billion USD, across all categories and segments (India Vision 2020).
Analysts expect the M-Commerce market in India to grow at a CAGR of approximately 71% over the period 2012-16, with forecasted USD 1.26 billion revenues for the network-based segment of M-Commerce applications i.e. ticketing, utility payments, recharge and travel. Shopping for products via mobile or M-Tailing is catching on and is soon expected to become a conventional channel for retailers considering that more than 25% of all online retail transactions are forecasted to happen in the mobile paradigm by 2017 (eMarketer).
41
CHAPTER 4
Methodology
This chapter discusses the research methodology of the dissertation. It
outlines research strategy and sampling methods and presents validity
and reliability of measurements used in this research.
42
4.!METHODOLOGY
4.1.!
Research Approach
In order to assess Indian respondents’ attitudes and their intention to use M-Commerce technology, a survey elaborated on Qualtrics was administered online. On the basis of literature review, the questionnaire for the study was designed and pilot testing was done with a sample of 10 selected individuals. Few modifications in terminology of statements and clarity were carried out after pilot survey; a brief description of M-Commerce was provided for respondents to be informed about the concept of interest.
A total of 7 constructs were tailored to M-Commerce from prior studies, many of which had already established reliability and validity namely Perceived Usefulness (PU), Perceived Ease of Use (PEOU), Social Influence (SI), Trust (TT), Personal Innovativeness (PI), Facilitating Conditions (FC), Behavioral Intention (BI) and Frequency of Use. All items were measured on a Likert scale ranging from 1 (Strongly Disagree) to 7 (Strongly Agree). Frequency of Use was tested on a scale ranging from 1 (Extremely Infrequent) to 7 (Extremely Frequent). See Appendix C for Questionnaire Format. The questionnaire was divided into three sections: (1) demographic details, (2) smartphone type and usage and (3) questions related to the above mentioned constructs.
A total of 379 responses were recorded; 130 were discarded because of incompleteness for a final dataset of 249 complete responses of which 67% males (167) and 33% females (82). Data was analysed with SPSS 23.0 and AMOS 23.0.
4.2.!
Sampling and Data Collection
Due to time and resources constraints, non-probability sampling was adopted for this study, in particular snowball sampling. Snowball sampling uses a small pool of initial informants to nominate, through their social networks, other participants who meet the eligibility criteria in order to contribute to a specific study. The sample for this research was selected from middle-class generally educated Indian citizens whom owned a Mobile Device to conduct Mobile Commerce transactions. The survey was launched on the 17th of November 2015 and closed on December 11th 2015.
43
4.3.!
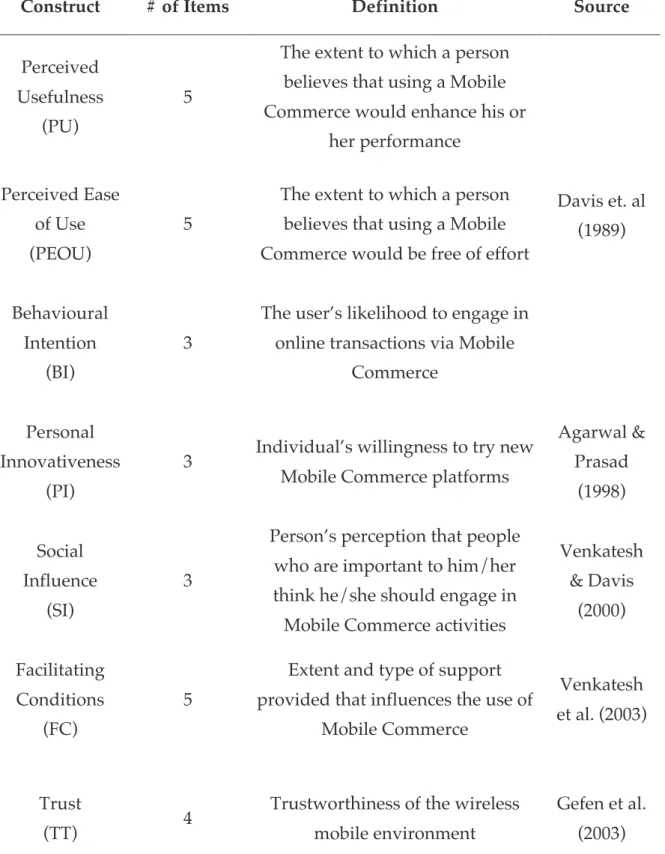
Measurement of Constructs
Table 6 - Measurement of ConstructsSee Appendix C for Questionnaire Format i.e. Constructs’ items
Construct # of Items Definition Source
Perceived Usefulness
(PU)
5
The extent to which a person believes that using a Mobile Commerce would enhance his or
her performance Davis et. al (1989) Perceived Ease of Use (PEOU) 5
The extent to which a person believes that using a Mobile Commerce would be free of effort Behavioural
Intention (BI)
3
The user’s likelihood to engage in online transactions via Mobile
Commerce Personal
Innovativeness (PI)
3 Individual’s willingness to try new Mobile Commerce platforms
Agarwal & Prasad (1998) Social Influence (SI) 3
Person’s perception that people who are important to him/her think he/she should engage in Mobile Commerce activities
Venkatesh & Davis (2000) Facilitating Conditions (FC) 5
Extent and type of support provided that influences the use of
Mobile Commerce
Venkatesh et al. (2003)
Trust
(TT) 4
Trustworthiness of the wireless mobile environment
Gefen et al. (2003)
44
4.4.!
Sample Adequacy
To begin with, missing data and unengaged responses i.e. those exhibiting biased repeating or random patterns were identified and removed from the dataset. Then, sample adequacy had to be evaluated in order to evaluate Factor Analysis appropriateness.
In most academic and business studies, Kaiser-Meyer-Olkin Measure of Sampling Adequacy & Bartlett’s test play an important role in adequacy testing. KMO tests whether the partial correlations among variables are small and ranges from 0 to 1; the world-over accepted index is over 0.6. Bartlett’s Test of Sphericity shows the validity and suitability of the responses collected to the problem being addressed through the study and should be less than 0.05.
As can we see from the table below, the sample passes both tests with a KMO value of 0.944 and a p value < 0.001 for the Bartlett’s test, implying significance and providing grounds to reject the null hypothesis “H0: The correlation matrix is an identity
matrix i.e. a matrix in which all of the diagonal elements are 1 and all off diagonal elements are 0”.
Table 7 - KMO and Bartlett's Test
In addition, MacCallum et al. (1999, 2001) advocates that, to justify Factor analysis with smaller samples, all items in a factor model should have communalities i.e. the extent to which an item correlates with all other items, of over 0.60 or an average communality of 0.7. As shown in the communalities table in Appendix D, all communalities are above the cutoff point ranging from 0.706 to 0.854 with a satisfactory average communality of 0.77.
Kaiser-Meyer-Olkin Measure of Sampling Adequacy. .943
Bartlett's Test of
Approx. Chi-Square Sphericity 5652.634
Degrees of freedom 378
45
4.5.!
Quality Standards
In order to reduce results bias, attention must be paid to: Reliability and Validity (Saunders & Thornhill, 2003).
4.5.1.!
Reliability
Reliability defines the degree to which measurements are free from error and, thence, yield dependable results. Practically, reliability is defined as the internal consistency of a scale, which assesses the degree to which the items are homogeneous. In this study, the reliability of the constructs was tested through Cronbach’s alpha, which measures how closely related a set of items are as a group.
Higher values of alpha are more desirable; the generally accepted reference point is 0.70 or higher. Although Nunnally (1978) is often cited when it comes to this rule, he has actually never stated that 0.7 is a reasonable threshold in advanced research projects, which resulted in a wide variance of test reliability. In the case of psychometric tests, most fall within the range of 0.75 to 0.83 with at least one claiming a Cronbach's alpha above 0.90.
Table 8 - Reliability of Constructs
As can be seen, all constructs pass the reliability test by far, four of them being above the 0.9 cutoff point, implying good internal consistency among the scales employed for the present study.
Construct Number of Items Cronbach’s alpha
PU 5 0.92 PEOU 5 0.92 BI 3 0.91 PI 3 0.83 SI 3 0.84 FC 6 0.91 TT 4 0.84
46
4.5.2.!
Validity
Many different aspects have been proposed in the psychometric literature (Bagozzi, Yi, & Philips, 1991) to evaluate validity. Construct validity (Straub et al., 2004), which determines the extent to which a scale measures a variable of interest is composed of two elements: convergent and discriminant. When convergent validity is acceptable, it means that each measurement item correlates strongly with the one construct it is related to, while correlating weakly or not significantly with all other constructs.
Preliminary fit was conducted through PCA with Varimax rotation on 30 measurement items to screen them and identify the underlying dimensions of consumers’ adoption of M-Commerce. In the extraction phase, the fixed number of factors i.e. 7 option was selected. Only those items with factor loadings greater than .05 in PCA were kept for the analysis and 2 items were dropped as they were not appropriately loaded on any factor. From the table below, we see that all items have satisfactory loadings ranging from .507 to .855 above the 0.5 cutoff point, ensuring adequate convergent validity (Hair et al.,2010).
Table 9 - Factor Loadings
Constructs Indicator Factor Loading
Personal Innovativeness PI_1 .760 PI_2 .771 PI_3 .791 Social Influence SI_1 .831 SI_2 .855 SI_3 .671 Trust TT_1 .556 TT_2 .580 TT_3 .784 TT_4 .731
Perceived Ease of Use
PEOU_1 .715
PEOU_2 .728
PEOU_3 .673
PEOU_4 .720
PEOU_5 .681
47 PU_2 .746 PU_3 .793 PU_4 .603 PU_5 .675 Facilitating Conditions FC_1 .691 FC_2 .746 FC_3 .712 FC_4 .804 FC_5 .757
Behavioral Intention to Use
BI_1 .679
BI_2 .584
BI_3 .624
Extraction Method: Principal Component Analysis. Rotation Method: Varimax with Kaiser Normalization. a. Rotation converged in 8 iterations.
Composite reliability (CR) was also calculated in relation to the structural model in order to evaluate scale reliability i.e. the internal consistency of a measure (Fornell & Larcker, 1981). All values were above the 0.7 cutoff point suggesting convergent validity (Nunnally, 1978).
Discriminant validity instead refers to the extent to which factors are distinct and uncorrelated. Average Variance Extracted (AVE) i.e. the degree that a latent is explained by its observed variables, Maximum Shared Variance (MSV), and Average Shared Variance (ASV) i.e. the extent to which a variable can be explained by another variable, were calculated to check for discriminant validity. All items reported an MSV < AVE and ASV < AVE implying discriminant validity of the sample (Fornell & Larcker, 1981; Hair et al., 2003). Given the exploratory nature of the study, sample adequacy, validity and reliability of the scales were deemed adequate.
48
CHAPTER 5
Data Analysis and Discussion
In this chapter we will analyze the data collected based on the theoretical
basis of the thesis and discuss the theoretical and practical implications
of this research.
49
5.!DATA ANALYSIS
50
According to the table, most respondents are single (50.2%) males (67%) coming from West India (47%), between 25 and 34 years old (63.9%) whom own a Master Degree (53.4%) and are employees (48.6%) earning between 5,00,000 to 9,99,999 INR per year (26.1%). The majority owns high end smartphones priced above 25,00,000 INR (36.9%) and spend on average between 500 to 999 INR per month on their Postpaid Mobile Data Plans (58.2%).
Previous research has revealed that Indian online buying behavior is related to certain demographics (Li, Cheng, & Russell, 1999; Weiss, 2001), indicating that, compared with brick-and-mortar shoppers, online consumers tend to be “better educated, have higher income, and more technologically savvy” (Li et al., 1999; Weiss, 2001; Swinyard & Smith, 2003).
Hence, this sample can be considered satisfactorily representative of Indian Mobile Commerce users as the majority holds a Master degree, has an annual income between 5,00,000 to 9,99,999 INR, higher if compared to the average Indian per capita income of 74,920 INR per year in 2014 (World Bank) and owning high end smartphones offering a broader range of technologically advanced applications.