U
NIVERSIDADE DEL
ISBOAF
ACULDADE DEM
OTRICIDADEH
UMANAThe impact of 2 weeks detraining on phase angle and muscle
strength in trained older adults
Dissertação elaborada com vista à obtenção do Grau de Mestre em Exercício e Saúde
Orientador: Professor Doutor Luís Fernando Cordeiro Bettencourt Sardinha
Júri:
Presidente:
Doutora Analiza Mónica Lopes Almeida Silva, professora auxiliar com agregação da Faculdade de Motricidade Humana, da Universidade de Lisboa
Vogais:
Doutora Maria Helena Santa Clara Pombo Rodrigues, professora auxiliar da Faculdade de Motricidade Humana, da Universidade de Lisboa
Doutor Luís Fernando Cordeiro Bettencourt Sardinha, professora catedrático da Faculdade de Motricidade Humana, da Universidade de Lisboa
Sofia Pereira Freitas
3
Acknowledgments
This is the end of a long and defiant journey in my life, which I would not be able to complete alone. For that reason, I would like to express my gratitude to the people who stood by my side and supported me throughout this chapter.
To Professor Luís Bettencourt Sardinha
I truly appreciate him for placing his trust in me by giving me the opportunity to participate in such a relevant study. Also for all the guidance and support provided from the beginning and for being rigorous and demanding in everything I did along this investigation. It was challenging but pushed me to do my best work and allowed me to get out of my comfort zone and learn how to be autonomous during this journey. This is a teaching that I will carry and use in everything in my life.
To the participants of the study
They allowed this project to become alive and certainly made it a lot more fun. For all the hours spent together, we had the opportunity to really know each other and actually become friends. Thank you for making this an enjoyable experience and motivating me to comeback every day.
To my fellow students, Inês Correia and Júlia Lopes for being such good colleagues and supportive friends. They were present in the good moments, but also when we had to overcome the barriers that came across.
To Ana Mil-Homens, the joyful nurse who was always ready to do everything in her power to help us. She showed to be more than just a competent professional, she was also a pleasurable company and a great friend.
To APDP, especially Dr. Rogério Ribeiro, for guiding us in a matter in which we were not very comfortable. Also for providing the necessary equipments and material for all blood collections, as well as technicians to process these results.
4
To João, Pedro, Megan and Diana for being our guidance and for always being ready to help us throughout this journey.
To the Professors Catarina and Paula who helped us learning specific techniques and using the equipments from the biochemistry laboratory.
To all my closest friends who were there to keep me motivated.
To my boyfriend for all the support, for being patience enough to put up with me during my bad mood moments and for having the ability to calm me during this process.
To the ones who are always with me, my family. A special gratitude to my mum for being 100% involved in my life and helping me getting through the rough times, but also expressing her pride in everything I did and was able to overcome.
5
Table of Contents
Tables and Figures ... 8
Abbreviations ... 9
Abstract ... 11
Resumo ... 12
Introduction ... 13
1. Bioelectrical Impedance Analysis (BIA) ... 14
1.1. Definition and Principals ... 14
1.2. Types/Methods of BIA ... 15
1.2.1. Single frequency BIA (SF-BIA) ... 16
1.2.2. Multi frequency BIA (MF-BIA) ... 16
1.2.3. Bioelectrical impedance vector analysis (BIVA) ... 17
1.2.4. Specific BIVA ... 20
1.3. Phase Angle (PhA) ... 21
1.3.1. Definition and reference values ... 21
1.3.2. Implications in health ... 22
1.4. Impedance (Z), resistance (R) and reactance (Xc) ... 24
1.5. Total body water, extracellular water and intracellular water ... 25
1.6. Body cell mass (BCM) ... 27
2. Muscle ... 28
2.1. Skeletal Muscle Structure ... 28
2.1.1. Types of muscle fibers ... 28
2.1.2. Types of muscular action ... 29
2.2. Neuromuscular function ... 30
2.2.1. Central Nervous Factors ... 30
6
2.2.3. Articular receptors ... 32
2.3. Muscle Strength (MS) ... 32
2.3.1. Definition ... 32
2.3.2. Strength Manifestations ... 32
2.3.3. Measurement of maximal strength ... 33
3. Association between phase angle (PhA) and muscle strength (MS) ... 34
4. Sedentary Behaviour (SB) ... 35
4.1. Background and Definition ... 35
4.2. Prevalence ... 36
4.3. Impact of Sedentary Behaviour on health outcomes ... 37
4.3.1. Observational Studies ... 37
4.3.2. Experimental Studies ... 38
4.3.3. Systematic Reviews and Meta-analysis ... 39
5. Physical (In)Activity ... 40
5.1. Definition and Recommendations ... 40
5.2. Confusion between physical inactivity and sedentary ... 41
6. Detraining ... 42
6.1. Definition and general effects on health ... 42
6.2. Effects of detraining on phase angle (PhA) and muscle strength (MS) ... 43
7. Ageing ... 44
7.1. Definition and ageing process ... 44
7.2. Implications on phase angle (PhA) ... 45
7.3. Implications on muscle strength (MS) and mass ... 46
Objectives and relevance of the study ... 47
Methodology ... 48
1. Recruitment Process ... 48
7
3. Baseline and follow – up assessments... 51
3.1. Anthropometric measures ... 51
3.2. Body composition measurements ... 51
3.3. Physical Fitness ... 52
3.3.1. Cardiorespiratory fitness ... 52
3.3.2. Muscle Strength ... 53
4. Detraining period ... 53
5. Objective Measures of Sedentary Time and Physical Activity ... 54
6. Statistical Analysis ... 55
Results ... 55
Discussion ... 60
1. Phase Angle (PhA) ... 61
2. Muscle Strength (MS) ... 65
3. Phase angle (PhA) vs muscle strength (MS) ... 68
Limitations ... 70
Conclusion ... 71
Future work ... 72
Reference List ... 73
APPENDIX A – Exclusion Criteria Questionnaire ... 84
8
Tables and Figures
Figures List
Figure 1: Interpretation of the BIVA nomogram (Walter-Kroker, Kroker, Mattiucci-Guehlke,
& Glaab, 2011)... 19
Figure 2: Impedance plot illustrating the relationships between resistance (R), reactance (Xc), and phase angle (º) (Baumgartner, Chumlea, & Roche, 1988) ... 24
Figure 3: Flow Chart ... 49
Figure 4: Intervention Guide comprising all the assessments and protocols from the 3 studies included in the intervention ... 50
Figure 5: Individual changes (%) of PhA after detraining ... 58
Figure 6: Detraining changes in R (Ohm), Xc (Ohm) and PhA (°) ... 58
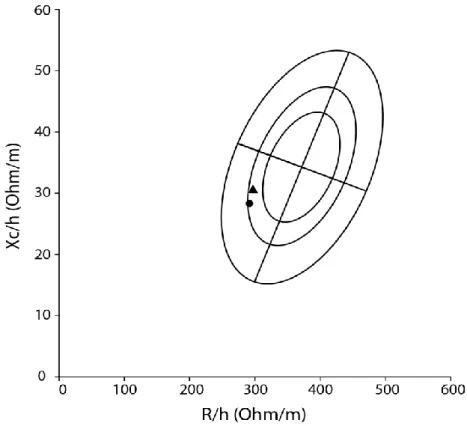
Figure 7: BIVA changes between baseline (▲) and post-detraining (●) ... 59
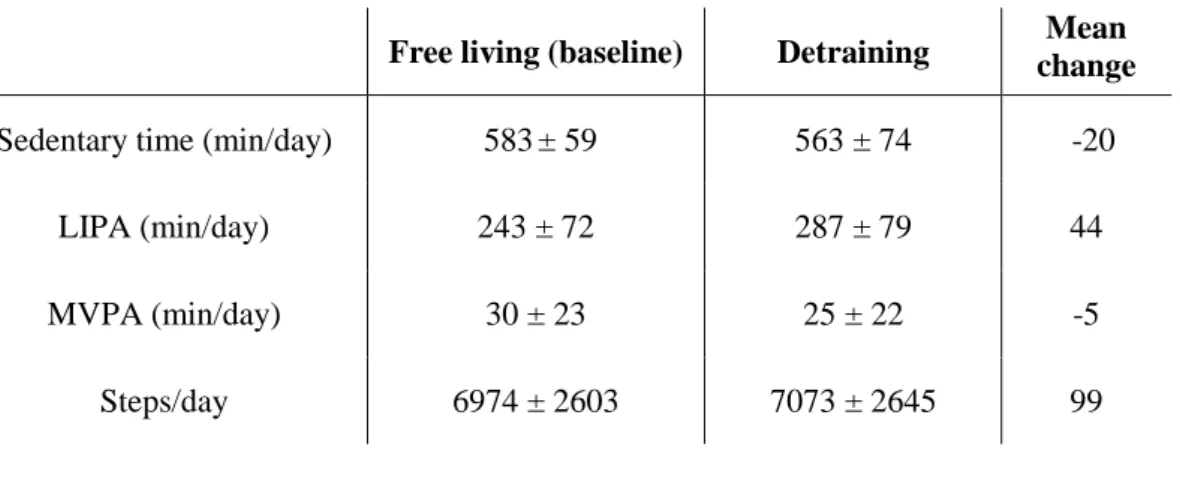
Tables List Table 1: Baseline and detraining characterization of sedentary and physical activity levels, all presented as total mean values. ... 56
Table 2: Changes between baseline and post-detraining regarding participant`s body composition, bioelectrical components and cardiorespiratory and strength fitness ... 57
9
Abbreviations
ALM appendicular lean mass BCM body cell mass
BF body fat
BIA bioelectrical impedance analysis BIS bioelectrical impedance spectroscopy BMC body mineral content
BMI body mass index CVD cardiovascular disease ECW extra-cellular water FFM fat-free mass FM fat mass
GTO golgi tendon organs
H height
h/d hours per day ICW intra-cellular water L liters
LIPA low-intensity physical activity
m meters
MF-BIA multi-frequency bioelectrical impedance analysis MS muscle strength
MV muscle volume
MVPA moderate-to-vigorous activity PhA phase angle
10
R resistance
SB sedentary behaviour
SF-BIA single frequency bioelectrical impedance analysis TBW total body water
Vo2 max maximum rate of oxygen consumption XC reactance
11
Abstract
The impact of 2 weeks detraining on phase angle and muscle strength in trained older
adults
An interruption in the training routine may have deleterious effects on muscle performance and bioelectric markers, namely phase angle (PhA), which is a predictive marker for cellular integrity.
Purpose: To determine the effects of a 2-week detraining period on PhA and MS in older
trained adults.
Methods: A total of 14 older adults (6 females) aged ≥ 65 years (77.2 ± 6.6) were assessed at
baseline (i.e. trained) and after 2 weeks of detraining, for PhA and MS. PhA (º) was assessed using bioelectrical impedance analysis (BIA). MS was assessed on both lower and upper limbs under isometric conditions. Differences between moments were examined using the general model for repeated measures, with adjustment for sex. Statistical significance was set at p < 0.05 and a power of 0.80 for all the analysis.
Results: Detraining resulted in declines in PhA (p = 0.017). No differences were found in MS,
for both leg press (p = 0.992) and bench press (p = 0.166) assessments. One association was found between PhA and bench press (r = 0.76, p<0.05), in post-detraining.
Conclusion: A short-term detraining period of 2-weeks resulted in detrimental changes in PhA
but not in MS. These results highlight the importance of maintaining structured exercise sessions in older adults.
Key words: Physical inactivity; detraining; phase angle; muscle strength; isometric testing;
12
Resumo
Efeitos de 2 semanas de destreino no ângulo de fase e força muscular em idosos treinados
Uma interrupção da rotina de treino poderá ter consequências negativas na performance muscular e em marcadores bioelétricos, nomeadamente no ângulo de fase, que é um indicador de integridade celular.
Objetivo: Investigar os efeitos de um período de 2 semanas de destreino no ângulo de fase e
na força muscular em pessoas idosas treinadas.
Métodos: Um total de 14 pessoas idosas (6 mulheres) com idades igual ou superior a 65 anos
(77.2 ± 6.6) realizaram uma avaliação num momento inicial e após 2 semanas de destreino para determinar o ângulo de fase e a foça muscular. O ângulo de fase foi avaliado através da análise por bioimpedância (BIA). A força muscular foi medida nos membros inferiores e superiores, sob condições isométricas. As diferenças entre momentos foram analisadas através do modelo linear geral para medidas repetidas, controlado para a covariável sexo. Foi assumida uma significância estatística de p<0.05 e uma potência de 0.80 para todas as análises realizadas. Resultados: O destreino resultou na diminuição do ângulo de fase (p=0.017). Não se
observaram diferenças na força muscular, tanto na prensa de pernas (p=0.992) como no supino (p=0.166). Apenas foi encontrada uma correlação positiva entre o ângulo de fase e a força de supino (r = 0.76, p<0.05), no momento pós-destreino.
Conclusão: Um período de destreino de curta duração (2 semanas) promove alterações no
ângulo de fase, mas não na força muscular. Estes resultados destacam a importância da participação regular de populações idosas em sessões de exercício estruturadas para se preservar a integridade celular.
Palavras-chave: Inatividade física; destreino; ângulo de fase; força muscular; métodos
13
Introduction
People have been spending more time in sedentary behaviours (SB), essentially sitting (Hamilton, Hamilton, & Zderic, 2007), which has been highly influenced by industrialization and financial growth because of the shift in the type of activities that people perform in their daily lives (Hill, Wyatt, Reed, & Peters, 2003; Lanningham-Foster, Nysse, & Levine, 2003). This is considered a global trend which is likely to continue and cause several negative effects, such as the increment of body adiposity and impairments in physiologic markers (cholesterol, triglycerides, blood glucose) which contribute to the increase of the risk of metabolic and cardiovascular diseases and some cancers (Bowden Davies et al., 2018; Hamilton et al., 2007; Katzmarzyk, Church, Craig, & Bouchard, 2009). Specifically older adults, when compared to adults, spend more time in SB, which may be particularly concerning given all the harmful effects of aging (A. E. Bauman, Petersen, Blond, Rangul, & Hardy, 2018).
With the increase of age, several changes occur on some of the major physiological and biological systems of the body. These age-related changes may be pathological and lead to a dependent state in which the older adult may have poor mobility, weakness, increased risk of falling, fractures or even diseases, such as osteoporosis or osteoarthritis (Freemont & Hoyland, 2007). The magnitude of these pathologies may be aggravated when elderly adopt SBs and refrain from physical activities.
Only 35% of the older people reach the recommendations for 150 minutes/week of at least moderate physical activity, with a prevalence of 46% for men and 29% for women (Baptista et al., 2012). Participating in exercise programs, specifically for the elderly, enhances several capabilities and helps provide more years of mobility, independence, and better quality of life by escaping from disability to perform activities of daily living (Fatouros et al., 2005; Faulkner & Brooks, 1995). Although exercise is not capable of preventing the inevitable decline in the functional capabilities of skeletal muscle with aging, it will at least delay the
14
aggravation on quality of life (Faulkner & Brooks, 1995). Therefore, it seems crucial to maintain an active lifestyle with regular practice of exercise and to avoid, as much as possible, long periods of inactivity (Dos Santos, Cyrino, Antunes, Santos, & Sardinha, 2016).
Although the benefits of exercise are well known, there is little evidence on the damages induced by the detraining. Detraining seems to promote a partial or complete loss of training-induced physiological and anatomical adaptations as well as a loss in performance (Fleck, 1994; Mujika & Padilla, 2000). The magnitude of these deleterious consequences is still not well understood in older populations.
Some of the markers affected by the combination of aging, SB and physical inactivity concern bioelectrical properties - such as phase angle (PhA) -, and muscle strength (MS), which will be the focus of the present thesis.
1. Bioelectrical Impedance Analysis (BIA)
1.1. Definition and Principals
Bioelectrical impedance analysis (BIA) has been frequently used in diverse clinical situations, so it seems important to be aware of its principles and methods and also the body compartments that it assesses (Kyle et al., 2004).
BIA is a widely used method to measure passive electrical characteristics in living organisms, providing the results rapidly. It is known for being a safe, simple, portable, non-invasive and reliable method, which uses biophysical and regression models to predict body composition, since it does not directly determine it. BIA devices induce a constant, low-level alternating current thought the placement of a tetrapolar surface electrode on both hands and/or feet, providing whole-body values (Kyle et al., 2004; Lukaski, 2013; Lukaski, Kyle, & Kondrup, 2017). BIA devices may be phase-sensitive or non-phase-sensitive. Phase-sensitive impedance uses a single frequency of 50 kHz, which allows the direct measurement of PhA
15
and impedance (Z), and calculates reactance (Xc) and resistance (R) through a trigonometric approach (Sardinha, 2018). The non-phase-sensitive devices do not provide the frequency-dependent phase-shift and use a range of frequencies to generate the best fit model from data acquisition at each frequency in order to calculate Z and PhA (Bosy-Westphal et al., 2017; Sardinha, 2018; Ward, Essex, & Cornish, 2006). This approach may not be accurate when calculating PhA (Sardinha, 2018).
The impedance in BIA is affected by specific frequency, body geometric shape and cross-sectional area. Therefore, fat-free mass (FFM), which includes a protein matrix and contains most of the water and conducting electrolytes in the body, has a greater conductivity when compared to fat mass (FM) (Lukaski, 1987). Intracellular and extracellular fluids are rich in electrolytes and, therefore, are greater conductors of electricity than cell membranes, which have a phospholipid bilayer structure. While low frequencies pass only through extracellular fluids, higher frequencies are able to penetrate cells and access intracellular fluids (Lukaski, 1987; Lukaski, Bolonchuk, Hall, & Siders, 1986).
BIA enables the determination of the quality of cellular membranes and the body fluid distribution, identifying biomarkers of cellular damage or dead cell in geriatric populations (Lukaski et al., 2017).
1.2. Types/Methods of BIA
There are several methods based on the principles of bioelectrical impedance, classified in the following major categories: single frequency BIA (SF-BIA), multi-frequency BIA (MF-BIA) (Kyle et al., 2004), bioelectrical impedance vector analysis (BIVA) (Piccoli, Rossi, Pillon, & Bucciante, 1994) and specific BIVA (Marini et al., 2013). For the purpose of this study, SF-BIA and BIVA were used.
16
1.2.1. Single frequency BIA (SF-BIA)
SF-BIA is a method based on mixture theories and empirical equations. It utilizes a frequency of 50kHz, which passes between surface electrodes placed on the hand and foot (or had-to-hand, or foot-to-foot), measuring the weighted sum of extra-cellular water (ECW) and intra-cellular water (ICW) resistivities (~25%), in order to estimate total body water (TBW). However, this method cannot detect differences in ICW. SF-BIA is not valid under conditions of significant dehydration and tends to significantly underestimate TBW and overestimate body fat in healthy individuals (Kyle et al., 2004; Martinoli et al., 2003). SF-BIA is also capable of estimating fat free mass (FFM), which is described as “everything that is not fat”. It can be determined by gender, age and ethnic group specific SF-BIA equations, assuming that hydration is normal (Kyle et al., 2004).
1.2.2. Multi frequency BIA (MF-BIA)
MF-BIA is a device that uses regression models and performs its analysis at two types of frequencies: one at very low frequencies (normally 5kHz) and the other at higher frequencies (50, 100, 200 to 500 kHz) (Kyle et al., 2004; Thomasset, 1962; Ward, 2019). The impedance data are applied to regression-derived equations in order to predict TBW, ECW, and ICW (C. Earthman, Traughber, Dobratz, & Howell, 2007).
The bioelectrical impedance spectroscopy (BIS) is an approach of MF-BIA that measures across a spectrum of frequencies and uses mathematical modelling and mixture equations to generate relations between R and body fluid compartment (Kyle et al., 2004). The spectrum follows the model of Cole-Cole (S. Cole & H. Cole, 1941), which allows the existence of theoretical impedances at the frequency of zero and infinite. BIS has the advantage of only using low frequencies through the ECW, while it uses high frequencies (> 50 kHz) to flow through both ECW and ICW (Ward, 2019). Therefore, it provides a more direct,
17
individualized measurement of ECW and ICW than other impedance approaches (C. Earthman et al., 2007). It also estimates TBW, as the sum of ECW and ICW, fat free mass and fat mass. It is valid for all populations, regardless their health status, age, ethnic, or other conditions (Patel, Matthie, Withers, Peterson, & Zarowitz, 1994). The values of impedance measured in a certain spectrum of frequencies may explain variations in the body composition between individuals more precisely than single frequency devices.
1.2.3. Bioelectrical impedance vector analysis (BIVA)
BIVA is an integral part of BIA and combined, they provide a valuable evaluation of body composition in humans, although this method does not measure body compartments quantities (Norman, Stobaus, Pirlich, & Bosy-Westphal, 2012; Walter-Kroker et al., 2011). BIVA, developed by Piccoli, is a simple and quick method that uses impedance measurements, such as R and reactance (Xc), to access fluid status (i.e total body water) and body cell mass (BCM) (Bosy-Westphal, Danielzik, Dorhofer, Piccoli, & Muller, 2005; Piccoli, Rossi, Pillon, & Bucciante, 1996; Walter-Kroker et al., 2011). It uses a bivariate vector as a nomogram in the RXc mean graph and it`s normalized per subject`s height (H) (average of R/H and Xc/H, measured in Ohm/m) (Bosy-Westphal et al., 2005; Piccoli et al., 1994; Walter-Kroker et al., 2011). The standardization for H is important because it provides a qualitative measure of soft tissue regarding body size (Norman et al., 2012; Piccoli et al., 1994).
Because there are differences in the vector distribution patterns, it is necessary to define reference distributions of impedance vectors (R and Xc) accordingly to sex, race/ethnicity, BMI, and age stratifications (Bosy-Westphal et al., 2005; Piccoli et al., 1995b; Piccoli, Pillon, & Dumler, 2002)
In the RXc graph the reference values are plotted in three specific tolerance ellipses in the same coordinate system, corresponding to the 50th, 75th and 95th vector percentile of the
18
healthy population (Piccoli et al., 1995b; Piccoli et al., 2002; Piccoli et al., 1994; Walter-Kroker et al., 2011). After all the adjustments, the position and the length of the vector gives information about an individual`s hydration status (length of the vector) and BCM and integrity (migration sideways) (Bosy-Westphal et al., 2005; Norman et al., 2012; Piccoli et al., 1994; Walter-Kroker et al., 2011). Values of healthy individuals are usually within the 75th tolerance ellipse (Norman et al., 2012; Piccoli et al., 1998) and values located outside the 95th percentile are considered abnormal and may signal different health conditions depending on the quadrant they are located in (Bosy-Westphal et al., 2005; Dorhofer & Pirlich, 2005; Walter-Kroker et al., 2011): exsiccosis/dehydration, characterized by increased R and a longer and upper vector (right upper quadrant); oedema/fluid overloading, decreased R, shortening and down-sloping of the vector (left lower quadrant); malnutrition and BCM decrease, low Xc (right lower quadrant); and good training status and BCM increase, high Xc (left upper quadrant) (Figure 1) (Dorhofer & Pirlich, 2005; Piccoli et al., 1994; Walter-Kroker et al., 2011).
Also different types of individuals present a pattern for different bioelectrical characteristics: obese present high PhA and short vector; athletes present high PhA and long vector; cachectic present low PhA and long vector; and lean individuals present normal PhA and long vector (Norman et al., 2012).
19
BIVA has shown to be an effective method to access health status and identify several conditions, such as renal pathologies, liver disease, obesity, cachexia, and anorexia (Buffa, Floris, & Marini, 2003; Piccoli et al., 2002; Piccoli et al., 1996). Also BIVA seems to be important to identify quantitative changes of body composition in the elderly, allowing the perception of nutritional variations, reduction of soft tissue and possible pathologic conditions during the aging period (Buffa et al., 2003; Norman et al., 2012). Particularly after the age of 80, for both men and women, soft tissue mass and its electrical properties tend to decrease, leading to a reduction of the capacitive component (Xc/H), as well as PhA (Buffa et al., 2003; Norman et al., 2012). This is due to the quantitative and qualitative changes of the lean and fat tissues of the body (e.g. reduction in the number of muscle fibres and motor units, particularly in the limbs, highly associated with sarcopenia) (Buffa et al., 2003; Norman et al., 2012). The values of R/H tend to either stay normal or increase (Buffa et al., 2003).
Compared to PhA alone, BIVA enables a better understanding of BCM integrity and hydration status. This two methods used together allow a better monitoring and possible
Figure 1: Interpretation of the BIVA
nomogram (Walter-Kroker, Kroker, Mattiucci-Guehlke, & Glaab, 2011)
20
identification of patients at risk, concerning hydration and nutritional status. According to the R and Xc, theoretically, different positions of the vector in the RXc graph produce similar PhA values (Norman et al., 2012).
1.2.4. Specific BIVA
Marini et al. (2013) developed an additional analytical variant based on the classic BIVA: the specific BIVA. This alternative has proven to be an effective and practical method to evaluate body composition since it uses the same approach as classic BIVA and easily calculates specific bioelectrical values from bioelectrical and anthropometric parameters, regarding body geometry (Marini et al., 2013). In specific BIVA, R and Xc are used with the same vectorial approach of classic BIVA, however these impedance values are not only standardized for body height, but also for body volume, in order to estimate the whole-body impedivity vector (Marini et al., 2013; Saragat et al., 2014). To enable this, R and Xc values are multiplied by a correction factor, Area/Length (meters, m), using estimated values of Area and Length: “Area = (0.45 * arm area + 0.10 * waist area + 0.45 * calf area) (m2), where segment area = C2/4JI, and C (m) is the circumference of the arm, waist and calf, respectively; Length = 1.1 H, where H is body height in meters” (Marini et al., 2013). These new bioelectrical variables represent the impedivity or specific impedance, which is the square root of sum of squares of resistivity and reactivity. Specific R and Xc are multiplied by a factor of 100 to obtain the same order of magnitude as classic BIVA (Marini et al., 2013).
Resistivity and reactivity provide an indicator which is positively associated with the relative fat mass, detecting different quantities of body fat in individuals with similar BMI (Buffa, Mereu, Succa, Latini, & Marini, 2017; Marini et al., 2013). The lengthening of the impedivity vector indicates an increase in FM% values (Marini et al., 2013).
21
Specific BIVA may be an interesting method to use during the monitoring of sarcopenia and sarcopenic obesity (age-related conditions), since it seems effective in identifying changes in the body composition of older people (Marini et al., 2013). It also seems to be more accurate than BMI when accessing FM%, so it would be useful to screen obesity and, especially normal-weight obesity (Buffa et al., 2017).
1.3. Phase Angle (PhA)
1.3.1. Definition and reference values
PhA is a raw parameter measured in degrees (º) by BIA which is directly affected by changes in the amount and quality of soft tissue mass (Bosy-Westphal et al., 2006; Tomeleri et al., 2017). PhA depends on Xc, which includes cell size and integrity of the cell membrane, and R, such as tissue hydration. Therefore, mathematically, PhA is obtained from the arctangent of the Xc to R ratio ((Xc/R) x 180º/π) (Bosy-Westphal et al., 2006; Tomeleri et al., 2017). R and Xc will be discussed in more detail in topic number 1.4.
PhA provides information about the cellular health of the whole body and has been used as a crucial biomarker of several clinical conditions (Gonzalez, Barbosa-Silva, Bielemann, Gallagher, & Heymsfield, 2016). PhA normal values depend on the population group, which constitutes a disadvantage since its range is very wide, limiting comparisons among groups (Grundmann, Yoon, & Williams, 2015). There is evidence that higher values for PhA (>6.6º) are associated with a greater amount of intact cell membranes and therefore, a longer life span. On the opposite side, smaller values (<5.4º) indicate that the integrity of body cells may be compromised, leading to a reduction of life span (Selberg & Selberg, 2002). According to this, a higher PhA suggests a more positive cellular health, integrity of cell membranes and better cellular function. Its values may vary between 5 and 7 in healthy people, and may even reach values near 9.5 in athletes. In the presence of disease, it is frequent to observe a smaller PhA,
22
since there may exist infection, inflammation, nutritional dysfunction or other specific parameters of disease itself, which compromise the PhA (Norman et al., 2012).
Bosy-Westphal et al. (2006) proposed reference values for PhA by age, sex, and body mass index (BMI) in both children/adolescents and adults/older adults. The authors observed that in youth, PhA increases with age, in both males and females and also with BMI. However, this would only be valid for children/adolescents, which means that from adulthood on, this relation becomes negative. The increment in PhA with age in the early years appears to be related to the increase in cell mass which is natural during growth and development (Bosy-Westphal et al., 2006). In addition, PhA seems to be higher in men compared to women, although this is not valid for children between 14 and 17 years old and after 70 years old. Regardless of sex and age, BMI explains 1% of the variance observed in PhA. In normal-weight and overnormal-weight individuals (BMIs up to 40 kg/m2), PhA and BMI are positively related. For BMIs higher than 40 km/m2, PhA decreases with BMI (Bosy-Westphal et al., 2006).
1.3.2. Implications in health
Evidence has shown that PhA is a useful, simple and inexpensive electrical biomarker for the prognosis of several health conditions, which will be discussed below.
Decreases in R and Xc may be caused by increased extracellular fluid or increased subcutaneous, intraabdominal and interstitial fat, which reduce cell wall and tissue permeability (Ackmann & Seitz, 1984; Baumgartner et al., 1988). Consequently, this affects the PhA, making it a great predictor of hydration status and % of body fat (BF). Specifically, PhA for the trunk may be used for the index of %BF and, regarding body segments, predict index adipose tissue distribution. Changes in fat mass (FM) and FFM and distribution of body water are likely to affect this relation between PhA and %BF. PhAs for the trunk, leg and whole body
23
are negatively correlated with %BF and positively correlated with FFM (Baumgartner et al., 1988).
Malnutrition results in unintentional weight loss, including lean mass, which may accelerate the progression of sarcopenia, which is very common in older adults (Janssen, Shepard, Katzmarzyk, & Roubenoff, 2004). During the aging process, malnutrition and/or sarcopenia, as well as frailty and cardiovascular disease (CVD) can be predicted through the measurement of the PhA (Basile et al., 2014; Janssen et al., 2004; Norman et al., 2012; Saad et al., 2018; Tomeleri et al., 2018).
Low PhA values are highly associated with mortality, disease progression, postoperative complications, chronic-degenerative and neoplastic diseases (Norman et al., 2012). Compared to normal individuals, PhA is significantly lower in people with osteoporosis, showing that it may be a risk factor and predictor for this condition, irrespective of age and sex (Tanaka et al., 2018).
PhA has also been shown to be correlated with diverse types of cancer, especially at advanced stages. Increasing PhA values seems to be crucial for the improvement in health status and higher survival rates and outcomes in cancer patients (Grundmann et al., 2015; Hui et al., 2014). In this sequence, several investigations found that PhA may be a strong predictor of advanced non-small cell lung cancer (Gupta et al., 2009), advanced head-and-neck cancer (Wladysiuk et al., 2016), advanced pancreatic cancer (Gupta et al., 2004) and advanced colorectal cancer (Gupta et al., 2008).
It is also useful in the prognosis of liver cirrhosis, since these specific patients usually present PhA values lower than 4.9°, which are associated with worse metabolic and nutritional status, and with disease progression profiles (Belarmino et al., 2017; Ruiz-Margain et al., 2015).
24
Lastly, PhA may also be used as a predictor of malnutrition in hemodialysis patients, which can be helpful in detecting and preventing malnutrition, allowing for the enhancement of quality of life of these patients (Rimsevicius et al., 2016).
When working with patients with diseases it is important to follow them throughout therapy and record their PhAs individually, so the prediction over time can be more accurate (Grundmann et al., 2015).
1.4. Impedance (Z), resistance (R) and reactance (Xc)
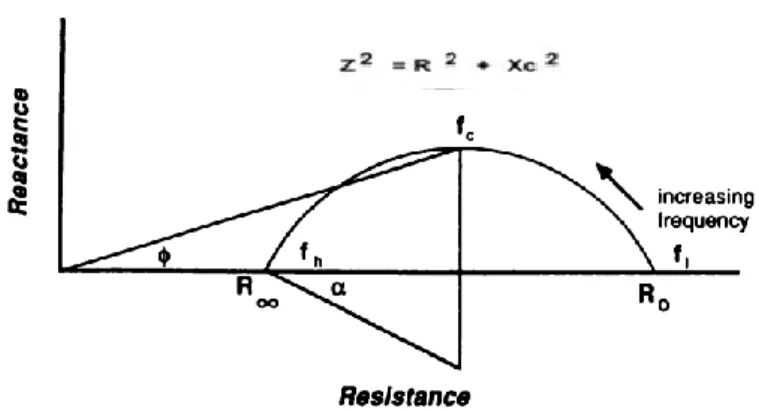
Typically, BIA uses a method which provides the values of R, Xc, Z and PhA. Z, measured in ohms, represents a complex value, which combines the two types of resistance that the body offers to an electrical current, which are capacitive resistance, known as Xc, and resistive resistance, simply called R (Kyle et al., 2004; Lukaski et al., 2017). Z is calculated by the square root of the sum of the squares of R and Xc (Z2 = R2 + Xc2), as illustrated in Figure 2 (Baumgartner et al., 1988).
Xc arises from cell membranes and represents the capacitive component of tissues, creating a lag in the current behind the voltage, which causes a phase shift, also called PhA.
Figure 2: Impedance plot illustrating the relationships between resistance (R), reactance (Xc), and phase angle (º) (Baumgartner, Chumlea, & Roche, 1988)
25
On the other side, R arises from extra- and intracellular fluid, representing the opposition of a biological conductor to the flow of an alternating electric current (Baumgartner et al., 1988; Kyle et al., 2004; Lukaski et al., 2017).
R is constituted by the resistance components, such as water and electrolytes which can be found in tissues and fluids (Baumgartner et al., 1988; Kyle et al., 2004; Lukaski et al., 2017). According to Ohm`s law, the resistance of a substance is proportional to the voltage drop by the current which passes through it (Kotler, Burastero, Wang, & Pierson, 1996). Xc and R are related to each other, reflecting different electrical properties of tissues that may be affected in various ways by disease and nutritional or hydration status (Kyle et al., 2004).
Through the placement of low-Z electrodes, it is possible to measure Z and the delay between voltage and the electrical current in the tissue and cell membrane, which is expressed by the value of the PhA (Lukaski et al., 2017). PhA is negatively associated with R and positively with Xc (Baumgartner et al., 1988).
1.5. Total body water, extracellular water and intracellular water
Water is the largest chemical compound of the average human body, representing 60% and 55% of total body mass, for men and women, respectively (Martinoli et al., 2003). The total body water (TBW) compartment is the sum of the extracellular water (ECW) compartment (45% of TBW) and intracellular water (ICW) compartment (55% of TBW), all measured in liters (L) (Malbrain et al., 2014; Martinoli et al., 2003). ICW can be defined as the body water that exists inside the cell membrane, as ECW exists outside the cell membrane. ECW may be interstitial, lymphatic, trans-cellular fluid or blood (Malbrain et al., 2014).
BIA is considered to be an ideal method for the measurement of body water compartments (Thomas, Cornish, & Ward, 1992). Usually, the applied current used to access this compartments is 50 kHz, which allows to go through the ECW and ICW, and therefore
26
predict TBW (Ward et al., 2006). Studies show that SF-BIA and BIS significantly overestimate TBW in healthy individuals, which does not happen when using MF-BIA (Martinoli et al., 2003). Therefore, MF-BIA seems to be a more accurate method to determine TBW and to be more sensitive to changes in water compartments, even if body weight remains the same (Kyle et al., 2004; Martinoli et al., 2003).
Intracellular and extracellular body fluid status are of great importance in both healthy and diseased individuals (Malbrain et al., 2014). ECW and the ECW/ICW ratio are increased in the presence of edema, malnutrition and/or disease, such as heart failure, liver cirrhosis and chronic renal failure, which seems to be due to a shift from intra to extracellular space (Kyle et al., 2004; Malbrain et al., 2014). Changes in ICW are associated with changes in the metabolic and nutritional status of the organism. In the advanced state of some diseases, such as cancer and aids, there is a significant decrease of ICW, which reflects the loss of BCM (C. P. Earthman et al., 2000; Yoon, Grundmann, Williams, Gordan, & George, 2018).
Consequently, this affects the ECW/ICW ratio, which has shown to provide important information about hydration and BCM. Authors also believe that this ratio may be determinant for the PhA variation (Gonzalez et al., 2016), given the influence body water compartments and electrolytes have in resistivity (Kyle et al., 2004). Authors suggest that a low PhA value exists concurrently with a lower Xc due to a less amount of cell membranes and a smaller cell size, which is related with less ICW and more ECW (Foster & Lukaski, 1996; Guo, Chumlea, & Cockram, 1996; Malbrain et al., 2014). So, individuals with higher values of PhA usually have a lower ECW/ICW ratio (Buffa, Saragat, Cabras, Rinaldi, & Marini, 2013), due to higher BCM and therefore, lean mass (Buffa et al., 2013; Chertow et al., 1995). With aging, PhA tends to decrease as a consequence of smaller BCM followed by increases in the ECW compartment, which leads to a higher ECW/ICW ratio (Silva et al., 2005). The normal values for the ECW/ICW ratio are considered to be less than 1 (Malbrain et al., 2014).
27
1.6. Body cell mass (BCM)
Among the body compartments measured by BIA, there is also BCM, which is the protein rich compartment affected by catabolic states (Kyle et al., 2004). It is essentially the FFM with no bone mineral mass and extracellular water (Oliveira et al., 2010). BCM is considered one of the most metabolically active compartments in the body since it comprises all the cells which are capable of oxidizing substrates to obtain or convert energy (Moore & Boyden, 1963; Oliveira et al., 2010). It seems to be a reference marker for “energy exchange, work performance, and mitotic potential” (Moore & Boyden, 1963).
When the integrity of body cells is compromised, the capacitance drops, which directly affects PhA, causing its decrease (Selberg & Selberg, 2002). Thus, BCM, Xc, and PhA are related and seem to be useful biomarkers for nutritional status, specifically in patients with some kind of disease (Oliveira et al., 2010).
All body cells contain potassium and it appears that the concentrations of intracellular potassium are very similar between all cellular tissues. Therefore, the determination of the amount of potassium in the body may be the gold standard method to estimate the total weight of the BCM. By measuring the plasma potassium concentration and the extracellular fluid it is possible to calculate the total intracellular potassium (total exchangeable potassium - total extracellular potassium) (Moore & Boyden, 1963).
A different method would be measuring intracellular water, however it is not as accurate because this compartment may suffer from changes in the extracellular water (Moore & Boyden, 1963). BCM may also be determined through predictive equations based on BIA (Kotler et al., 1996). The equations used to measure BCM require the inclusion of H, otherwise it will not provide an accurate result. In patients with large alterations of body volume or hydration status, the use of BIA to measure BCM is not valid (Kyle et al., 2004).
28
2. Muscle
2.1. Skeletal Muscle Structure
Movement is only possible with an arrangement between skeletal muscles and bones, which are both connected by joints (Haff, Triplett, National, & Conditioning, 2016). Muscle contains muscle tissue, connective tissue, nerves and blood vessels (Haff et al., 2016). The muscle core is where muscle strength (MS) is produced and fascia and tendons are located in the edges to connect the muscle with the bone (Rasch, 1989). Muscle cells or muscle fibers comprise the contractile elements of the muscle (Drews & Wilmore, 2000; Pedro Mil Homens, 2005), such as myosin and actin which connect through cross-bridges and therefore generate MS (Nicpon-Marieb, 1992). The amount of strength created in the muscle depends on the amount of cross-bridges, the frequency of stimulation of the fiber and the accumulation of calcium inside the fiber (Pedro Mil Homens, 2005). Muscles are also composed by elastic components which allow them to have the ability of deforming and returning to their original shape (Rasch, 1989).
2.1.1. Types of muscle fibers
Muscle needs to adapt its capacities to different demands for movement and this seems to be guaranteed by the existence of different muscle fiber types according to twitch time and histochemical content: slow-twitch fibers (also known as red or type 1 fibers) and fast-twitch fibers (white or type 2 fibers), which can be subdivided in type 2A and 2X (Haff et al., 2016; Nicpon-Marieb, 1992).
Slow-twitch fibers are typically thin cells which are supplied by smaller motor neurons with smaller excitability thresholds and have, in their essence, an oxidative metabolism (Nicpon-Marieb, 1992; Powers & Howley, 1997). Thus, these fibers produce less tension and with a smaller intensity but are able to maintain it for longer periods of time, since they are
29
more resistant to fatigue (Bandy, Lovelace-Chandler, & McKitrick-Bandy, 1990; Morris, 1969). Fast-twitch fibers, namely type 2X are the opposite – they are inefficient, fatigable and have a glycolytic metabolism, so that they are primarily used in rapid force development (Haff et al., 2016). They are supplied by bigger size motor neurons and develop higher, faster, and more vigorous tensions but only for a short time period (Bandy et al., 1990; Morris, 1969; Pedro Mil Homens, 2005). Type 2A fibers comprise characteristics of both types (type 1 and type 2X), they are fast and intense and have a great resistance to fatigue (Powers & Howley, 1997).
2.1.2. Types of muscular action
Muscle contraction does not always imply the shortening of the muscle, it depends on the amount of strength produced and the magnitude of resistance offered by external forces (Nicpon-Marieb, 1992; Rasch, 1989). Three types of muscular action may be distinguished: dynamic (concentric or eccentric) or static (isometric) (Powers & Howley, 1997). Concentric muscle action is responsible for movement and acceleration and occurs when the tension produced by the muscle overcomes the external resistance, which leads to a shortening of the muscle (Karpovich & Sinning, 1971; Powers & Howley, 1997). By contrast, eccentric muscle action is important to cushion and stop movements and occurs when the muscle tension produced results in the elongation of the muscle (Karpovich & Sinning, 1971; Pedro Mil Homens, 2005; Powers & Howley, 1997). Finally, isometric muscle action happens when both tensions (internal and external) are equal, maintaining the length of the muscle (Rasch, 1989) and is crucial to fix and stabilise joints (Pedro Mil Homens, 2005).
30
2.2. Neuromuscular function
The central nervous system controls the activity of muscles and allows them to voluntarily contract, providing the necessary stimulus for the locomotor system (Pedro Mil Homens, 2005). In the next chapter, central nervous factors will be discussed, namely intra and intermuscular coordination, peripheral nervous factors and articular receptors.
2.2.1. Central Nervous Factors
Intramuscular Coordination
Motor neurons send impulses or action potentials that activate all its fibers, leading them to produce force. Muscles that require more precision have normally less muscle fibers for each motor neuron (Haff et al., 2016).
In this sequence, intramuscular coordination occurs when the central command, which produces movement, sends a certain amount of stimulus up to the group of motor units that form each muscle (Pedro Mil Homens, 2005). This process directly depends on two important mechanisms that help regulate the intensity of the contraction: the number of motor units recruited and the frequency of their activation (Nicpon-Marieb, 1992; Pedro Mil Homens, 2005). Concerning the first mechanism, the more motor units that are recruited, the greater the force of muscle contraction (Nicpon-Marieb, 1992). Henneman`s size principal sustains that motor units are recruited for crescent order according to their capacity to produce strength (Henneman, Somjen, & Carpenter, 1965).
Respecting the frequency of the activation of motor units, the higher the frequency of stimulus, the greater the intensity of fibers contraction (Nicpon-Marieb, 1992; Pedro Mil Homens, 2005). Tetanic contractions happen when a muscle is stimulated rapidly and repeatedly, allowing it to maintain the contraction for an uncertain duration (Nicpon-Marieb, 1992). The strength produced in a muscular contraction may increase through the increment in
31
both the number of motor units recruited and the frequency of activation of each motor neuron (Pedro Mil Homens, 2005).
Intermuscular Coordination
Intermuscular coordination relies on the coordination between all the muscles in the human body, which hold different structural and functional characteristics (i.e. agonist and antagonist muscles and fixator and neutralizer muscles) (Pedro Mil Homens, 2005; Rasch, 1989). Agonist muscles are the muscles that may potentially produce the articular movement and antagonist muscles are the natural opponents of agonist muscles (Rasch, 1989). The coordination between these two muscles is extremely important to increase the precision of movement. Fixators produce static strength and help fixating and stabilizing the origins of agonist and antagonist muscles. Neutralizer muscles are important to reduce the odds of developing a muscle injury, since they annul or reduce undesirable actions that may exist in the segment moved by a certain agonist muscle (Pedro Mil Homens, 2005; Rasch, 1989).
2.2.2. Peripheral Nervous Factors
Peripheral nervous factors are related to the processes of sensory innervation of the muscle and the influences deriving from the sensory receptors, which may lead to reflex responses. The proprioceptive receptors involved in this process are mechanic receptors, muscle spindles and Golgi tendon organs (GTO) (Pedro Mil Homens, 2005). Muscle spindles are located inside the muscle and are sensitive to the muscle stretching and length, informing about the speed and level at which the stretch is performed (Powers & Howley, 1997).
GTO are located inside the tendons and have a protective role in high intensity contractions, as they are connected to sensitive fibers which provide information about the level of contraction produced by the muscle (Haff et al., 2016; Powers & Howley, 1997).
32
2.2.3. Articular receptors
Articular receptors are located in the synovial membrane, the articular capsule and ligaments and provide information related to pain, joint positions, speed and amplitude of the movement. These receptors are only activated when the joints are in movement, given that their activity increases with the increment in the speed of the movement. They contribute to the reflex inhibition of antagonist muscles and the facilitation of agonist muscles, which justifies their importance in the prevention of injuries (Pedro Mil Homens, 2005).
2.3. Muscle Strength (MS)
2.3.1. Definition
The definition of strength and the way this term is used have been inconsistent and not consensual. However, it has been widely accepted that strength is the capacity to exert force at any given velocity (Haff et al., 2016).
Kroemer (1970) suggests that strength should be defined as “the maximal force muscles can exert isometrically in a single voluntary effort”, considering that the muscular capacity to apply force is under static conditions. Therefore, strength may be referred as an impulse over a given time, force or torque alone if the effort, static or dynamic, is applied instantaneously (Kroemer, 1970). Although there are numerous definitions created by different authors addressing MS, the concept of strength does not provide useful information without referring which type of strength components is being considered (Pedro Mil Homens, 2005).
2.3.2. Strength Manifestations
The different strength manifestations which can be recognized are: maximal strength, speed strength, which includes rate of force development (or explosive strength) and muscle power, reactive strength, and strength endurance. For the purpose of this study, the maximal
33
strength for both lower and upper limb was measured. Thus, only maximal strength manifestation will be described below.
Maximal strength represents the upper limit of the ability to produce force and is manifested as the highest value of strength that can be produced in one contraction (Taber, Bellon, Abbott, & Bingham, 2016). It is considered to be the major form of strength since it is the component which relies more on muscle mass, influencing all the other expressions of strength. This type of strength should be optimally measured in isometric conditions, although it can still be expressed in a concentric or eccentric way (Pedro Mil Homens, 2005).
Functionally, maximal strength varies a lot in accordance with the muscular action and isometric action seems to be a special form of concentric action in which the speed of the movement equals zero. Sometimes there may exist a strength deficit, which is the difference between the maximal eccentric strength and the maximal concentric strength. The strength deficit indicates the capability of nervous activation (Pedro Mil Homens, 2005). Within maximal strength, absolute and relative strength should also be considered. Absolute strength is the highest value of strength regardless of the person`s body mass and relative strength is the highest value of strength per each unit of body mass (Pedro Mil Homens, 2005).
2.3.3. Measurement of maximal strength
There are several ways to assess MS depending on the main objective of the test. For the purpose of this study, which was testing maximal strength, it was used a maximum voluntary isometric contraction (MVIC) testing with fixed-load cells (Amundsen, 1990). This is a secure and objective method, which allows testing both strong and weak muscles in the most accurate and reliable way (Amundsen, 1990; Meldrum, Cahalane, Keogan, & Hardiman, 2003). This can be performed in all the major muscle groups of the body, but only one or two muscle groups can be tested at the same time (Amundsen, 1990). The force applied by the
34
individual performing the test creates a voltage, which is converted by computer into Newtons or kilograms (Meldrum et al., 2003). Maximum values are generally seen within 3–4 seconds and standardized verbal encouragement should be given during each trial (Meldrum et al., 2003).
This method allows the observation of different components of maximal muscle contraction: reaction time, rise time, peak force, and fatigue (Amundsen, 1990). Reaction time is the delay time that occurs between the time when stimulus is recognized until the activation of the contractile mechanism and lasts less than 0.4 seconds in younger healthy participants (Amundsen, 1990). Rise time, represented by the rate of recruitment of motor neurons, which is influenced by the muscle fiber types recruited, lasts normally 0.3 seconds and is highly influenced by motivation and learning (Amundsen, 1990). Peak force is the index of maximal voluntary MS and depends on the ability of the central nervous system to send enough impulses at high frequencies to synchronize as many motor neurons as possible (Amundsen, 1990). It involves factors such as motivation, experience, muscle mass and muscle fiber type (Amundsen, 1990). At last, fatigue stands for the rate of the decrease in force and represents an index of absolute endurance for the single muscle contraction (Amundsen, 1990).
3. Association between phase angle (PhA) and muscle strength (MS)
Low skeletal muscle mass and strength are associated with shorter survival rates. It has been observed by some authors that, independently of factors such as age, PhA is positively correlated with muscle function, which includes MS, capability to perform daily activities, and muscle mass (Basile et al., 2014; Beberashvili et al., 2014; Norman et al., 2012; Norman et al., 2010). There are reports showing that higher values of PhA exist in parallel with higher MS values. These evidence suggest that PhA is a useful predictor of muscle dysfunction (Beberashvili et al., 2014), as low levels of PhA are highly related to a reduction in muscle
35
mass and strength (Basile et al., 2014). Previous studies have found that PhA had a strong association with muscle function parameters, particularly hand grip strength and knee extension (Norman et al., 2012; Norman et al., 2010). Also, a different study observed that after a period of detraining, both PhA and MS decreased in older women (Dos Santos et al., 2016). Because of the significant relation found between PhA and muscle function, PhA may be an important biomarker to detect situations of sarcopenia in older adults (Basile et al., 2014; Norman et al., 2012; Tomeleri et al., 2018). The optimal PhA cut-off value to detect sarcopenia seems to be ≤ 4.55º (Kilic et al., 2017). Therefore, it seems evident that the leading role of exercise in improving general health is through the increase of muscle mass and strength, and therefore PhA.
4. Sedentary Behaviour (SB)
4.1. Background and Definition
According to Sedentary Behaviour Research (2012), SB is defined as any waking behaviour characterized by an energy expenditure ranging from 1.0–1.5 METs (metabolic equivalents or multiples of the basal metabolic rate) in a sitting or reclining position. SBs are characterized by relatively low energy expenditure, with lack or absence of muscular contraction (Sedentary Behaviour Research, 2012).
The evolution of industrialization and technology have been leading people to spend more time in SBs, essentially sitting, causing adverse outcomes, such as the significant decrease of movement performed by the large skeletal muscles in the legs, back and trunk which are required for upright movement (Hamilton et al., 2007; Hill et al., 2003; Lanningham-Foster et al., 2003).
It is well known that most SBs involve sitting for extended periods (Katzmarzyk et al., 2009). Although the total time spent in SB is important, the way in which it is accumulated
36
seems to highly contribute to the negative effects on health (Healy, Dunstan, et al., 2008). Generally, there are two different patterns of SB: continuous, in which people accumulate prolonged and uninterrupted periods of SB; and discontinuous, with the interruption of SB, even if the breaks are short (Judice, Silva, Santos, Baptista, & Sardinha, 2015; Tremblay et al., 2017).
4.2. Prevalence
Bauman et al (2018) objectively measured time spent in SB and found that adults spend an average 8.2 h/d and older adults spend more time in SB compared to adults overall (A. E. Bauman et al., 2018). This goes according to the findings of Harvey et al (2013), who objectively measured SB in older adults, determining that about 67% were sedentary for more than 8.5h in their waking day (Harvey, Chastin, & Skelton, 2013). A more recent systematic review concluded that older adults spent a total sitting time of ~9.4 h, recorded objectively by accelerometers (Harvey, Chastin, & Skelton, 2015).
An epidemiologic study using the International Physical Activity Questionnaire (IPAQ) to measure the prevalence of sitting time in 20 countries, provides evidence that, generally, people spend around 346.2 minutes per day in a seated position (interquartile range from 180 to 480 minutes), which is equal to about 5 to 6 hours a day (A. Bauman et al., 2011).
Bauman et al. (2011) found that, between 20 countries (study mentioned above), Portugal is one of the countries reporting the lowest amount of sitting, having about 50% of the total sample representing the first quintile (0-179 minutes a day) (A. Bauman et al., 2011). A study from 2018 collected data from a representative sample of the noninstitutionalized population of Portugal (10 to 102 years old) and observed that older adults, in comparison to other age groups, spent larger amounts of sedentary time considering bouts of ≥ 30 min. Of
37
total sedentary time, 33% was spent by older women and 39% by older men (Santos et al., 2018).
4.3. Impact of Sedentary Behaviour on health outcomes
It is well known that the adoption of SBs is highly associated with health risks (van Uffelen et al., 2010). Thus, lifestyle modifications are of great importance and may effectively attenuate the deleterious effects of spending prolonged time in these behaviours (Dempsey, Owen, Biddle, & Dunstan, 2014). Despite all the existing research, more investigation is needed to extend the findings to all populations and predict how much SB impact health (Craft et al., 2012).A review of the harms that emerge as a consequence of SB will be presented bellow according to the study category: observational studies, experimental studies and systematic reviews and meta-analysis.
4.3.1. Observational Studies
Authors who conducted observational studies reported that SB can dangerously increase waist circumference, total cholesterol, LDL cholesterol and triglycerides, and also the risk of insulin resistance, metabolic syndrome and mortality from all causes (Healy, Wijndaele, et al., 2008; Katzmarzyk et al., 2009; van der Berg et al., 2016). Each increase of one h/d in time spent in SB seems to be associated with an increased risk of mortality from all causes, except cancer (Wijndaele et al., 2011). Also, women who spend less than half of their daily time sitting have a reduction in the risk of all-cause mortality compared with those who spend more than half of their day sitting (Weller & Corey, 1998). A recent study (2018) used a sample of regularly active adults and implemented a short-term reduction in physical activity, specifically in the amount of daily steps, with increased sedentary time. They found deleterious effects, such as lower whole-body insulin sensitivity, muscle insulin sensitivity index,
38
cardiorespiratory fitness, limb lean mass and higher total body fat, liver fat and LDL-cholesterol (Bowden Davies et al., 2018).
A study on older adults found that for each hour increment in sedentary time, there is a 48% increment in the probability of being abdominally obese (Judice, Silva, & Sardinha, 2015). When considering breaks, for each additional hourly break in sedentary time, there is a 7% decrease in the odds for abdominal obesity in older women (Judice, Silva, Santos, et al., 2015). Also concerning older adults, regardless of physical activity, each 1h increment in sitting time seems to lead to an increase of 33% in the risk of sarcopenia. TV viewing time, specifically, is associated with reduced total and leg muscle mass (Gianoudis, Bailey, & Daly, 2015).
4.3.2. Experimental Studies
Comparing continuous sitting to standing in desk-based workers, authors found that standing helps attenuate blood glucose by 43% and increases substantially energy expenditure. This suggests that avoiding SB could contribute to the enhancement of insulin sensitivity and the reduction of the risk of cardiometabolic diseases (Buckley, Mellor, Morris, & Joseph, 2014). In similar intervention, sitting time was compared with short bouts of light and moderate intensity walking in overweight/obese adults (Dunstan et al., 2012) and postmenopausal women (Henson et al., 2016). The results showed that interrupting SB helped to decrease postprandial glucose and insulin levels, improve glucose metabolism and reduce cardiovascular risk (Dunstan et al., 2012; Henson et al., 2016). A Randomized Controlled Trial (RCT) used a sample of sedentary men and women and found that adults who engage in regular, long bouts of walking significantly enhanced feelings of vigour and activity, decreased SB, reduced percent body fat, and had more energy along with less tension and anxiety (Osei-Tutu & Campagna, 2005).
39
Judice et al. (2016) (Judice, Hamilton, Sardinha, Zderic, & Silva, 2016) quantified the metabolic/energy cost (MEC) (5 min condition) of three conditions (sitting, standing, sit/stand transition) using standing desks and related that for every 10 sit/stand transitions (sit to stand followed by a stand to sit movement), the metabolic rate is increased modestly (~3.2 kcals) but significantly above sitting. They found that working at a standing desk may produce a significant rise in energy expenditure compared with sitting.
4.3.3. Systematic Reviews and Meta-analysis
Wilmot et al. (2012) observed that, independently of physical activity, SB was associated with a 112% increase in the relative risk of diabetes, 147% increase in the risk of cardiovascular disease, 90% increase in the risk of cardiovascular mortality and 49% increase in the risk of all-cause mortality (Wilmot et al., 2012). Different systematic reviews stated similar findings - regardless of physical activity, SB appears to be a distinct risk factor for multiple health outcomes, such as premature mortality, specifically all-cause and CVD-related mortality, site-specific cancer, relative risk of type 2 diabetes, mental disorders, hypertension, and adiposity impairments (obesity or overweight) (Groeneveld, Proper, van der Beek, Hildebrandt, & van Mechelen, 2010; Thorp, Owen, Neuhaus, & Dunstan, 2011). Chau et al. (2013) observed in their meta-analysis that every hour of daily sitting time was associated with a 2% increase in all-cause mortality risk, which increased to 5% for those sitting >7 hours/day, although this association was attenuated in the presence of MVPA (Chau et al., 2013).
A more recent systematic review and meta-analysis concluded that, irrespective of physical activity, total sitting and TV viewing are positively associated with an increased risk for all-cause and CVD mortality (stronger for volumes greater than 6-8 h/day of total sitting and 3-4 h/day of TV viewing), and likelihood of type 2 diabetes (Patterson et al., 2018).
40
Between 43 studies (17 case-control and 13 prospective studies), 17 examined the associations between occupational sitting and cancer and found positive associations with risk of breast cancer, ovarian cancer and colon or rectal cancer (van Uffelen et al., 2010).
5. Physical (In)Activity
5.1. Definition and Recommendations
Caspersen et al (1985) defined physical activity as any bodily movement produced by skeletal muscles above resting levels, which may be measured in kilocalories and expressed as a rate (kcal per unit time) that varies continuously from low to high. In daily life it is possible to find physical activity in diverse activities, such as occupational activities, sports, conditioning, household tasks or others (Caspersen, Powell, & Christenson, 1985).
American College of Sports Medicine (ACSM) provided a recommendation for physical activity, which should be the weekly accumulation of at least 150 minutes of at least moderated physical activity, or 75 minutes of vigorous physical activity, or a combination of both (American College of Sports, Riebe, Ehrman, Liguori, & Magal, 2018).
In Portugal, there is a prevalence of 70% of adults between 18-64 years old attaining the recommendations for physical activity. About 35% of people older than 64 years reaches the recommendations of 30 minutes of physical activity, with a prevalence of 46% for men and 29% for women (Baptista et al., 2012).
The engagement in physical activity regularly is highly important to reduce the risk of premature death and to prevent, primarily and secondarily, several chronic diseases, such as diabetes mellitus, hypertension, obesity, osteoporosis, cancer, depression and all-cause and cardiovascular-related death. People who surpass the recommendations for physical activity are more likely to achieve further gains in their health status (Warburton, Nicol, & Bredin, 2006). This is also valid in overweight and obese individuals – those who are inactive and unfit
41
have higher rates of disease and premature death compared to those who are active and fit (Blair & Brodney, 1999). However, it seems that people who are inactive and become physically active have the greatest improvements in health. Sometimes, increasing physical activity levels may enhance indicators of health status without inducing changes in fitness performance, which is very typical in older people (Warburton et al., 2006).
Considering physical inactivity, accordingly to the WHO, in 2008, around 31% of adults (15 years or older) were insufficiently active (28% men and 34% women). As a consequence of inactivity, about 3,2 million deaths occur each year (WHO, 2008). In 2009, the WHO identified physical inactivity as the fourth leading risk factor for global mortality (WHO, 2009, 2010). More recently, in 2011, the overall prevalence of physical inactivity was 21.4% and 17.4% after weighting for the total population of each country (Dumith, Hallal, Reis, & Kohl, 2011). One out of five adults around the world was physically inactive and it tends to increase with age. In addition, women are more likely to be inactive than men in most countries (80%) (Dumith et al., 2011).
5.2. Confusion between physical inactivity and sedentary
The term ‘sedentary’ can be misleadingly described as nonparticipation in moderate-to-vigorous activity (MVPA), which means it would represent the lower end of the physical activity continuance (Dempsey et al., 2014). Therefore, it is suggested by Sedentary Behaviour Research (2012) that authors use the term “inactive” to describe people who do not accumulate sufficient amounts of MVPA (i.e., not meeting specified physical activity guidelines).
Ekblom-Bak et al. (2010) showed how MVPA, light-intensity activity, and sedentary time are related and manifested in real life. A large part of the adult populations do not engage in MVPA and spend much of their waking hours sitting, which means they are both “sedentary and inactive” (Ekblom-Bak, Ekblom, & Hellenius, 2010). However, people can be “sedentary
42
and active”: for example people who work all day in a seated position but exercise in some part of the day (Healy, Wijndaele, et al., 2008). A less common behaviour pattern is being “peripatetic and inactive”, in which the individual is not participating in MVPA, but sits very little time throughout the day. This seems to be the most realistic strategy to adopt, at least initially, given the fact that most of populations are highly sedentary. For optimal health outcomes, the best condition would be being “peripatetic and active”, having reduced levels of sedentary time, specially sitting, and sufficient amounts of MVPA (Ekblom-Bak et al., 2010).
6. Detraining
6.1. Definition and general effects on health
Detraining may be defined as the partial or complete loss of training-induced physiological, anatomical adaptations and athletic performance, in response to an insufficient or inexistent training stimulus (Fleck, 1994; Mujika & Padilla, 2000). The consequences of detraining rely on specific characteristics, such as its duration, frequency and intensity (Fleck, 1994; Mujika & Padilla, 2000). Although there are well-known benefits from exercise training, it is very common for older adults to voluntary engage in training cessation, whether is due to the participation in extended holidays, volunteering, or family commitments. Also, dependent older adults with advanced morbidity may be forced to be inactive (Henwood & Taaffe, 2008). Besides the consequences observed on physiological and physique markers (e.g. body composition, lipids, insulin sensitivity, bioelectric parameters, cardiometabolic markers) (Bowden Davies et al., 2018), after a period of detraining, it is possible to observe losses in the endurance capabilities, such as VO2 max, due to different mechanisms (e.g reduced stroke
volume, cardiac output, blood volume, cardiac hypertrophy and contractility, etc.), and losses in the skeletal muscle, which results in a decrease in MS and muscle power (Fleck, 1994).