Introduction
Respiratory muscle strength is an important variable for evaluating the respiratory health of people with disabilities, especially in subjects who have some form of muscle dysfunction generating trunk instability. Apart from being related to postural control, trunk muscles are responsible for the rib cage motion and the pressure difference that ensures proper air low in and out of the lungs during the breathing process. A dysfunction in this process could predispose the subject to develop some pulmonary diseases such as atelectasis and pneumonia1. In view of the respiratory alter-ations and their aggravation resulting from a sedentary lifestyle, participation in physical activity and sports has been encouraged as a means of health promotion among people with disabilities2. Meanwhile, the respiratory system has also been described as a limiting factor in the aerobic performance of highly-trained ath-letes. These limitations are related to increased respiratory work, exercise-induced arterial hypoxemia, respiratory muscle fatigue, and dyspnea3. The increase in respiratory rate, tidal volume, and minute volume; particularly in sustained exercises that exceed 85% of the maximal oxygen uptake (VO2 max)—generates a greater metabolic demand on the inspiratory muscles, especially in the diaphragm, and can lead to muscle fatigue in some cases4.
The increase in the inspiratory muscle work during physical exercises also generates a greater activation of metaborelex. The major activation of this relex leads to speciic adaptations in the blood low circulation, which cause the redirection of peripheral blood low from the limbs to the diaphragm and other inspiratory muscles5. Therefore, the exacerbation of this mechanism could decline the exercise performance of well-trained subjects6,7.
In search of strategies to improve aerobic performance, speciic inspiratory muscle training programs have been developed, the aims of which are to postpone or prevent inspiratory muscle fatigue and reduce the blood low redirection from the limb muscles8. However, divergent results have been found with regards the effectiveness of this strategy of training among wheelchair athletes9-11.
Thus far, only one study has reported the behavior of respira-tory muscle strength (inspirarespira-tory and expirarespira-tory) in wheelchair basketball players (WCBPs)12. However, this study only report-ed the respiratory muscle strength of paraplegic athletes without assessing subjects with other types of disabilities.
Thus, considering the importance of respiratory muscle strength to the exercise performance of athletes and the relevance of evaluating the respiratory health of people with disabilities, the aims of this study are to (1) evaluate the respiratory muscle strength and the aerobic Original article (full paper)
Respiratory muscle strength and aerobic
performance of wheelchair basketball players
Raphael N. Pereira Marcos Fabio R. Abreu
Camila B. Gonçalves
Universidade Metodista de Piracicaba, Piracicaba, Brasil
Wilson Flávio S. Corrêa
Clube dos Deicientes Físicos do Pará – “All Star Rodas”, Pará, Brasil
Daniel R. Mizuhira
Associação dos Amigos Paradesportistas de Piracicaba, Piracicaba, Brasil
Marlene A. Moreno
Universidade Metodista de Piracicaba, Piracicaba, Brasil
Abstract––The respiratory system has been described as a limiting factor in the performance of athletes. Therefore, the objective of this study was to evaluate the relationship between the respiratory muscle strength (RMS) and aerobic performance of wheelchair basketball players (WCBPs). We evaluated 19 male WCBPs who were divided into two groups: trunk control group (TCG) and without trunk control group (WTCG). All participants underwent a pulmonary function test, evaluation of maximal inspiratory (MIP) and expiratory (MEP) pressures, and an aerobic performance test. The MIP of both groups and the MEP values of TCG exceeded the predicted values for age and gender. No differences were observed in the MIP and aerobic performance between the groups although a difference was observed in the MEP values. Positive correlations were observed between MIP/MEP and the aerobic performance for both groups. These results suggested that the overall RMS of this group of WCBPs fell within or above the predicted values. Hence, the study concluded that RMS can positively inluence the aerobic performance of WCBP.
performance of WCBPs and (2) compare the obtained values of inspiratory muscle strength (IMS) and expira-tory muscle strength (EMS) with the predicted values by equation. Moreover, the respective relationships between IMS and EMS and the aerobic performances of these subjects are also assessed.
Methods
Study design
This is a clinical trial with an observational and cross-sec-tional design.
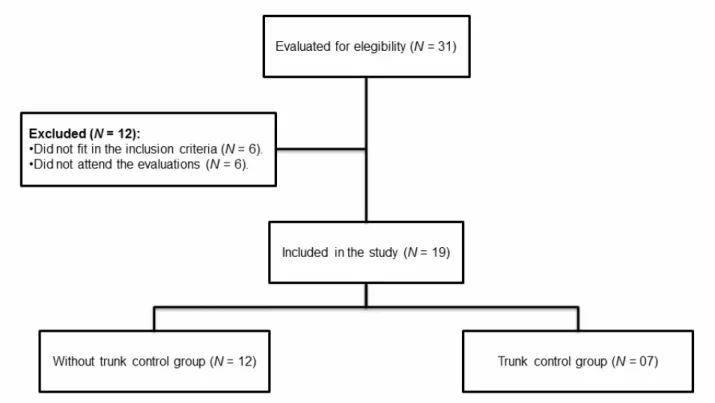
Participants
Thirty-one male WCBPs were considered for participa-tion, of which 19 were eventually selected. Inclusion criteria were as follows: male and training for WCB for more than one year. Exclusion criteria included smoking and/or the presence of cardiovascular, respiratory, motor or cognitive alterations that make it impossible to perform the research procedures.
WCB training sessions took place three to ive times per week for 3–5 h each and included physical training and coach-ing on techniques and tactics. The traincoach-ing involved stretchcoach-ing and resistance exercises as well as cardiovascular resistance; the WCB resistance training focused on the arm, shoulder, and trunk musculature.
Apart from physical training, the athletes were in-volved in technical and tactical training speciic to WCB. Approximately 60% of the sessions were dedicated to prac-tice games and tactical positioning, while 40% of the sessions focused on speciic activities, such as shooting, passing, and obstacle courses.
The participants were divided into two groups according to functional classiication score, as suggested by the International Wheelchair Basketball Federation (IWBF): without trunk con-trol group (WTCG, N = 12, functional classiication from 1.0 to 2.5) and with trunk control group (TCG, N = 07, functional classiication from 3.0 to 4.5) (Figure 1). The IWBF functional classiication for group division was chosen because this process also indirectly evaluated some respiratory muscle functions. Some of these muscles also acted as postural muscles (e.g., sternocleidomastoid, trapezius [upper ibers], pectoralis minor, serratus anterior and posterior superior, and rib lifters muscles). The characteristics of the participants and the etiologies of their respective disabilities are described in Table 1.
Table 1. Characteristics of the subjects.
WTCG TCG p value
N 12 7
Age (years) Mean 31.67 30.00 0.64
SD 8.15 6.06
Body mass (kg) Mean 65.41 68.99 0.64
SD 16.16 14.90
Height (m)* Mean 1.59 1.55 0.90
SD 0.17 0.24
Time of disability (years)
Mean 17.23 22.67 0.31
SD 10.14 11.69
Training experience (years)
Mean 5.14 7.91 0.21
SD 4.67 4.74
Training volume (hours/week)
Mean 23.50 18.00 0.45
SD 10.32 11.22
IWBF basketball
classiication 1.0 – 2.5 3.0 – 4.5
Etiology of physical disabilities
SCI (T4–L5) 7 1
Spina biida 2 1
Polio 1 1
Congenital malformation 1 2
Unilateral amputation 0 2
Arthrogryposis multiplex 1 0
Note. WTCG = without trunk control group; TCG = with trunk control group; IWBF = International Wheelchair Basketball Federation; SCI = spinal cord injury; (T4–L5) = level of SCI; p value = comparison between WTCG vs. TCG; * non-parametric data. (Data presented as mean and standard
deviation [SD]).
All participants were informed about the study’s relevance and procedures. After agreeing to participate, they were asked to sign an informed consent form. This study was approved by the research Ethics Committee of the involved institution (protocol number 57/13).
Procedures
All subjects underwent a 48-hour period of rest (without training) prior to the evaluation protocol. An interview was con-ducted to collect data about the volunteers’ health and to verify their eligibility. After this interview, the evaluation protocol was carried out on two consecutive days. On the irst day, the respi -ratory variables were evaluated with a pulmonary function test and maximal respiratory pressure measurements (inspiratory and expiratory). On the second day, (24 h after the irst evaluation procedures) we assessed the participants’ aerobic performance by using the 12-minute aerobic test for wheelchair users.
Pulmonary function test
The pulmonary function tests were carried out with a spirom-eter (Easy one, ndd Medizintechnik AG, Zurich, Switzerland) according to the American Thoracic Society (ATS) guidelines
for technique, acceptability, and reproducibility13. The device was calibrated before each test according to the manufacturer’s instructions. Spirometric variables were recorded and expressed in body temperature and pressure as well as saturated conditions.
The measurement protocol was as follows. First, we care-fully described the procedures to them, after which the subjects rested for 10 min. The examination then began with the subjects seated upright (90º hip lexion angle) in their own wheelchair with their heads in neutral position and wearing a nose clip to avoid air leakage through the nostrils. The mouthpiece was correctly placed over each subject’s mouth to avoid air leakage.
The force vital capacity (FVC) maneuver was carried out. For this maneuver, the subjects were instructed to maximally inspire and then exhale completely with maximum effort. The participants were verbally encouraged to exhale forcibly until the end of the maneuver. Expiration was interrupted after 6 s.
Each maneuver was carried out until three acceptable and two reproducible curves were obtained without exceeding eight attempts. During the maneuvers, real-time graphics of the curves were shown to them, indicating whether they met the acceptance criteria proposed by the ATS13.
The tests were superimposed automatically in the equipment, which made it easier to verify their reproducibility. Thus, after the acceptance criteria were fulilled, the curves were classiied according to reproducibility, with the maximal differences for FVC and FEV1 in the two best curves (i.e., 5% or 150 mL) being considered for analysis. Tests that exceeded these limits were excluded. The curves were analyzed by using two evaluators, and those considered technically inappropriate were excluded from the analysis. After the acceptability and reproducibility criteria were met, the highest values of the studied variables were recorded.
The absolute values were obtained based on spirometric tests and the percentages of the predicted values for age and gender of both groups for FVC and the volume exhaled during the irst second of a forced expiratory maneuver (FEV1). Based on the equations for healthy subjects, which were developed by previous study for use as guidelines in pulmonary function tests, equations were used to predict normal values so as to verify the presence of ventilator dysfunctions and thus characterize the population14.
Respiratory muscle strength
The respiratory muscle strength values were obtained by measuring maximal inspiratory and expiratory pressures (MIP and MEP) with an analog manometer (Ger-ar®, São Paulo, Brazil) scaled in cmH2O with an operational limit of ± 300 cmH2O.
performed, of which three had to be acceptable and reproduc-ible (difference of less than 10%); a one-minute rest interval was given between each maneuver. The inspiratory and ex-piratory efforts had to be sustained for at least one second, and the highest values obtained were recorded for subsequent analysis15. The maximal predicted respiratory pressures were calculated in absolute values and percentages for each volun-teer using equations15.
Aerobic performance test
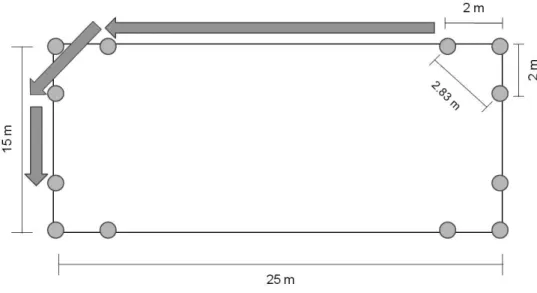
To evaluate each participant’s aerobic performance, the 12-minute test for wheelchair users was conducted in a covered multisport court. A rectangle measuring 25 × 15 meters (m) was marked on the court. A total of 12 cones were placed on the rectangular space: four cones were placed at each corner and the remaining eight cones were spaced every 2 m, forming a rect-angle with a perimeter of 75.32 m. Figure 2 shows the test area.
Figure 2. Test area for the 12-minute aerobic test.
The participants’ resting cardiopulmonary variables were checked before conducting the test. Blood pressure (BP) was measured with the auscultation method, heart rate (HR) with a Polar RS800CX® heart rate monitor (Polar Electro Co.Ltda. Kempele, Oulu, Finland), and peripheral oxygen saturation (SpO2) with pulse oximetry (Solmedica MD300C1 oximeter, Beijing Choice Eletronic Tech. Co., Ltd.). Subjective perception of effort was measured by using the Borg scale (CR-10).
After completing these procedures, the test was initiated, during which the participants were instructed to follow the marked track, turn strategically to maintain velocity, and cover the greatest distance possible within 12 min. The test began and ended with a beep, and standardized verbal encouragement was given each minute by the same evaluator (e.g., “2 min have passed and you are doing very well, keep it up”).
At the end of the test, in addition to calculating the total distance covered, the previously mentioned cardiopulmonary variables were measured again. The estimated VO2 max reached was then calculated according to a previous method16.
Statistical analysis
The statistical procedures were carried out using Bioestat v.5.0. The Shapiro-Wilk test was conducted to analyze the normality of the data distribution. Student’s t-test was used
for parametric data, and the Mann-Whitney test was used to compare non-parametric data.
To measure the effect size, Cohen’s d was calculated by using the Effect Size Generator 2.3 software (Swinburne University of Technology, Center for Neuropsychology, Melbourne, Australia). The threshold values for effect size statistics were 0.2, 0.5, and 0.8 for small, medium, and large effect sizes, respectively17.
Pearson’s linear correlation coeficient was used to analyze the relationship between variables. All results were described as means and standard deviation, and the signiicance level adopted for all analyses was 5%.
Results
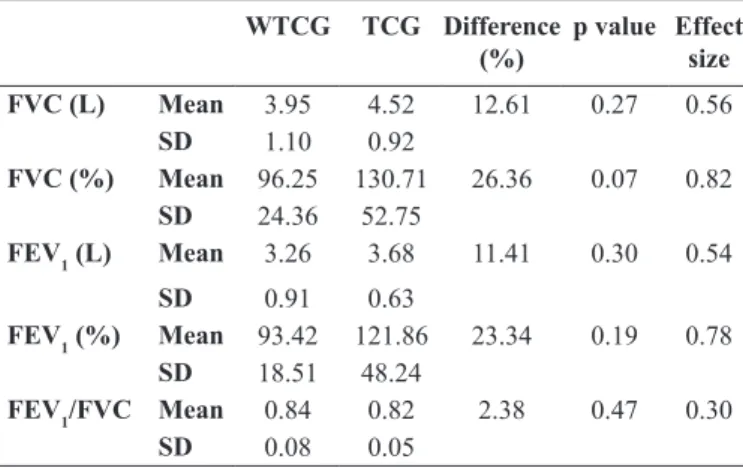
Table 2 presents the relative and absolute values of the spi-rometric variables. Neither of the groups presented restrictive or obstructive pulmonary disease. In both groups, values that were over 80% of the predicted were found for all variables. A small effect size was found for small to FEV1/FVC; medium to FVC (L), FEV1 (L), and FEV1 (%); and large to FVC (%) comparisons.
MEP, the values obtained in the TCG were signiicantly higher than the predicted values, with large effect size. Meanwhile, the WTCG presented no signiicant difference for this variable and showed medium effect size for this comparison.
Table 2. Absolute and relative values obtained from the pulmonary function test.
WTCG TCG Difference (%)
p value Effect size
FVC (L) Mean 3.95 4.52 12.61 0.27 0.56
SD 1.10 0.92
FVC (%) Mean 96.25 130.71 26.36 0.07 0.82 SD 24.36 52.75
FEV1 (L) Mean 3.26 3.68 11.41 0.30 0.54
SD 0.91 0.63
FEV1 (%) Mean 93.42 121.86 23.34 0.19 0.78 SD 18.51 48.24
FEV1/FVC Mean 0.84 0.82 2.38 0.47 0.30
SD 0.08 0.05
Note. WTCG = without trunk control group; TCG = with trunk control group; p value = comparison between WTCG vs. TCG; FVC = forced vital capacity; FEV1 = forced expired volume after 1 second. (Data presented as
mean and standard deviation [SD]).
Table 3. Comparison between obtained and predicted values of maxi-mal inspiratory and expiratory pressures in both groups.
Group Obtained (cmH2O)
Predicted (cmH2O)
Differ-ence (%)
p value (Obtained vs. Predicted) MIP WTCG Mean 157.50 129.97 17.48 0.04
SD 40.82 6.52
TCG Mean 180.00 131.30 27.06 0.04
SD 49.75 4.84
MEP WTCG Mean 166.25 139.35 16.18 0.19
SD 66.34 6.60
TCG Mean 237.14 141.00 40.54 0.002
SD 50.57 4.90
Note. MIP = maximal inspiratory pressure. MEP = maximal expiratory pressure. WTCG = without trunk control group. TCG = with trunk control group. P value = comparison between Obtained vs. Predicted values of MIP
and MEP. (Data presented as mean and standard deviation [SD]).
Table 4 presents the comparisons of obtained values for maximal respiratory pressure and the variables of the aerobic performance test. Signiicant difference was found only between MEP values, which had a large effect size. The other variables showed small (MIP; ∆ Diastolic blood pressure; Final SpO2), medium (∆ Systolic blood pressure and Final Borg scale), and large effect sizes (∆ Heart rate and VO2 max).
Table 4. Comparison of respiratory pressure obtained values and of the 12-minute aerobic test result between the two groups.
WTCG TCG Difference (%) p value Effect size
Obtained MIP (cmH2O) Mean 157.50 180.00 12.50 0.30 0.49
SD 40.82 49.75
Obtained MEP (cmH2O) Mean 166.25 237.14 29.89 0.03 1.20
SD 66.34 50.57
Distance covered (m) Mean 2055.81 2275.55 9.66 0.09 0.88
SD 261.91 238.69
∆ Heart rate Mean 102.33 88.71 13.31 0.08 0.84
SD 13.24 18.58
∆ SBP (mmHg)* Mean 30.00 39.29 23.64 0.42 0.52
SD 12.06 22.07
∆ DBP (mmHg) Mean - 9.17 - 6.43 29.88 0.73 0.17
SD 18.81 11.80
Final SpO2 (%)* Mean 97.75 97.86 0.11 0.87 0.18
SD 0.75 0.38
Final Borg scale (0–10)* Mean 8.83 9.43 6.36 0.22 0.65
SD 1.03 0.79
VO2 max (ml/kg/min) Mean 26.94 31.00 13.10 0.09 0.88
SD 4.83 4.40
Note. MIP = maximal inspiratory pressure; MEP = maximal expiratory pressure; WTCG = without trunk control group; TCG = with trunk control group;
∆ Heart rate = variation in the heart rate values before and after the exercise test; ∆ SBP = variation in the systolic blood pressure values before and after the exercise test; ∆ DBP = variation in the diastolic blood pressure values before and after the exercise test; SpO2 = peripheral oxygen saturation at the
end of the test; VO2 max = maximal oxygen uptake; p value = comparison between WTCG vs. TCG; * non-parametric data. (Data presented as mean and
standard deviation [SD]).
Regarding the correlations between distance covered in the aerobic performance test and the maximal respiratory pressures, the WTCG showed positive correlations for both MIP (r = 0.60; R2 = 0.36; p = 0.04) and MEP (r = 0.35; R2 =
Figure 3. Correlations between the distances covered in the aerobic performance test and the maximum inspiratory pressure (MIP) and maximum expiratory pressure (MEP).
a) Correlation between the distances covered and MIP in the WTCG; b) Correlation between the distances covered and MEP in the WTCG; c) Correlation between the distances covered and MIP in the TCG; d) Correlation between the distances covered and MEP in the TCG.
Discussion
The pulmonary function test revealed that both groups did not present ventilatory disorders. Several authors have indicated the relevance of spinal cord injury (SCI) in decreased pulmonary function resulting from alterations in the mechanics of respirato-ry muscles1,12,18,19. In addition, evidence showed a decline in the pulmonary function of subjects with SCI, which they attributed to higher body mass index, lower inspiratory muscle strength, and declined levels of physical itness20. In another study, it was demonstrated values of 2.67 ± 0.83 and 3.10 ± 1.10 L for FVC at the baseline of intervention and control groups of sedentary subjects with SCI, respectively; they also reported FEV1 values of 2.11 ± 0.68 and 2.18 ± 0.75 L for these two groups21. In the present study, we found values that exceeded those reported in the abovementioned studies.
Regarding Paralympic athletes without SCI, only a single study has reported the pulmonary function of these subjects at the baseline22. It was found values of 4.74 ± 0.77 L for FVC and 4.10 ± 0.68 L for FEV1 at the baseline of a group of highly trained subjects from the Swiss Paralympic team with single-limb amputation or blindness. These values are almost similar to the variables reported in the present study. However, caution must be taken when comparing these data, because in the present study, we investigated subjects who trained in just one speciic sport modality whereas Osthoff22 did not specify the sports modality of their volunteers.
These indings suggest that the WCB regular training could preserve the pulmonary function of the present study’s subjects.
Indeed, WCBPs make ample use of the upper limb and trunk muscles both for wheelchair propulsion and for throwing the ball during the matches23-25. Some of these muscles involved in the stabilization, positioning, and execution of upper limb; trunk movements also act as the accessory muscles facilitating the inspiratory and expiratory processes. Therefore, the training of these muscles during the WCB practice may have helped prevent alterations in respiratory mechanics and, consequently, in the pulmonary function of these subjects, especially in those who had SCI.
In the present study, the level of the participants’ SCI fell between T4 and L5. According to the literature, this should indicate a reduced functioning of the intercostal muscles, which have innervations originating in the spinal roots from T1 to T111. According to De Troyer26, alterations in intercostal muscle function may lead to decreased IMS and consequent decreases in thoracic expansibility. However, in the current study, the obtained MIP values were higher than the predicted values, and similar values were obtained in both groups.
equation in tetraplegics who trained in wheelchair rugby (MIP = 113.7 ± 35.5) and paraplegics who trained in WCB (MIP = 112.2 ± 23.3)12.In that same study, however, the subjects showed MEP values that were lower than the predicted ones (MEP = 73.7 ± 20.7 cmH2O for the wheelchair rugby athletes group [tetraplegics]; MEP = 105.6 ± 34.3 cmH2O for the WBC group [paraplegics]).
Regarding the respiratory muscle strength, several authors investigated its comportment in able-bodied trained subjects and showed values that are below those reported in the present study. One study found values of 129.1 ± 16.5 cmH2O for the MIP at the baseline when they studied the effects of inspiratory muscle training in 17 competitive male rowers27. More recently, it was reported baseline values of 115 ± 26 and 117 ± 30 cmH2O for the MIP of the experimental and control group, respectively, in 16 club-level competitive swimmers28.
The indings of the present study are in agreement with those described by Moreno12 and could also be attributed to the previously described training of the accessory muscles during the WCB practice. Moreover, some of scapular girdle muscles act in upper limb movement and stabilization and serve as accessory muscles in the forced inspiration process23-25,29. The constant utilization of these muscles during the WCB training may have resulted in adaptations in their functions and morphol-ogies, which culminated in a greater capacity to generate force. Regarding MEP behavior, the obtained values were higher than the predicted values only in the TCG. This group’s ob-tained values were higher than those of the WTCG. The natural process of expiration does not require muscular activity and only requires a difference between the pulmonary and external pressures. However, during forced expiration, muscles located in the thoracic (pectoralis major) and trunk (abdominals) regions actively assist the increase of expiratory low and the delation of the lungs30,31. Maintaining abdominal muscle functionality is linked with preserving trunk control. The maintenance of trunk control is one of the most important behaviors in the IWBF functional classiication. Greater trunk stabilization and angular movements (lexion, extension, lateralization, and rotation) generate greater functional classiication scores32. Therefore, we suggest that the TCG had better trunk control and stabilization owing to their higher functional classiication scores. For this reason, this group’s MEP values exceeded the predicted ones and were even higher than the WTCG values. This may be attributed to the fact that the TCG had better abdominal muscle function and strength. It should be noted that the obtained WTCG MEP values were not lower than the predicted values, even though 7 of the 12 volunteers in this group had SCI between T4 and L5, suggesting the possible functional impairment of the abdominal muscles. These inding may also be attributed to the regular training of WCBPs, as previously suggested by Moreno12.
Additionally, similarities in distance covered and VO2 max were observed in the aerobic test results of the two groups. Leicht,33 detected a mean VO
2peak of 24.5 mL/kg/min for a group of disabled athletes with high SCI (quadriplegics), 34.9 mL/kg/min for a group of disabled athletes with low SCI (para-plegics), and 42 mL/kg/min in a group of disabled athletes with no SCI and greater trunk control. These indings indicate that
a smaller group of muscles utilized during exercise generates lower oxygen uptake, considering that the VO2 max value takes into account the supply, transportation, and the muscular capacity to extract the oxygen.
Our indings agree with other results presented in the literature. Franklin16 observed a VO
2 max of 22 mL/kg
−1/min−1 in a
heteroge-neous group of 30 wheelchair users (25 paraplegics, two with polio, and three amputees) who practiced sports regularly. The distance covered by these individuals in the 12-minute aerobic test ranged from 0.64 to 1.79 miles (1029.68 to 2880.73 meters). Using a multi-stage test, Vanderthommen34 evaluated the aerobic physical performance of a heterogeneous group of wheelchair users who practiced sports and found a VO2peak of 25.3 mL/kg/min. used an adaptation for wheelchair users of the multistage Léger and Boucher test and found a VO2peak of 2.05 l/min−1.
The literature has suggested that SCI type (partial or com-plete) and level can lead to reductions in the muscle mass that are activated during exercise and to alterations in the activation of the autonomous nervous system. In turn, these culminate in decreased aerobic capacity, with lower levels being observed in individuals with high SCI (quadriplegics) than in subjects with lower SCI (paraplegics)33. However, no differences in aerobic performance between the groups were observed in the present study. This inding may be due to the fact that the TCG had fewer participants (n = 7) than the WTCG.
The relationships found in both groups between MIP and distance covered in the aerobic performance test showed a pos-itive and strong correlation, in which 36% and 50% of aerobic performance test results were inluenced by IMS in the WTCG and TCG, respectively. The overloads imposed on inspiratory muscles during an intense exercise activity can limit the aer-obic performance of highly trained athletes as well as healthy non-athletes7,8,36. Thus, the positive relationships founded between IMS and distance covered in the aerobic performance test may be related to the lower activation of the metaborelex induced by the work of the inspiratory muscles. Considering that stronger muscles have a lower oxygen demand, the volunteers who presented better inspiratory muscle performances probably had lower oxygen demands from these muscles during the test, which led to lower amounts of required local blood low. This mechanism may have optimized the blood low distribution to the active muscles of the trunk and upper limbs, which in turn, reduced the pH imbalance caused by the exercise. This, in turn, led to decreased muscle fatigue and sensation of dyspnea, which culminated in better results on the aerobic test.
We did not ind in the literature other studies that cor -related IMS and/or EMS with the aerobic performance of wheelchair athletes. Thus, comparing our results with those of previous studies must be done with caution. Some others limitations were found and should be mentioned. The hetero-geneity of the volunteers and the small sample size, particu-larly in the TCG, could have inluenced the results. First, we have to take into account the dificulty of inding the speciic population being studied study (WBCPs). Nevertheless, the inclusion and exclusion criteria were rigorously followed to minimize possible bias, and all eligible volunteers par-ticipated in the study were included. We propose that future studies try to have a higher number of participants and divide the volunteers according the respective etiologies of their disabilities.
We also have to highlight the fact that the equations used to obtain the predicted values for the respiratory variables were developed for individuals without disabilities, and that no similar equations could be found, which can be adapted for people with physical disabilities. Furthermore, evaluating the metabolic variables and the redirection of blood low during the aerobic performance test could have better clariied the indings of this study.
The choice of the aerobic performance test could also be questioned. An ergospirometry test is often considered the gold standard test in evaluating the athlete’s aerobic perfor-mance. However, owing to the lack of necessary equipment to perform this test, the ield test was chosen because of the daily practice of the athletes and because of their speciic -ity with the sport modal-ity that was studied. We must also consider that the equation used to obtain the VO2 max values took into account the distance covered by the athlete in this test. Moreover, the correlations analysis was also based on the distance covered because this variable can signiicantly predict physical capacity in ield tests.
The lack of a reproducibility evaluation of the aerobic performance test can also be described as a limitation of the present study. The repetition of the test procedures by the subjects generated better results because of the learning effect. Unfortunately, because of the hard training routine of the athletes, we could not accomplish the second test to avoid this learning bias.
In conclusion, neither of the studied groups presented pulmonary alterations of restrictive or obstructive origin, and the inspiratory and expiratory muscle strengths were within or above the values predicted for age and gender. There were no signiicant differences in the inspiratory muscle strength or aerobic performance between the groups; however, the expi-ratory muscle strength of the TCG was greater than that of the WTCG, which could be attributed to greater trunk control and use of abdominal muscles in the former.
In addition, there were positive correlations between the maximal respiratory pressures and the distance covered in the aerobic performance test for both groups. These indings demonstrate that respiratory muscle strength is related to the aerobic performance of these WCBPs.
References
1. Winslow C, Rozovsky J. Effect of spinal cord injury on the re-spiratory system. Am J Phys Med Rehabil 2003; 82(10): 803-14. 2. Scelza WM, Kalpakjian CZ, Zemper ED, Tate DG. Perceived barriers to exercise in people with spinal cord injury. Am J Phys Med Rehabil 2005; 84: 576-83.
3. Wells GD, Norris SR. Assessment of physiological capacities of elite athletes & respiratory limitations to exercise performance. Paediatr Respir Rev, 2009; 10(3): 91-8.
4. Johnson BD, Babcock MA, Suman OE, Dempsey JA. Exercise-induced diaphragmatic fatigue in healthy humans. J Physiol 1993; 460: 385-405.
5. St Croix CM, Morgan BJ, Wetter TJ, Dempsey JA. Fatiguing
inspiratory muscle work causes relex sympathetic activation in
humans. J Physiol 2000; 529: 493-504.
6. Aaron EA, Seow KC, Johnson BD, Dempsey JA. Oxygen cost of exercise hyperpnea: implications for performance. J Appl Physiol (1985), 1992; 72(5): 1818-25.
7. Dempsey JA, McKenzie DC, Haverkamp HC, Eldridge MW. Update in the understanding of respiratory limitations to exercise
performance in it, active adults. Chest 2008; 134(3): 613-22. 8. McConnell AK, Lomax M. The inluence of inspiratory muscle
work history and speciic inspiratory muscle training upon human
limb muscle fatigue. J Physiol 2006; 577(Pt 1): 445-57. 9. Goosey-Tolfrey V, Foden E, Perret C, Degens H. Effects of
in-spiratory muscle training on rein-spiratory function and repetitive sprint performance in wheelchair basketball players. Br J Sports Med 2010; 44(9): 665-68.
10. Litchke LG, Russian CJ, Lloyd LK, Schmidt EA, Price L, Walker
JL. Effects of respiratory resistance training with a concurrent low
device on wheelchair athletes. J Spinal Cord Med 2008; 31(1): 65-71. 11. Vergès S, Flore P, Nantermoz G, Lafaix PA, Wuyam B. Respiratory muscle training in athletes with spinal cord injury. Int J Sports Med 2009; 30(7): 526-32.
12. Moreno MA, Zamunér AR, Paris JV, Teodori RM, Barros RM. Effects of wheelchair sports on respiratory muscle strength and thoracic mobility of individuals with spinal cord injury. Am J Phys Med Rehabil, 2012; 91(6): 470-77.
13. Miller MR, Hankinson J, Brusasco V, Burgos F, Casaburi R, Coates A, et al. Standardisation of spirometry. Eur Respir J, 2005; 26(2): 319-38.
14. Pereira CAC. Diretrizes para Testes de Função Pulmonar. J Pneumol 2002; 28(suppl 3): 1-82.
15. Neder JA, Andreoni S, Lerario MC, Nery LE. Reference values for lung function tests. II. Maximal respiratory pressures and voluntary ventilation. Braz J Med Biol Res 1999; 32(6): 719-27. 16. Franklin BA, Swantek KI, Grais SL, Johnstone KS, Gordon S,
Timmis GC. Field test estimation of maximal oxygen consumption in wheelchair users. Arch Phys Med Rehabil, 1990; 71(8): 574-78. 17. Cohen J. Statistical Power Analysis for the behavioural science.
2nd Edition, Lawrence Earlbaum Associates, 1988.
19. West CR, Campbell IG, Shave RE, Romer LM. Resting cardio-pulmonary function in Paralympic athletes with cervical spinal cord injury. Med Sci Sports Exerc 2012; 44(2): 323-29. 20. Postma K, Haisma JA, de Groot S, Hopman MT, Bergen MP, Stam
HJ, et al. Changes in pulmonary function during the early years after inpatient rehabilitation in persons with spinal cord injury: a prospec-tive cohort study. Arch Phys Med Rehabil 2013; 94(8): 1540-46. 21. Postma K, Haisma JA, Hopman MT, Bergen MP, Stam HJ,
Bussmann JB. Resistive inspiratory muscle training in people with spinal cord injury during inpatient rehabilitation: a randomized controlled trial. Phys Ther 2014; 94(12): 1709-19.
22. Osthoff M, Michel F, Strupler M, Miedinger D, Taegtmeyer AB, Leuppi JD, et al. Bronchial hyperresponsiveness testing in athletes of the Swiss Paralympic team. BMC Sports Sci Med Rehabil 2013; 5(1):7.
23. Kulig K, Newsam CJ, Mulroy SJ, Rao S, Gronley JK, Bontrager EL, et al. The effect of level of spinal cord injury on shoulder joint kinetics during manual wheelchair propulsion. Clin Biomech (Bristol, Avon) 2001; 16(9): 744-51.
24. Mulroy SJ, Farrokhi S, Newsam CJ, Perry J. Effects of spinal cord injury level on the activity of shoulder muscles during wheelchair propulsion: an electromyographic study. Arch Phys Med Rehabil 2004; 85(6): 925-34.
25. Sinnott KA, Milburn P, McNaughton H. Factors associated with thoracic spinal cord injury, lesion level and rotator cuff disorders. Spinal Cord 2000; 38(12): 748-53.
26. De Troyer A, Estenne M, Vincken W. Rib cage motion and muscle use in high tetraplegia. Am Rev Respir Dis, 1986; 133(6): 1115-9. 27. Grifiths LA, McConnell AK. The inluence of inspiratory and
expiratory muscle training upon rowing performance. Eur J Appl Physiol 2007; 99(5): 457-66.
28. Kilding AE, Brown S, McConnell AK. Inspiratory muscle training improves 100 and 200 m swimming performance. Eur J Appl Physiol 2010; 108(3): 505-11.
29. De Troyer A, Kirkwood PA, Wilson TA. Respiratory action of the intercostal muscles. Physiol Rev, 2005; 85(2): 717-56. 30. Campbell EJ, Green JH. The expiratory function of the abdominal
mus-cles in man; an electromyographic study. J Physiol,1953; 120(3): 409-18. 31. McKenzie DC. Respiratory physiology: adaptations to high-level
exercise. Br J Sports Med 2012; 46(6): 381-84.
32. Perriman D. Official player classification manual. 2010;
International Wheelchair Basketball Federation. Available from
http://www.iwbf.org/_OLD_JULY_2013/images/!!!Classiica -tion/2010-2014 [acessed in July 19, 2013].
33. Leicht CA, Bishop NC, Goosey-Tolfrey VL. Submaximal ex-ercise responses in tetraplegic, paraplegic and non spinal cord injured elite wheelchair athletes. Scand J Med Sci Sports 2012; 22(6): 729-36.
34. Vanderthommen M, Francaux M, Colinet C, Lehance C, Lhermerout C, Crielaard JM, et al. A multistage ield test of
wheelchair users for evaluation of itness and prediction of peak
oxygen consumption. J Rehabil Res Dev 2002; 39(6): 685-92. 35. Vinet A, Le Gallais D, Bouges S, Bernard PL, Poulain M, Varray
A, et al. Prediction of VO(2peak) in wheelchair-dependent ath-letes from the adapted Léger and Boucher test. Spinal Cord 2002; 40(10): 507-12.
36. Romer LM, Lovering AT, Haverkamp HC, Pegelow DF, Dempsey JA. Effect of inspiratory muscle work on peripheral fatigue of locomotor muscles in healthy humans. J Physiol, 2006; 571(Pt 2): 425-39.
37. Rodgers MM, Keyser RE, Gardner ER, Russell PJ, Gorman PH.
Inluence of trunk lexion on biomechanics of wheelchair propul -sion. J Rehabil Res Dev 2000; 37(3): 283-95.
38. Yang YS, Koontz AM, Triolo RJ, Mercer JL, Boninger ML. (2006). Surface electromyography activity of trunk muscles during wheelchair propulsion. Clin Biomech (Bristol, Avon), 2006; 21(10): 1032-41.
Corresponding author
Marlene Aparecida Moreno, PhD, Postgraduate program in physical therapy, Meth-odist University of Piracicaba, Rodovia do Açúcar Km 156, Taquaral, Piracicaba, SP Email: [email protected]
Manuscript received on October 22, 2014
Manuscript accepted on November 11, 2015