Abstract—The agricultural organic farming is different from conventional farming in a way that is aimed at providing a balanced and constructive action in agricultural systems. With the increase in intensive agriculture, undesirable changes were being observed in ecosystems with irreparable damage being caused to the natural equilibrium. This is the reason for the increasing interest in organic farming as an environment friendly agricultural production method. In the present work three red fruits produced in organic farming were analysed, namely raspberry, gooseberry and blueberry. The samples were harvested in a local farm when at plain maturation. The results obtained allowed to conclude that the blueberry contained higher amounts of phenolic compounds, total tannins and total anthocyanins than raspberry and gooseberry. Furthermore, the HPLC analysis allowed to identify monomeric anthocyanins and phenolic acids in the three fruits studied.
Keywords—Blackberry, gooseberry, organic farming, phenolic compounds, raspberry.
I. INTRODUCTION
RGANIC farming is distinguished from other production systems because it excludes almost all synthetic chemicals, uses cultural rotations, crop residues, animal manure, and all organic waste from the farm.
The red fruits are fairly complete foods and should be part of a balanced diet. Recent studies [1] show that the group of small fruits possesses characteristic and specific contents of phenolic compounds, consisting essentially of anthocyanins, flavonols, proanthocyanidins and phenolic acids, catechins and isoflavones, compounds known for their high antioxidant capacity [2].
The extraction is the main step in the recovery, isolation, characterization, and quantification of individual and total polyphenolics from various plant-based materials. Phenolic compounds are often most soluble in solvents less polar than water. The most common solvents are methanol, ethanol, acetone, ethyl acetate, and their aqueous solutions. In this
The authors thank CI&DETS (Research Centre of the Polytechnic Institute of Viseu) and FCT (Foundation for Science and Technology) for financial support through project PEst-OE/CED/UI4016/2011.
R. P. F. Guiné (e-mail: raquelguine@esav.ipv.pt), António M. Jordão, Fernando J. Gonçalves (fgoncalves@esav.ipv.pt) are with the Research Centre CI&DET, Polytechnic Institute of Viseu, Campus Politécnico, Repeses, 3504 - 510 Viseu, Portugal (phone: 232-480700; fax: +351-232-480750).
Susana M. A. Soutinho is with the Food Engineering Department, Agrarian School of Viseu, Quinta da Alagoa, Ranhados, 3500-606 Viseu, Portugal (phone: +351-232-446600; fax: +351-232-426536).
work three red fruits, raspberry, gooseberry and blueberry, produced in organic farming, were characterized in relation to their phenolic composition.
II. EXPERIMENTAL PROCEDURE
A. Sampling
The fruits studied in this work were raspberry, gooseberry and blueberry, all produced in organic farming and provided by a local producer. The samples were harvested for analysis at complete maturation stage.
B. Extraction Procedure
The extraction of phenolic compounds from red fruits was carried out successively, three times with methanol and then three times with acetone solution (40%, v/v), lasting one hour each.
C. Phenolic Content
The phenolic content of the different extracts was determined by Folin-Ciocalteu reagent [3]. Each sample (0.125 mL) was added to 0.5 mL of deionized water and 0.125 mL of Folin-Ciocalteu reagent (Sigma). After 6 min, 1.25 mL of 7.5% solution of sodium carbonate and 1.0 mL of deionized water were added. The mixture was left 90 min at room temperature in the dark and the absorbance at 760 nm was measured. A calibration curve was made with standard solutions of gallic acid. The results were expressed in equivalents of standard used. All analyses were done in triplicate.
D. Total Tannins
Total tannins (TT) were estimated according to Ribereau-Gayon and Stonestreet [4]. Briefly, the sample was diluted to 1/50 in water. 2.0 mL of the previous solution was added to 1.0 mL of water and 3.0 mL of 12 M HCl. The content was divided into two tubes. One of them was heated for 30 min in boiled water and cooled (tube A), while the last one stayed at room temperature (tube B). A 0.5 mL amount of 95% ethyl alcohol was added. The absorbance was read at 550 nm for each tube, AbstA and AbstB. Total tannins (g/L) was calculated using the equation: TT = 19.33 × (AbstA - AbstB).
E. Total Anthocyanins
Total anthocyanins (TA) were determined using the SO2 bleaching method [5]. Each sample (1 mL) was added to 1 mL of ethanol acidified by 0.1% HCl and 20 mL of 2% HCl solution. In one tube, 2 mL of previous solution was added to 0.8 mL of water (t1). In another tube (t2) were mixed 2 mL of previous
Phenolic Compounds in Red Fruits Produced in
Organic Farming at Maturation Stage
Susana M. A. Soutinho, Raquel P. F. Guiné, António M. Jordão, and Fernando J. Gonçalves
solution and 0.4 mL of HNaSO3 solution (15% w/v). After 20 min at dark room temperature, the absorbance at 520 nm was measured. The TA were calculated using the equation TA = 875 × (abst1 - abst2), and results expressed as mg/L of malvidin equivalents.
F. Fractionation of Phenolic Compounds
The fractionation of fruit phenolic compounds was based on the methodology proposed by Sun et al. (2006). The pH of phenolic extracts was adjusted at pH≈7.0. This solution was loaded into the column in a flow of less than 2 mL/min. Phenolic acids fractions were eluted with 50 mL of diluted pH 7.0 phosphate buffer (1/8, v/v). The column was than washed with distilled water and ethyl acetate. The fraction composed of anthocyanins and polymeric proanthocyanidins was removed from the column by elution with methanol acidified by 0.1% of HCl.
G. HPLC Procedure
The individual phenolic acids and monomeric anthocyanins were analyzed using a HPLC Dionex Ultimate 3000 Chromatographic System (Sunnyvale, California, USA) equipped with a quaternary pump Model LPG-3400 A, a ACC-3000 auto sampler, having a thermostatted column compartment (adjusted to 30 ºC) and a multiple Wavelength Detector MWD-300. The column (250 x 4.6 mm, particle size 5 µm) was a C18 Acclaim® 120 (Dionex, Sunnyvale, California, USA) protected by a guard column of the same material.
1. Phenolic acids
The phosphate buffer fraction obtained by C18 sep-pak was used for chromatographic analysis of the phenolic acids. The solvents were (A) water/formic acid (95:5 v/v), and solvent (B) methanol. Analysis conditions were as follow: a linear gradient analysis for a total run time of 80 min was used as follows: starting from 5% solvent B during 2 min, increase to 80% solvent B over 68 min and then isocratic for 8 min, decreasing to 5% solvent B over 2 min, and finally isocratic for 5 min. The sample volume injected was 40 µL, the flow rate was 1.0 mL/min, and the column temperature was maintained at 30 ºC during the run.
The quantification of the individual hydroxybenzoic and hydroxycinnamic acids was made by a calibration curve obtained with standard solutions of gallic acid. The results were expressed in equivalents of gallic acid. The chromatographic peaks of all phenolic acids were identified by comparing their retention times with the retention time of standard compounds.
2. Monomeric Anthocyanins
The monomeric anthocyanins present in the sample solutions were analyzed by HPLC. The solvents were (A) 40% formic acid, (B) pure acetonitrile and (C) bidistilled water. The initial conditions were 25% A, 10% B, and 65% C, followed by a linear gradient from 10 to 30% B, and 65 to 45% C for 40 min, with a flow rate of 0.7 mL/min. The injection volume was 20 µL. The detection was made at 520
nm and a Chromeleon (version 6.8) software program (Sunnyvale, California, USA) was used.
The quantification of the individual anthocyanins was made by a calibration curve obtained with standard solutions of malvidin-3-glucoside. The anthocyanin structures were isolated and identified according to their UV-Vis spectrum [6].
III. RESULTS
In this study, three red fruits at maturation stage were characterized in regards with their phenolic composition. With the aim of removing the phenolic compounds present in the fruits: raspberry (RB), gooseberry (GB) and blueberry (BB), extractions were carried out with acidic methanol and acetone solutions, allowing to obtain two different extracts, Me-E and Ac-E, respectively. The ripening stage of the samples tested was plain maturation stage.
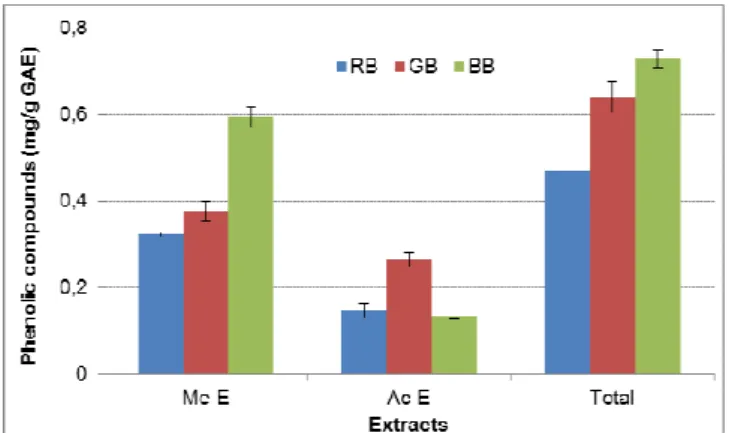
The phenolic compounds obtained in each extract for the different fruits are showed in Fig. 1. The total of phenolic compounds for each fruit was obtained by summing the phenolic compounds on both extracts.
Fig. 1 Phenolic compounds present in each extract of the different fruits. RB: raspberry, GB: gooseberry, BB: blueberry
For all the studied fruits, the phenolic compounds were preferentially recovered in the methanolic extract when compared with the acetone extract, representing 59-82 % of the total quantified. Regarding the methanolic extract, the higher amount of phenolic compounds was obtained for blueberry (0.59 mg/g GAE), followed by gooseberry (0.38 mg/g GAE) and raspberry (0.32 mg/g GAE). Otherwise, in the acetone extract, the gooseberry contained a higher amount of phenolic compounds (0.26 mg/g GAE). The total phenols present in each fruit showed a higher value for blueberry, reaching 0.73 mg/g. Gooseberry and raspberry exhibited 0.64 and 0.32 mg/g GAE, respectively.
Fig. 2 shows the amount of total tannis and anthocyanins present in the different fruits.
Fig. 2 Total anthocyanins (mg/g) and total tannins (mg/g) present in the different fruits. RB: raspberry, GB: gooseberry, BB: blueberry
The blueberry and gooseberry contained the highest amounts of tannins, 1.38 and 1.12 mg/g, respectively. The blueberry fruit contained a significantly higher value of total anthocyanins (0.78 mg/g MvGE) when compared with raspberry and gooseberry fruits. This value was similar to that described in literature for blueberries (0.81 mg/g MvGE) [7]. The amount of anthocyanins quantified in gooseberry and raspberry was 0.13 mg/g MvGE.
Results from the analysis performed to the three fruits relating to copigmented, monomeric and polymeric anthocyanins are presented in Fig. 3. The anthocyanins in raspberry were preferentially in the monomeric form (67%), while the copigmented and polymeric forms represented 18 and 15%. Otherwise, gooseberry contained 67% of anthocyanins in copigmented form. Regarding blueberry, the anthocyanins were mainly in the copigmented (48%) and monomeric (46%) forms.
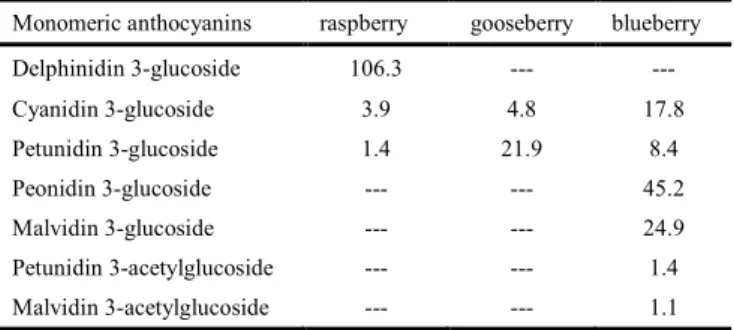
Table I shows the monomeric anthocyanins identified by HPLC in the different fruits. From the results obtained it was possible to identify six anthocyanins in blueberry, and two in raspberry and gooseberry.
Fig. 3 Copigmented, polymeric and monomeric forms of anthocyanins present in the different fruits. RB: raspberry, GB:
gooseberry, BB: blueberry
TABLEI
MONOMERIC ANTHOCYANINS COMPOSITION OF THE DIFFERENT FRUITS Monomeric anthocyanins raspberry gooseberry blueberry Delphinidin 3-glucoside 106.3 --- --- Cyanidin 3-glucoside 3.9 4.8 17.8 Petunidin 3-glucoside 1.4 21.9 8.4 Peonidin 3-glucoside --- --- 45.2 Malvidin 3-glucoside --- --- 24.9 Petunidin 3-acetylglucoside --- --- 1.4 Malvidin 3-acetylglucoside --- --- 1.1 Results are expressed as µg/g MvGE
The total amount of monomeric anthocyanins quantified in raspberry, gooseberry and blueberry was 111.6, 26.7 and 98.8 µg/g MvGE, respectively. In raspberry, the delphinidin 3-glucoside was present in higher amount, which was in accordance with the findings of Obón et al. [8]. The gooseberry was composed of 21.9 µg/g MvGE of petunidin 3-glucoside and 4.8 µg/g MvGE of cyanidin 3-3-glucoside. The presence of these anthocyanins was previously described in gooseberry [9, 10]. The blueberry was mainly composed by peonidin 3-glucoside (45.2 µg/g MvGE), malvidin 3-glucoside (24.9 µg/g MvGE) and cyanidin 3-glucoside (17.8 µg/g MvGE). The remaining quantified anthocyanins accounted for 10.9 µg/g MvGE. The presence of these anthocyanins was previously described in literature [11].
Table II presents the phenolic acids identified in the different fruits. The raspberry (52.10 µg/g GAE) and gooseberry (42.58 µg/g GAE) contained higher amounts of phenolic acids when compared with blueberry (5.45 µg/g GAE). In case of raspberry and gooseberry was possible to identify three hydroxybenzoic acids and four and five hydroxycinnamic acids. For blueberry was possible to identify four hydroxybenzoic acids and one hydroxycinnamic acid .
The total of hydroxybenzoic acids present in raspberry accounted for 14.48 µg/g GAE, of which vanilic acid represented 75%. The hydroxycinnamic acids represented 37.62 µg/g GAE, of which 79% were ferulic acid. Goosberry contained 10.54 µg/g GAE, of hydroxybenzoic and 32.04 µg/g GAE of hydroxycinnamic acids.
TABLEII
PHENOLIC ACIDS (HYDROXYBENZOIC AND HYDROXYCINNAMIC)PRESENT IN THE DIFFERENT FRUITS
Phenolic acids raspberry gooseberry blueberry
Hydroxybenzoic acids Protocatechuic 1.10 7.98 --- vanilic 10.94 1.27 0.58 syringic 2.44 1.29 0.91 Gallic --- --- 1.27 p-hydroxybenzoic --- --- 0.54 Hydroxycinnamic acids chlorogenic 3.07 9.58 2.15 p-Coumaric 6.23 2.10 ---
Ferulic 27.26 7.97 ---
Caftaric 1.06 3.58 ---
p-hydroxycinnamic --- 8.81 ---
Results are expressed as µg/g GAE
IV. CONCLUSION
The results showed that at maturation the blueberry, among the fruits studied, was the one where the higher content of phenolics, anthocyanins and tannins was quantified.
HPLC analysis allowed to identify the presence of monomeric anthocyanins and phenolic acids (benzoic and cinnamic) in raspberry, gooseberry and the blueberry.
REFERENCES
[1] Su M-S, Chien P-J (2007) Antioxidant activity, anthocyanins, and phenolics of rabbiteye blueberry (Vaccinium ashei) fluid products as affected by fermentation. Food Chemistry, 104, 182-187.
[2] Koca I, Karadeniz B (2009) Antioxidant properties of blackberry and blueberry fruits grown in the Black Sea Region of Turkey. Journal Scientia Horticulturae 121, 447-450.
[3] Singleton, V. L., & Rossi, A. (1965). Colorimetric of total phenolics with phosphomolybdic-phosphotungstic acid reagents. American Journal of Enology and Viticulture, 16, 144-158.
[4] Ribereau-Gayon, P., & Stonestreet, E. (1966). Dosage des tanins du vin rouge et determination de leur structure. Chimie Anal, 48, 188-196. [5] Boulton, R. (2001). The copigmentation of anthocyanins and its role in
the color of red wine: A critical review. American Journal of Enology and Viticulture, 52(2), 67-87.
[6] Dallas, C., & Laureano, O. (1994). Effcts of pH, sulfur-dioxide, alcohol content, temperature and storage time on color composition of a young portuguese red table wine. Journal of the Science of Food and Agriculture, 65(4), 477-485.
[7] Pertuzatti PB, Jacques AC, Zambiazi RC (2007) Relação de Fitoquímicos na casca e polpa de mirtilo (Vaccinium ashei Reade). XVI Congresso de Iniciação Científica. Faculdade de Agronomia Eliseu Maciel.
[8] Obón JM, Díaz-García MC, Castellar MR (2011) Red fruit juice quality and authenticity control by HPLC. Journal of Food Composition and Analysis. 1-12.
[9] Goiffon JP, Mouly PP, Gaydou EM (1999) Anthocyanic pigment determination in red fruit juices, concentrated juices and syrups using liquid chromatography. Analytica Chimica Acta 382, 39-50.
[10] Wu X, Prior R (2005) Systematic identification and characterization of anthocyanins by HPLC-ESI-MS/MS in common fruits in the United States: fruits and berries. Journal of Agricultural and Food Chemistry, 53, 2589-2599.
[11] Del Rio D, Borges G, Crozier A (2010) Berry flavonoids and phenolics: bioavailability and evidence of protective effects. British Journal of Nutrition 104.