ISSN 0101-2061 Food Science and Technology
DI:
D http://dx.doi.org/10.1590/1678-457X.16516
1 Introduction
Production region, climatic and soil variations, enological practices and the use of different grape varieties are factors that affect the characteristics of wines (Lingua et al., 2016). Jackson (2008) reported that the understanding of the chemical nature of grapes and wines that has been gained in recent decades has helped to drive wine production practices toward higher quality and more consistent wines.
The phenolic compounds present in wine are among the most important quality parameters due to their direct influence on sensory characteristics such as colour, flavour, bitterness and astringency (Ivanova-Petropulos et al., 2015). In addition to these properties, phenolic compounds have a beneficial health action, mainly because of their antioxidant, bactericidal and vitaminic properties, which aid in the prevention of cardiovascular diseases and cancer (Garrido & Borges, 2011; Gris et al., 2013; Nixford & Hermosín-Gutiérrez, 2010).
Brazilian wine production uses several grape varieties and is characterised by its diversity. According to current Brazilian legislation, grapes of the Vitis vinifera variety are used in the preparation of “viniferous table wines”, called fine table
wine, whereas American grape varieties (Vitis labrusca and
Vitis bourquina) and/or hybrids are used in the preparation of “American table wines”, called ordinary table wine, which are also called “ordinary wine” (Brasil, 2014).
The production and consumption of ordinary wines in Brazil is greater than the production of wines produced with viniferous grapes, and represents 80% of the wines produced in the country. This production results from the high production of
Vitis labrusca grapes in the South of Brazil, for instance in 2013 were produced 102,744 tons of Ives grape and 232,259 tons of Isabella grape, according the Winemakers Gaucha Association (Biasoto et al., 2014; Brasil, 2014; Machado & Guedes, 2015; Uliana et al., 2015).
Production in the Southern region of Brazil is concentrated on ordinary wines. According to data from the Brazilian Wine Institute (Instituto Brasileiro de Vinhos), production of these wines has reached a volume of 196.07 million litres. Df wine sales in the southern region totalling 206.0 million litres, 177.9 million litres of ordinary red wines were sold (Instituto Brasileiro do Vinho, 2014; Mello, 2003).
Quality evaluation of red wines produced from the Isabella and Ives cultivar
(
Vitis labrusca
): physicochemical parameters, phenolic composition and
antioxidant activity
Narciza Maria de Dliveira ARCANJD1*, Iramaia Angelica NERI-NUMA2, Taliana Kênia Alves BEZERRA1,
Flávio Luís Honorato da SILVA2, Glaucia Maria PASTDRE2, Marta Suely MADRUGA1
Received 16 June, 2016 Accepted 30 Nov., 2016
1 Graduate Program in Food Science and Technology, Center of Technology, Universidade Federal da Paraíba – UFPB, João Pessoa, PB, Brazil 2 Department of Food Science, Universidade Estadual de Campinas – UNICAMP, Campinas, SP, Brazil
*Corresponding author: narciza_moa@hotmail.com
Abstract
The objective of this study was to evaluate the quality of commercial red wines (Isabella and Ives [IsB]; Isabella, Ives, Seibel and Concord [IsSC]; and Isabella and Ives [IsBb]) produced from Isabella and Ives grapes grown in southern Brazil. The parameters required by Brazilian law were evaluated, and the chemical parameters of the phenolic compounds, organic acids, anthocyanins and antioxidant capacity were quantified for red wine samples containing the Isabella and Ives grape. All of the wine parameters were consistent with Brazilian legislation. There were significant differences (p<0.05) among the wines in phenolic compound content, flavonoids, antioxidant activity measured by the oxygen radical absorbance capacity (DRAC) and 2,2-azino-bis(3-ethyl benzothiazoline-6-sulfonic acid) (ABTS) methods, anthocyanin levels and colour parameters. The IsSC wine was the clearest; it had the lowest anthocyanin content (88.76 mg/L) and colour a* (11.28) parameter values. Statistical analysis revealed significant correlations between antioxidant activity and some of the identified phenolic compounds. The differences among the wines confirm the distinctive effects of the wine-producing region on each sample and on the varietals that make up each wine.
Keywords: American grapes; antioxidants; fermented beverage; phenolic compounds; legislation.
‘Isabel’ is the main Vitis labrusca variety cultivar, followed by Ives variety cultivar, both are used in the development of ordinary wines. It is a red grape that are very rustic and highly fertile (Assis et al., 2011) that proliferated in Brazil due to its easy adaptation to varying weather conditions and high productivity (Castilhos et al., 2016; Rombaldi et al., 2004)
Given its potential for table wine production and the lack of studies on the physicochemical qualities of this wine, the objective of this study was to evaluate the quality of red wines produced from the Isabella cultivar originating from southern Brazil, which has a tradition of producing ordinary wines. The parameters required by Brazilian law were evaluated (Brasil, 2014), and the wine chemical parameters of the phenolic compounds, organic acids, anthocyanins and antioxidant capacity were quantified.
2 Materials and methods
2.1 Wine samples
The physicochemical quality, phenolic composition, antioxidant capacity and phenolic profiles of three dry red wines made from Isabella grapes from traditional wineries in southern Brazil were evaluated (Table 1). The data were derived from five separate wine collections belonging to the same lot. Tests were performed in triplicate for each collection. According to data provided by the producers, the wines were made with grapes harvested from December to March, which is the harvest period in Serra Gaucha. Fermentation occurs in stainless steel tanks followed by bottling and storage.
2.2 Chemicals
All standards and solvents were of HPLC grade with a purity (>99%) and Water was Milli-Q quality. For HPLC analyzes standards were obtained from Sigma-Aldrich, UK (siringic acid, p-coumaric acid and elagic acid), from Sigma-Aldrich, China (p-hydroxybenzoic acid, protocatechuic acid, vanilic acid, trans-cinnamic acid, caffeic acid, rutin), and from Sigam Aldrich, France (catechin, myricetin, kaempferol, quercetina), others were purchased from Sigma-Aldrich, USA (Salicylic acid, Gentisic acid, Ferulic acid, sinapc acid and Resveratrol). The standards used in the analysis of organic acid (tartaric acid, malic acid, succinic acid, latic acid and acetic acid) by
HPLC, antioxidants and total phenolic were purchased from Sigma-Aldrich, USA (Folin-Ciocalteu, gallic acid, catechin, DPPH-(2,2-diphenyl-1-picrylhydrazyl radical reduction), (ABTS•+) 2,2-azino-bis(3-ethylbenzothiazoline-6-sulfonic acid), TEAC- (6-hydroxy-2,5,7,8-tetramethylchroman-2-carboxylic acid), APPH [2,2’-azobis (2’-metilpropionamidine) dihydrochloride]).
2.3 Physicochemical parameters required under Brazilian law
The wines were subjected to analysis to determine the density, alcohol content, total, volatile and fixed acidity, pH, reducing sugars, dry extract, reduced dry extract, ash, ash alkalinity, alcohol in weight/reduced dry extract (RDE) ratio, total sulphur dioxide, free sulphur dioxide, sulphates and chlorides. This was achieved using the physicochemical methods established by the Ministry of Agriculture, Livestock and Supply’s (Ministério da Agricultura, Pecuária e Abastecimento - MAPA) current legislation (Brasil, 2005).
2.4 Instrumental colour evaluation
Colorimetric parameter measurements were made using a CR400 portable Konica Minolta colorimeter (Dsaka, Japan) after calibration with a porcelain plate (CR-A43). The machine was programmed to perform readings considering the standard observer D65 illuminant and 2 (corresponding to daylight). The adopted colour space was the CIELAB system; in this system, L* represents lightness (0 (black) to 100 (white)); a* represents a colour coordinate that varies from +a (red) and -a (green), and b* represents another colour coordinate ranging from +b (yellow) to -b (blue). The coordinate C*, which represents chromaticity, was also determined, as well as h, the parameter identifying hue.
2.5 Spectrophotometric determination of the wines
Determination of total phenolics, total flavonoids and monomeric anthocyanins
Total phenolics were measured using the Folin-Ciocalteu method proposed by Roesler (2007). Methanolic extracts of the sample (500 uL) was added with 2.0 mL of 7.5% sodium carbonate and 2.5 ml of aqueous solution of 10 % Folin-Ciocalteu. Subsequently, the mixture was incubated for 5 minutes in a water bath at 50 °C for the colour formation. The absorbance was determined in a spectrophotometer (BECKMAN DU640) at 760 nm, using a blank sample as reference. For quantification of the wine’s total phenols, a standard curve (10 to 90 μ.mL-1)
prepared with gallic acid (Sigma, Brazil) was constructed and expressed as mg of gallic acid equivalents (GAE) per litre of sample.
The method proposed by Zhishen et al. (1999) was used to determine total flavonoids. The reaction system was formed by 100 μL of samples and 0.15 ml of NaND2 waiting reacting for 5 minutes, followed by addition of 0.15 mL of AlCl3 and reaction time of 6 minutes. Finally it was added 1.0 mL NaDH and 1.2 mL H2D. The measure of colour formation was determined by absorbance readings in a spectrophotometer (BECKMAN DU640) at 510 nm. Quantification of total flavonoids of the
Table 1. Dry red wine characterisation, production origin and price per bottle.
Region Codes1 Varietals2 Geographical
coordinates3 Price4
South IsB Isabella, Ives 29° 1′ 50″ S; 51° 11′ 30″ W
8.65 (2.20) IsSC Isabella, Ives, Seibel
and Concord
29° 1′ 50″ S; 51° 11′ 30″ W
7.79 (1.98) IsBb Isabella, Ives 29° 10′ 26″ S;
51° 31′ 7″ W
8.45 (2.16)
sample was performed by standard curve (10 to 150 mg.L-1)
prepared with catechin (Sigma, Aldrich) at 0.2%, and expressed as catechin equivalents.
Monomeric anthocyanins were determined using the differential pH method (Wrolstad, 2006). Initially, the dilution factor of the sample was determined by diluting the sample with 0.0025M potassium chloride buffer, pH 1.0, until the absorbance of the sample at λvis-max (510 nm) reached a linear range (less than 1.2) in the spectrophotometer readings of absorbance. The dilution value (DF) was obtained by dividing the final sample volume by the initial volume. Aiming to do not exceed the buffer capacity, the sample was kept in volume less than 20% of the total volume. Two dilution of each sample were prepared, one containing 0.025M sodium chloride and the other sodium acetate buffer 0.4M at pH 4.5, the pH was adjusted with concentrated hydrochloric acid. Thereafter, each sample was diluted in buffer and diluting each of the predetermined dilution factor; following they were leaved to stand until the dilutions come to equilibrium. Readings were taken in a spectrophotometer (UV Microproce 0798U, Quimis, São Paulo, Brazil) at wavelengths of 510 nm and 700 nm, against a ultra-pure water (Equation 1).
A = (Aλvis-max - A700) pH 1.0 – (Aλvis-max - A700) pH 4.5 (1)
The concentration of monomeric anthocyanins in the original sample was calculated using Equation 2, where MW is the molecular weight of cyanidin-3-glucoside (MW = 449.2), DF is the dilution factor and ε is the molar absorptivity (26900 mol/L).
Monomeric anthocyanin (mg/L) = (A x MW x DF x 1000)/(ε x 1) (2)
Antioxidant activity
The DPPH tests (2,2-diphenyl-1-picrylhydrazyl radical reduction) were performed according to Roesler (2007) with some modifications. Preparation of A solution of DPPH • (0.004% w/v) with a range of between 0.8 and 1.2 absorbance at 517 nm and from which the solution was prepared daily and stored in a refrigerator until the moment of use. Sample preparation took place using methanol at a concentration of 10 μL.mL-1. An aliquot
of 200 uL was transferred to a tube and added with 1000 uL of DPPH solution, stirred, and after 30 minutes the amount of DPPH was recorded in UV-Visible spectrometer (UV Microproce 0798U, Quimis, São Paulo, Brazil) at a wavelength of 517 nm. The results were expressed in Trolox equivalent, where the standard curve was determined by the same procedure for the sample, using readings obtained from the calibration curve of Trolox curve: A = 0.4335 C + 0.4532, and r2 correlation coefficient: 0.9954,
where a is the absorbance at 517 nm and C is the concentration of Trolox (6.25 to 250 mg ml-1).
The Trolox equivalent antioxidant capacity (TEAC) - 2,2-azino-bis(3-ethylbenzothiazoline-6-sulfonic acid) radical capture (ABTS•+) was determined according to the method described by Re et al. (1999). The sample was prepared in distilled water at a concentration of 10 μL/mL. Through testing with the ABTS • +, obtained by reacting 5 ml of ABTS (7 mM) with 88μL potassium persulfate 140mM (final concentration of 2.45 mM), where the system was kept to stand at room temperature for a period of 12 to 16 hours in absence of light. Subsequently, the
sample absorbance was reading at 734 nm after the reaction mixture containing 200 μL sample and 1000 uL ABTS • + solution, leaving to rest for 6 minutes. Reading the prepared blank was performed according to the procedure described, without the addition of the sample. It was built the Trolox calibration curve (10 -250 mM) and is plotted as the percentage (%) of inhibition versus concentration of Trolox: A = 2.1824* C - 4.1649, and the linear correlation coefficient r 2 = 0.9904, where a is the absorbance at 734 nm and C is the concentration of Trolox. The result of the activity of the tested compounds was expressed in TEAC values, defined in micromol equivalents Trolox.g-1.
The oxygen radical absorbance capacity (DRAC) test procedures were based on the methods of Prior et al. (2003) and Dávalos et al. (2004). AAPH (2,2’-azobis(2-amidinopropane) dihydrochloride) was used as a peroxyl radical generator and Trolox as a standard. All readings were taken using a NDVDstar (Labtech BMG, Dffenburg, Germany) microplate reader (96 wells) together with the MARS Data Analysis software version 1.3 (BMG Labtech, Dffenburg, Germany). Fluorescence intensity (485 nmEx/520 nmEm) was checked at every 60-second cycle for 80 cycles in the microplate reader. The same procedure was adopted for the reference standards. Stock solutions of each sample were prepared at a concentration of 10 mg/ml (w/v) with 75 mM potassium phosphate buffer, pH 7.4, they were called “mother solution”. The final DRAC value was calculated based on the area of liquid under the fluorescence decay curve and expressed in µmol TE L-1.
2.6 Chromatographic analysis of the wines
Quantification of the class of phenolic compounds
For better identification of phenolic compounds (phenolic acids, flavonóis compounds and resveratrol), prior extraction was performed according to Malovaná et al. (2001). The phenolic compounds were separated and quantified in an LC-20 AT high-performance liquid chromatography (HPLC) system (Shimadzu Corporation, Japan) equipped with a Vydac 218TP C18 column (25 cm x 4.6 mm x 5μm) and diode array detector. The samples were eluted in a gradient system consisting of solvent A (2% v/v acetic acid) and solvent B (acetonitrile:methanol 2:1 v/v). The gradient system progressed from 90% A at 0 min to 80% A at 10 min, 70% A at 15 min, 60% A at 25 min, 50% A at 30-40 min, 75% A at 42 min and 90% A at 44 min. The flow rate was 1 ml/min, the column temperature was maintained at 25° C, and the sample injection volume was 20 µL. The phenolic compound peaks were monitored at 280 nm (Prasad et al., 2009). The identification and quantification of compounds was given by injecting standard curves at concentrations of 1; 0.5; 0.25; 0.1; 0.05; 0.04; 0.03; 0.02; 0.01 mg. ml-1.
Analysis of organic acids
pump system with high pressure gradient setting (Varian 230) and Galaxie Chromatography Data System processing software. The mobile phase used was 0.009 M sulphuric acid at a flow rate of 0.7 ml/min. The run duration was 30 minutes (Zeppa et al., 2001). Drganic acids (tartaric, malic, acetic, latic and succinic acids) were quantified by injecting a standard curve.
2.7 Statistical analysis
The data were analysed statistically using analysis of variance (ANDVA) and Tukey’s means test at a 5% significance level, using SAS 9.3 (SAS Institute Inc., 2011). The data were also subjected to Pearson correlation analysis using GraphPad Prism 6.0. Principal Component Analysis (PCA) was applied to the physicochemical parameters, phenolic compound and antioxidant datasets using MVSP 3.13 (Kovach Computing Services, 2006).
3 Results and discussion
3.1 Physicochemical quality of red wines produced from Isabella grapes
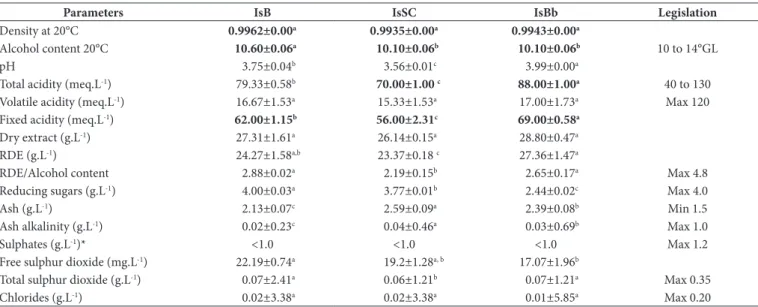
The wines produced in the southern region (Isabella wine and Ives [IsB]-South, Isabella wine, Ives, Seibel and Concord [IsSC]-South and Isabella and Ives [IsBb]-South) were in accordance with the limits recommended by the Brazilian legislation for wines (Brasil, 2014; Table 2). The wines differed significantly (p<0.05) in alcohol content, pH, total and fixed acidity, reduced dry extract, reducing sugars, ash and ash alkalinity. It may be assumed that the differences in these parameters among the wines are caused by differences in the wine-making processes and by the use of different grape varieties for wine production in the southern region (Castilhos & Del Bianchi, 2012).
Differences observed between table wines related to the full and fixed acidities, can be explain by the fact that wines were not produced by just one type of grape, so the formation of the characteristic acids present in the fixed acidity resulted from the mixture of different acids, such as tartaric, malic, succinic, etc.
So, as the winemaking process varies from winery to winery, this fact has a direct influence on the production of these acids, promoting the statistical difference observed in the results (Castilhos & Del Bianchi, 2011).
In addition, the results of the dry extract ratios were expected, dry wine with a dry extract content of less than 20 g/L tend to present a mild taste; however, dry wine with 30g/l or more is considered to a bond taste. In this context, the table wines analyzed showed dry matter content of less than 30 g/L, thus suggesting that the high quantity of dry matter resulted from the largest solubilization of solid substances of the grape during the maceration stage and the stabilization period of the wines (Castilhos & Del Bianchi, 2011).
The reducing sugar content (4.00 g/L) found in IsB wine, the maximum amount permitted by law, probably resulted from the addition of sucrose during the chaptalisation stage (Dliveira et al., 2011).
With regard to SD2 levels, the wines did not exceed the maximum allowable amount of 0.35 g/L dictated by the law. SD2 is used as a preservative, and it acts as an antimicrobial and antioxidant agent in wine production. Reports suggest that it may be associated with allergic reactions in some consumers (Danilewics, 2007).
3.2 Phenolic compounds, flavonoids, anthocyanins and antioxidant capacity of red wines derived from Isabella grapes
Table 3 shows the concentrations of total phenolic compounds, total flavonoids, monomeric anthocyanins and antioxidant capacity of the red table wines.
The total phenolic content of the wines ranged from 830.51 to 846.90 mg GAE.L-1, values that are in the range
reported by Amerine & Dugh (1980) for red wines. The phenolic composition of wine depends on the type of grape used for wine
Table 2. Physicochemical characterisation of red wines produced from Isabella grapes (parameters required by Brazilian law) (Brasil, 2014).
Parameters IsB IsSC IsBb Legislation
Density at 20°C 0.9962±0.00a 0.9935±0.00a 0.9943±0.00a
Alcohol content 20°C 10.60±0.06a 10.10±0.06b 10.10±0.06b 10 to 14°GL
pH 3.75±0.04b 3.56±0.01c 3.99±0.00a
Total acidity (meq.L-1) 79.33±0.58b 70.00±1.00 c 88.00±1.00a 40 to 130
Volatile acidity (meq.L-1) 16.67±1.53a 15.33±1.53a 17.00±1.73a Max 120
Fixed acidity (meq.L-1) 62.00±1.15b 56.00±2.31c 69.00±0.58a
Dry extract (g.L-1) 27.31±1.61a 26.14±0.15a 28.80±0.47a
RDE (g.L-1) 24.27±1.58a,b 23.37±0.18 c 27.36±1.47a
RDE/Alcohol content 2.88±0.02a 2.19±0.15b 2.65±0.17a Max 4.8
Reducing sugars (g.L-1) 4.00±0.03a 3.77±0.01b 2.44±0.02c Max 4.0
Ash (g.L-1) 2.13±0.07c 2.59±0.09a 2.39±0.08b Min 1.5
Ash alkalinity (g.L-1) 0.02±0.23c 0.04±0.46a 0.03±0.69b Max 1.0
Sulphates (g.L-1)* <1.0 <1.0 <1.0 Max 1.2
Free sulphur dioxide (mg.L-1) 22.19±0.74a 19.2±1.28a, b 17.07±1.96b
Total sulphur dioxide (g.L-1) 0.07±2.41a 0.06±1.21b 0.07±1.21a Max 0.35
Chlorides (g.L-1) 0.02±3.38a 0.02±3.38a 0.01±5.85a Max 0.20
making, on juice extraction and wine production processes and on the chemical reactions that occur during aging of the wine (Granato et al., 2011).
Increased levels of total flavonoids were found in the IsSC wine (824.92 mg CAT.L-1), higher (p<0.05) than those of the
other wines analysed. Flavonoids are responsible for a wine’s flavour and astringency (Abe et al., 2007; Ali et al., 2010).
The reduced anthocyanin content of the IsSC wine (88.76 mg.L-1)
is probably due to the different grape varieties used to prepare the wine. According to Gris et al. (2013), anthocyanins are effective antioxidants, and the anthocyanin composition of grapes varies according to species, cultivar, ripeness, seasonal conditions and solar radiation levels. Cabrita et al. (2003) found similar values in red wine produced with Trincadeira grapes, i.e. total phenolics content of 1568.0 mg EC. L-1, total flavonoid content
of 1535.0 EC mg. L-1, and anthocyanins content of 773 mg.L-1.
Resveratrol is often associated with antioxidant reactions, and it was found in the Isabella grape red wines in concentrations ranging from 2.30 mg.L-1 (IsSC) to 6.70 mg.L-1 (IsB). Resveratrol
is synthesised in the grape skin; in wines, typical resveratrol values range from 0.1 to 5.65 mg.L-1 (Abe et al., 2007).
Trans-cinnamic acid was identified among the phenolic acids in the wines, but it was present only in trace amounts. Vanillic acid was not identified in the IsB wine. Protocatechuic acid (10.51 to 52.20 mg.L-1), p-hydroxybenzoic acid (25.40 to 36.50 mg.L-1)
and gentisic acid (49.62-111.33 mg.L-1) were found in higher
concentrations in the wines analysed than the remaining phenolic acids. Dther acids such as p-coumaric (-14.22 3.84 mg.L-1), caffeic
acid (1.00 to 3.32 mg.L-1), vanillin (1,60-1,70 mg.L-1) and ferulic
(2.50 to 3.70 mg L-1) are under study in red wines from different
grape varieties (Granato et al., 2011).
Phenolic acids, which are derived from benzoic and cinnamic acids, play an important role in the sensory characteristics of wines. Hydroxycinnamic acids and their tartaric esters are
Table 3. Quantification of total phenolic compounds, total flavonoids, anthocyanins and antioxidant activity by spectrophotometric methods and quantification of profile phenolic compounds and organic acids by chromatographic methods in red wines produced from the Isabella and Ives cultivar.
Compound IsB1 IsSC1 IsBb1
Total phenolics2 837.28±0.15b 846.90±1.88a 830.51±3.52c
Total flavonoids3 824.92±9.35a 453.49±11.47c 590.79±11.48b
Anthocyanins4 196.07±5.54b 88.76±6.67c 258.88±8.84a
Compound Class
Protocatechuic acid Phenolic acid5 35.00±4.50b 36.50±1.55b 52.20±5.80a
P-hydroxybenzoic acid Phenolic acid 34.67±3.51a 36.50±2.04a 34.00±4.00a
Salicylic acid Phenolic acid 4.77±1.16a 3.44±0.47b 4.80±0.45a
Syringic acid Phenolic acid 0.74±0.05b 1.43±0.30a 1.31±0.07a
Gentisic acid Phenolic acid 72.86±3.25b 111.33±7.41a 76.77±1.51b
Vanillic acid Phenolic acid nd 1.60±0.08a 1.70±0.10a
P-coumaric acid Phenolic acid 3.84±0.99b 14.22±2.84a 5.14±0.92b
Sinapic acid Phenolic acid 1.48±0.29a 2.00±0.57a 1.51±0.05 a
Trans-cinnamic acid Phenolic acid tr tr tr
Caffeic acid Phenolic acid 1.00±0.35b 3.32±0.49a 1.29±0.03b
Ferulic acid Phenolic acid 2.50±0.40a 3.70±0.62a 3.38±0.45a
Ellagic acid Phenolic acid 0.20±0.01b 0.22±0.01b 0.34±0.03a
Rutin Flavonoid 3.03±0.81b 6.18±0.60a 1.80±0.11b
Kaempferol Flavonoid 1.38±0.29a 0.64±0.02b 0.86±0.08b
Myricetin Flavonoid 18.95±9.45b 45.50±0.41a 49.00±1.00a
Quercetin Flavonoid 11.82±1.54a 8.15±0.20b 11.70±0.80a
Catechin Flavonoid 236.03±1.27a 145.17±3.12c 216.50±2.50b
Resveratrol Stilbene 6.70±0.26a 2.30±0.65b 6.67±0.91a
Tartaric acid Drganic acid6 1.80±0.01a 1.20±0.01b 2.90±0.01a
Malic acid Drganic acid 0.60±0.02a nd 0.30±0.02a,b
Succinic acid Drganic acid 1.50±0.02a nd 1.60±0.03a
Lactic acid Drganic acid 1.10±0.01a 1.20±0.01a 1.50±0.01a
Acetic acid Drganic acid nd nd nd
Antioxidant Activity7
ABTS 629.41±0.01b 1420.47±0.01a 1419.07±0.01a
DPPH 40.78±1.56a 44.57±0.07a 45.60±0.09a
DRAC 39159.72±1.52a 30882.33±1.51b 38411.91±3.00a
involved in the browning reactions of must and wine; that is, they affect the colour of wine and are precursors to volatile phenols (Gris et al., 2013).
Among the flavonoid class, catechin stood out due to its higher concentration and significant differences among wines, with values varying from 145.17 mg.L-1 in the IsSC wine to
236.03 mg.L-1 in the IsB wine. For other compounds of the class
of flavonoids (kaempferol myricetin, quercetin, rutin) also are in agreement with results reported in the study developed by Granato et al. (2011). Individual flavonoid compounds such as rutin, quercetin, myricetin and kaempferol, compounds identified in the wines in this study, are known for their antioxidant activities (Sagratini et al., 2012).
No malic, succinic or acetic organic acids were detected in the IsSC wine. The presence of these acids in various concentrations in the wines and their absence from one of the tested wines may have been due to the use of different wine production techniques and the different grape varieties used.
Tartaric acid is specific to grapes and wines, and its concentration in wine varies from 2 to 8 g L-1 (Jackson, 2000).
It is a strong acid that directly affects the wine’s pH. Malic acid is considered a weak acid and is poorly resistant to oxidation and high temperatures (Kliewer et al., 1967). Lactic acid is formed during malolactic fermentation, with resulting concentrations ranging from 1 to 3 g.L-1 (Lima et al., 2010).
Acetic acid contributes to the wine’s volatile fraction; it was not detected in the tested samples, indicating good control of the fermentation process. During alcoholic fermentation, small amounts of acetic acid, ranging from 0.2 to 0.4 g.L-1, are produced
(Amerine et al., 1967; Zoecklein et al., 1994).
Acidity defines the structure and balance of wine; it is dependent on the concentration of acids such as tartaric and malic acids and to a lesser extent on the concentration of lactic and acetic acid (Lima et al., 2010). Rizzon et al. (2000) reported that the skin of the Isabella grape yields a higher concentration of organic acids than that of Vitis vinifera cultivars, possibly due to release of the skin’s organic acids during maceration.
The highest concentration of phenolic compounds was found in the IsSC wine, whereas the highest concentration of flavonoids was found in the IsB wine, and the highest concentration of anthocyanins was found in the IsBb wine. In general, the levels of phenolic compounds, flavonoids and anthocyanins were reflected in the determination of antioxidant capacity using the ABTS and DRAC methods, with variations of 629.41 to 1420.47 μM TE. mL-1
and 30,882.33 to 39,159.72 μM TE. mL-1, respectively. However,
there was no significant difference in the measured amounts of DPPH radicals. Nixford & Hermosín-Gutiérrez (2010) evaluated the antioxidant activity of Isabella wines using the DPPH method and found antioxidant capacities of 26-63 μM TE. mL-1, values
that are consistent with the results of this study.
3.3 Colour evaluation
Table 4 shows the CIELAB colour results of the red wines made from Isabella grapes. All of the measured parameters showed significant differences in the IsSC wine and the IsB and IsBb wines.
The IsSC wine had the highest L* value (24.73) and therefore was the clearest wine. The IsSC wine also had the lowest values for the a*, C* and h parameters; that is, it was characterised as being less red and having lower saturation and hue. In contrast, it had a greater mean b* (yellow) value, which can impart a slightly orange colour. These values reflect the reduced concentrations of anthocyanins and total flavonoids, which are the molecules responsible for wine colour.
Romero-Cascales et al. (2012) found that the maceration process increases the concentration of anthocyanins in wine. The fact that the IsSC wine has a less intense and less reddish colour than the other wines from the southern region may be explained by differences in the wine production process, as wine colour also depends on other factors such as grape variety. The Isabella grape has less colouring than is desirable for wines and often needs to be cut with other species that confer colour (Camargo et al., 2011).
3.4 Statistical analysis
Pearson correlation analysis revealed significant correlations (p<0.05) between some of the red wine parameters analysed in this study.
A strong positive correlation was observed between pH and anthocyanins (r = 0.99), total acidity (r = 1.0) and dry extract (r = 0.99), indicating the effect of this parameter on the pigment concentration in the wines and on acidity.
There were also correlations with antioxidant activity measured by the DRAC method and gentisic acid (r = 0.99), sinapic acid (r = 0.99) and caffeic acid (r = 0.99). Rice-Evans et al. (1996) found that phenolic acids also contribute to antioxidant activity in wine and that this effect depends mainly on the number of hydroxyl groups present in the molecules. The correlations between antioxidant activity, total phenolic compounds, total flavonoids, monomeric anthocyanins and other phenolic acids, flavonoids and resveratrol were weak and not significant (p>0.05).
In contrast to the findings of this study, Granato et al. (2011) found that compounds such as gallic acid, myricetin and quercetin, along with anthocyanins, were responsible for the differences in antioxidant activity among South American red wines. In another study conducted by Granato et al. (2010), it was found that non-flavonoids were the main compounds responsible for the antioxidant activity in Brazilian red wines.
Table 4. CIELAB colorimetric parameters in red wines produced from the Isabella cultivar.
Parameters IsB IsSC IsBb
L* 21.9±0.52b 24.7±0.54a 20.4±0.39b
a* 19.0±1.52a 11.3±1.25b 23.1±1.32a
b* 2.1±0.40b 7.5±0.76a 2.2±0.31b
C* 26.4±1.47a 11.7±5.86b 21.9±0.43a
h 40.5±0.36a 17.9±2.24b 41.2±0.35a
experimental n = 6
Significant and negative correlations were found between sinapic acid and resveratrol content (r = -0.99) and between quercetin and gentisic (r = -0.99) and sinapic acid (r = -0.99), indicating that these compounds may affect each other’s antioxidant activity.
Principal component analysis was performed to evaluate the effects of the substances found in the studied wines (Figure 1) because it is believed that the potential of each wine depends on these substances and in particular that the antioxidant capacity of red wine is related to its content of phenolic compounds. Phenolic content, in turn, is thought to depend on the composition of nitrogenous compounds, the alcohol content, the composition of volatile and fixed acids and other parameters.
The two principal components of the PCA graph accounted for approximately 90% of the variance. Similar wines occupy nearby regions in the chart and are characterized by the vectors (parameters and compounds) that appear closer to them. It can be seen that the wines from the southern region are located in different regions of the chart. The IsB and ISBB samples presented similarity regarding the variables studied; this probably resulted
from the fact that the wines are made with the same types of grapes.
Certain parameters such as pH, a*, total acidity, total anthocyanins and the amounts of some phenolic compounds such as ellagic, protocatechuic, lactic and tartaric acids and quercetin most affected the quality of the IsBb wine and most differentiated it from the others. Dther compounds such as resveratrol, malic acid, kaempferol and catechin were important in differentiating the IsB wine from the others, and these phenolic compounds may have produced a greater antioxidant activity value in the wine according to the DRAC method. Compounds such as myricetin, rutin, syringic, ferulic, hydroxybenzoic, caffeic and vanillic acids were the variables that made the highest contributions to the IsSC wine, and these phenolic compounds probably influenced the antioxidant activity values measured for this wine using the DPPH and ABTS methods.
According to the PCA graph in general, the association between phenolic compounds and antioxidant activity found in this study was to be expected because phenolic compounds are the main components responsible for the antioxidant activity
Figure 1. Projection of the physical parameters, physicochemical parameters, antioxidant activity, phenolic compound and organic acids content, and colour in red wine samples produced with Isabella grapes in the first two principal components. Wines: IsB (Isabella); IsSC (Isabella, Ives, Seibel and Concord); IsBb (Isabella and Ives). Parameters: ACE: Acetic acid; AC: Alcohol content; AS: Ash alkalinity; a*: red-green component; ANTDC: Anthocyanins; ANT: Antioxidant activity; b*: blue-yellow component; C*: chromaticity; CAF: Caffeic acid; CAT: Catechin; CINAN:
Trans-cinnamic acid; CDUM: p-coumaric; DE: Dry extract; DER: Reduced dry extract; ELAG: Ellagic acid; FER: Ferulic acid; FA: Fixed acidity;
FSD: Free of sulphur dioxide; GEN: Gentisic acid; h: hue angle; HIDRDX: p-hydroxybenzoic acid KAEM: Kaempferol; L*: lightness; LAT: Lactic
in red wine. A correlation or association between antioxidant activity and phenolic compounds has been found in many studies (Alén-Ruiz et al., 2009; Di Majo et al., 2008; Ferreira et al., 2010; Gris et al., 2011a, b). The antioxidant properties of phenolic compounds are probably primarily due to their chemical structures. However, physicochemical parameters and other substances present in the wine participate in the formation and stability of phenolics and in the stability and quality of the wine and may be important in the differentiation of wines.
4 Conclusion
The wines analysed in this study were produced in the Southern region of Brazil, a traditional red wine-producing region, had concentrations of phenolic compounds, flavonoids and anthocyanins similar to those reported in other studies. These values resulted in a higher antioxidant capacity of these wines as assessed using the ABTS and DRAC methods. The results clearly demonstrate the potential of wine produced from Isabella grapes. The observed variations in the physicochemical composition, phenolic composition and antioxidant activities of these wines are related to differences due to the use of different wine production conditions and especially to the grape variety used in the preparation of each wine.
Acknowledgements
The authors thank the National Council for Scientific and Technological Development (Conselho Nacional de Desenvolvimento Científico e Tecnológico - CNPq, Brazil), the Coordination of Improvement of Higher Education Personnel (Coordenação de Aperfeiçoamento de Pessoal de Nível Superior - CAPES, Brazil) and Campinas State College -UNICAMP for providing financial assistance for this study.
References
Abe, L. T., Mota, R. V., Lajolo, F. M., & Genovese, M. I. (2007). Phenolic compounds and antioxidant activity of Vitis labrusca and Vitis vinifera cultivars. Food Science and Technology, 27(2), 394-400. http://dx.doi. org/10.1590/S0101-20612007000200032.
Alén-Ruiz, F., García-Falcón, M. S., Pérez-Lamela, M. C., Martínez-Carballo, E., & Simal-Gándara, J. (2009). Influence of major polyphenols on antioxidant activity in Mencía and Brancellao red wines. Food Chemistry, 113(1), 53-60. http://dx.doi.org/10.1016/j.foodchem.2008.07.038. Ali, K., Maltese, F., Choi, Y. H., & Verpoorte, R. (2010). Metabolic
constituents of grapevine and grape-derived products. Phytochemistry
Reviews, 9(3), 357-378. PMid:20835385. http://dx.doi.org/10.1007/ s11101-009-9158-0.
Amerine, M. A., & Dugh, C. S. (1980). Wine and must analysis (pp. 337). New York: Jonh Wiley and Sons, Inc.
Amerine, M. A., Berg, H. W., & Cruess, W. V. (1967). The technology of wine making (2nd ed., pp. 797). Westport: AVI.
Assis, A. M., Yamamoto, L. Y., Souza, F. S., Borges, R. S., & Roberto, S. R. (2011). Evolução da maturação e características físico-químicas e
produtivas das videiras ‘BRS Carmem’ e ‘Isabella’. Revista Brasileira
de Fruticultura, 33(spe1), 493-498. http://dx.doi.org/10.1590/S0100-29452011000500066.
Biasoto, A. C. T., Netto, F. M., Marques, E. J. N., & Silva, M. A. A. P. (2014). Acceptability and preference drivers of red wines produced
from Vitis labrusca and hybrid grapes. Food Research International,
64, 456-466. http://dx.doi.org/10.1016/j.foodres.2014.03.052. Brasil. Ministério da Agricultura. (2005, September 28). Instrução
Normativa Nº 24, de 28 de setembro de 2005. Aprova o Manual
Dperacional de Bebidas e Vinagres. Diário Oficial [da] República
Federativa do Brasil.
Brasil. Ministério da Agricultura, Pecuária e Abastecimento. (2014, February 21). Regulamenta a Lei no 7.678, de 8 de novembro de 1988, que dispõe sobre a produção, circulação e comercialização do vinho e derivados da uva e do vinho (Decreto nº 8.198, de 20 de fevereiro
de 2014). Diário Oficial [da] República Federativa do Brasil.
Cabrita, M. J., Ricardo-Da-Silva, J., & Laureano, D. (2003) Ds compostos
polifenólicos das uvas e dos vinhos. In I Seminário Internacional de
Vinicultura-Instituto Superior de Agronomia (ISA), Ensenada, Mexico. Camargo, U. A., Tonieto, J., & Hoffmann, A. (2011). Progressos na
vinicultura brasileira. Revista Brasileira de Fruticultura, 1(spe1), 144-149. http://dx.doi.org/10.1590/S0100-29452011000500017. Castilhos, M. B. M., & Del Bianchi, V. L. (2011). Caracterização
físico-química e sensorial de vinhos brancos da região Noroeste de São Paulo. Holos, 4(0), 148-158. http://dx.doi.org/10.15628/holos.2011.611. Castilhos, M. B. M., & Del Bianchi, V. L. (2012). Vinhos tintos do noroeste paulista: relação entre os perfis físico-químico e sensorial. Holos, 4(0), 80-89. http://dx.doi.org/10.15628/holos.2012.706.
Castilhos, M. B. M., Maia, J. D. G., Gómes-Alonso, S., Del Bianchi, V. L., & Hermosín-Gutiérrez, I. (2016). Sensory acceptance drivers of pre-fermentation dehydration and submerged cap red wines produced
from Vitis labrusca hybrid grapes. LWT - Food Science and Technology,
69, 82-90. http://dx.doi.org/10.1016/j.lwt.2016.01.043.
Danilewics, J. C. (2007). Interaction of sulfur dioxide, polyphenols, and oxygen in a wine-model system: central role of iron and copper.
American Journal of Enology and Viticulture, 58(1), 53-60.
Dávalos, A., Gómez-Cordovés, C., & Bartolomé, B. (2004). Extending applicability of the oxygen radical absorbance capacity (DRAC-Fluorescein) assay. Journal of Agricultural and Food Chemistry, 52(1), 48-54. PMid:14709012. http://dx.doi.org/10.1021/jf0305231. Di Majo, D., La Guardia, M., Giammanco, S., La Neve, L., & Giammanco,
M. (2008). The antioxidant capacity of red wine in relationship with
its polyphenolic constituents. Food Chemistry, 111(1), 45-49. http://
dx.doi.org/10.1016/j.foodchem.2008.03.037.
Ferreira, E. A., Gris, E. F., Felipe, K. B., Correia, J. F. G., Cargnin-Ferreira, E., Wilhelm Filho, D., & Pedrosa, R. C. (2010). Potent hepatoprotective effect in CCl4-induced hepatic injury in mice of phloroacetophenone
from Myrcia multiflora. The Libyan Journal of Medicine, 5(0),
4891-4901. PMid:21483585. http://dx.doi.org/10.3402/ljm.v5i0.4891. Garrido, J., & Borges, F. (2011). Wine and grape polyphenols - a chemical
perspective. Food Research International, 44(2), 3134-3148. http://
dx.doi.org/10.1016/j.foodres.2011.11.001.
Granato, D., Katayama, F. C. U., & Castro, I. A. (2010). Assessing the association between phenolic compounds and the antioxidant activity
of Brazilian red wines using chemometrics. LWT - Food Science and
Technology, 43(10) 1542-1549.
Granato, D., Katayama, F. C. U., & Castro, I. A. (2011). Phenolic composition of South American red wines classified according to their antioxidant activity, retail price and sensory quality. Food Chemistry, 129(2), 366-373. http://dx.doi.org/10.1016/j.foodchem.2011.04.085.
Gris, E. F., Mattivi, F., Ferreira, E. A., Vrhovsek, U., Filho, D. W., Pedrosa, R. C., & Borgignon-Luiz, M. T. (2013). Phenolic profile and effect of regular consumption of Brazilian red wines on in vivo antioxidant activity. Journal of Food Composition and Analysis, 31(1), 31-40. http:// dx.doi.org/10.1016/j.jfca.2013.03.002.
capacity of Brazilian Vitis vinifera red wines. Food Chemistry, 126(1), 213-220. http://dx.doi.org/10.1016/j.foodchem.2010.10.102. Gris, E. F., Mattivi, F., Ferreira, E. A., Vrhovsek, U., Pedrosa, R. C.,
Wilhelm-Filho, D., & Bordignon-Luiz, M. T. (2011b). Stilbenes and tyrosol as target compounds in the assessment of antioxidant and hypolipidemic activity of Vitis vinifera red wines from Southern
Brazil. Journal of Agricultural and Food Chemistry, 59(1), 7954-7961.
PMid:21718033. http://dx.doi.org/10.1021/jf2008056.
Instituto Brasileiro do Vinho – IBRAVIN. Elaboração de vinhos e derivados
no Rio Grande do Sul - 2004 a 2014. Retrieved from http://www. ibravin.org.br/downloads/1426615141.pdf
Ivanova-Petropulos, V., Hermosín-Gutiérrez, I., Boros, B., Stefova, M., Stafilov, T., Vojnoski, B., Dörnyei, Á., & Kilár, F. (2015). Phenolic compounds and antioxidant activity of Macedonian red wines.
Journal of Food Composition and Analisys, 41, 1-14. http://dx.doi. org/10.1016/j.jfca.2015.01.002.
Jackson, R. S. (2000). Wine science: principles, practice, perception (2nd ed., 648 p.). San Diego: Academic Press.
Jackson, R. S. (2008). Wine science: principles and applications (3rd ed., pp. 270-331). San Diego: Academic Press.
Kliewer, W. M., Howarth, L., & Dmori, M. (1967). Concentrations of tartaric acid and malic acids and their 807 salts in Vitis vinífera grapes.
American Journal of Enology and Viticulture, 18(1), 42-54.
Kovach Computing Services. (2006). MVSP-Multi Variate Statistical
Package, Version 3.13n. Isle of Anglesey: Kovach Computing Services. Lima, L. L. A., Schuler, A., Guerra, N. B., Pereira, G. E., Lima, T. L. A., &
Rocha, H. (2010). Dtimização e validação de método para determinação de ácidos orgânicos em vinhos por cromatografia líquida de alta
eficiência. Quimica Nova, 33(5), 186-1189. http://dx.doi.org/10.1590/
S0100-40422010000500032.
Lingua, M. S., Fabani, M. P., Wunderlin, D. A., & Baroni, M. V. (2016). From grape to wine:Changes in phenolic Composition and its influence
on antioxidant activity. Food Chemistry, 208, 225-238. PMid:27132844.
http://dx.doi.org/10.1016/j.foodchem.2016.04.009.
Machado, I. P. L., & Guedes, F. F. (2015). Avaliação do conteúdo de trans-resveratrol em vinhos elaborados a partir das variedades de uva Bordô e Isabella. Revista de Iniciação Cintífica da Ulbra, 13, 103-115. Malovaná, S., García-Montelongo, F. J., Pérez, J. P., & Rodríguez-Delgado,
M. A. (2001). Dptimisation of sample preparation for the determination of trans-resveratrol and other polyphenolic compounds in wines by
high performance liquid chromatography. Analytica Chimica Acta,
428(4), 245-253. http://dx.doi.org/10.1016/S0003-2670(00)01231-9.
Mello, L. M. R. (2003). Produção e comércio mundial de vinhos. Bento
Gonçalves: Embrapa Uva e Vinho. Retrieved from http://www.cnpuv. embrapa.br/publica/artigos
Nixford, S. L., & Hermosín-Gutiérrez, I. (2010). Brazilian red wines made from the hybrid grape cultival Isabella: phenolic composition
and antioxidant capacity. Analytica Chimica Acta, 659(2), 208-215.
PMid:20103126.
Dliveira, L. C., Souza, S. D., & Mamede, M. E. D. (2011). Avaliação das características físico-químicas e colorimétricas de vinhos finos de duas principais regiões vinícolas do Brasil. Revista do Instituto Adolfo
Lutz, 70(2), 158-167.
Prasad, K. N., Yang, B., Yang, S., Chen, Y., Zhao, M., Ashraf, M., & Jiang, Y. (2009). Identification of phenolic compounds and appraisal of antioxidant and antityrosinase activities from litchi (Litchi sinensis Sonn.) seeds. Food Chemistry, 116(1), 1-7. http://dx.doi.org/10.1016/j. foodchem.2009.01.079.
Prior, R. L., Hoang, H., Gu, L., Wu, X., Bacchiocca, M., Howard, L., Hampsch-Woodill, M., Huang, D., Du, B., & Jacob, R. (2003). Assays for hydrophilic and lipophilic antioxidant capacity (oxygen radical absorbance capacity (DRAC FL)) of plasma and other biological and
food samples. Journal of Agricultural and Food Chemistry, 51(11),
3273-3279. PMid:12744654. http://dx.doi.org/10.1021/jf0262256. Re, R., Pellegrini, N., Proteggente, A., Pannala, A., Yang, M., & Riceevans,
C. (1999). Antioxidant activity applying na improved ABTS radical cátion de colorization assay. Free Radical Biology & Medicine, 26(9-10), 1231-1237. PMid:10381194. http://dx.doi.org/10.1016/S0891-5849(98)00315-3.
Rice-Evans, C. A., Miller, N. J., & Paganga, G. (1996). Structure-antioxidant
activity relationships of flavonoids and phenolic acids. Free Radical
Biology & Medicine, 20(7), 933-956. http://dx.doi.org/10.1016/0891-5849(95)02227-9.
Rizzon, L. A., Miele, A., & Meneguzzo, J. (2000). Avaliação da uva cv.
Isabella para elaboração de vinho tinto. Food Science and Technology,
20(1), 115-121. http://dx.doi.org/10.1590/S0101-20612000000100022.
Roesler, R. (2007). Estudo de frutas do cerrado brasileiro para avaliação
de propriedade funcional com foco na atividade antioxidante (Ph.D. thesis). Universidade Estadual de Campinas, Campinas.
Rombaldi, C. V., Bergamasqui, M., Lucchetta, L., Zanuzo, M., & Silva, J. A. (2004). Produtividade e qualidade de uva, cv. Isabella, em dois sistemas de Produção. Revista Brasileira de Fruticultura, 26(1), 89-91. http://dx.doi.org/10.1590/S0100-29452004000100024.
Romero-Cascales, I., Ros-García, J. M., López-Roca, J. M., & Gómez-Plaza, E. (2012). D efeito de uma enzima pectolítica comercial na degradação da parede celular da pele de uva e evolução da cor durante
o processo de maceração. Food Chemistry, 130, 626-631. http://dx.doi.
org/10.1016/j.foodchem.2011.07.091.
Sagratini, G., Maggi, F., Caprioli, G., Cristalli, G., Ricciutelli, M., Torregiani, E., & Vittori, S. (2012). Comparative study of aroma profile and phenolic content of Montepulciano monovarietal red wines from the Marches and Abruzzo regions of Italy using HS-SPME–GC–MS
and HPLC–MS. Food Chemistry, 132(3), 1592-1599. http://dx.doi.
org/10.1016/j.foodchem.2011.11.108.
SAS Institute Inc. (2011). SAS 9.3 statements. Cary: SAS Institute Inc. Uliana, M. R., Venturini, W. G. V. Fo., Dliveira, J. M., & Teixeira, J. A.
(2015). Vinhos de mesa varietais de uvas americanas: análises químicas
e energéticas. Revista Energia na Agricultura, 30(1), 98-103. http://
dx.doi.org/10.17224/EnergAgric.2015v30n1p98-103.
Wrolstad, R. E. (Ed.). (2006). Current Protocols in Food Analytical
Chemistry. New York: Jonh Wiley and Sons, Inc.
Zeppa, G., Conterno, L., & Gerbi, V. (2001). Determination of organic acids, sugars, diacetyl, and acetoin in cheese by high-performance
liquid chromatography. Journal of Agricultural and Food Chemistry,
49(6), 2722-2726. PMid:11409957. http://dx.doi.org/10.1021/jf0009403. Zhishen, J., Mengcheng, T., & Jianming, W. (1999). The determination of flavonoid contents in mulberry and their scavenging effects on
superoxide radicals. Food Chemistry, 64(4), 555-559. http://dx.doi.
org/10.1016/S0308-8146(98)00102-2.
Zoecklein, B. W., Fugelsang, K. C., Gump, B. H., & Nury, F. S. (1994).