Universidade de Aveiro 2018
Departamento de Economia, Gestão, Engenharia Industrial e Turismo
José Eduardo F. T.
Palhares
Nexo entre o desempenho dos bancos e a eficiência
do Capital Intelectual
Banking Firms´ Performance and Intellectual Capital
Efficiency Nexus
Universidade de Aveiro 2018
Departamento de Economia, Gestão, Engenharia Industrial e Turismo
José Eduardo F. T.
Palhares
Nexo entre o desempenho dos bancos e a eficiência
do Capital Intelectual
Banking Firms´ Performance and Intellectual Capital
Efficiency Nexus
Dissertação apresentada à Universidade de Aveiro para cumprimento dos requisitos necessários à obtenção do grau de Mestre em Gestão, realizada sob a orientação científica do Doutor Victor Manuel Ferreira Moutinho, Professor Auxiliar do Departamento de Economia, Gestão, Engenharia Industrial, e Turismo da Universidade de Aveiro, e coorientação científica do Doutor José António Fernandes Lopes Oliveira Vale, Professor Adjunto convidado do Instituto Superior de Contabilidade e Administração do Porto.
Dedico este trabalho à minha mãe por todo o amor, apoio, carinho e dedicação incondicionais.
o júri
presidente Prof. Doutor Manuel Luís Au-Yong Oliveira
professor auxiliar do Departamento de Economia, Gestão, Engenharia Industrial e Turismo da Universidade de Aveiro
arguente Profª. Doutora Graça Maria do Carmo Azevedo
professora coordenadora s/ agregação do Instituto Superior de Contabilidade e Administração da Universidade de Aveiro
orientador Prof. Doutor Vítor Manuel Ferreira Moutinho
professor auxiliar do Departamento de Economia, Gestão, Engenharia Industrial e Turismo da Universidade de Aveiro
agradecimentos Deixo aqui estas breves palavras como forma de agradecimento a todos aqueles que, de alguma forma, contribuíram para a realização desta dissertação.
Ao meu orientador e coorientador, Professor Doutor Victor Manuel Ferreira Moutinho e Professor Doutor José António Fernandes Lopes Oliveira Vale, respetivamente, pela disponibilidade, apoio, e empenho com que direcionaram e acompanharam esta dissertação.
A todos os docentes das várias instituições que tive a oportunidade de frequentar ao longo dos anos, e em especial, aos docentes do mestrado em Gestão do Departamento de Economia, Gestão, Engenharia Industrial e Turismo (DEGEIT) da Universidade de Aveiro, por terem tido um papel preponderante no desenlace desta recente etapa da minha formação académica.
À minha mãe, restantes familiares e amigos, pela dedicação, motivação, e apoio demonstrados durante todo o processo que culminou com a conclusão da presente dissertação.
A todos, o meu sincero obrigado.
palavras-chave Capital Intelectual; VAIC; DEA em 2-estágios; Desempenho; Bancos; Regressão por quantis; Regressão fracionária
resumo Este estudo tem por objetivo a avaliação do desempenho de 58 bancos Ibéricos
e a sua relação com a eficiência do Capital Intelectual. Por conseguinte, uma análise de dois estágios foi aplicada de forma a responder às questões de investigação propostas relacionadas com a banca Ibérica (Portuguesa e Espanhola) no geral, e com cada país em particular, durante o período compreendido entre 2013 e 2016. Num primeiro estágio, foi feita uma avaliação e respetiva classificação do desempenho dos bancos selecionados, através da estimação dos seus resultados de eficiência, i.e. aplicando os modelos Constant e Variable Returns to Scale (CRS e VRS) e de Super-Eficiência do Data Envelopment Analysis (DEA). Num segundo estágio, e de modo a aferir a relação entre o desempenho global dos bancos e a eficiência do seu Capital Intelectual, foram aplicados modelos de regressão por quantis e fracionários. Recorreu-se ainda, ao método Value Added Intellectual Coefficient (VAIC™), considerando-se as suas componentes como variáveis independentes, para além das variáveis Endividamento, e Dimensão. Os resultados obtidos sugerem que os bancos Portugueses apresentam melhores resultados médios de technical, pure technical, e scale efficiency (i.e. TE, PTE e SE), durante o período de estudo, comparativamente aos bancos espanhóis. Para além disso, os resultados demonstram um aumento das médias dos resultados obtidos (para ambos os modelos, CRS e VRS), durante o período de quatro anos estudado. Finalmente, os resultados obtidos durante a análise de segundo-estágio sugerem uma relação positiva e significativa entre a eficiência do capital humano (HCE) e o desempenho dos bancos selecionados. Contrariamente, os resultados sugerem um impacto negativo e significativo de ambos os componentes, eficiência do capital estrutural e do capital aplicado (SCE e CEE), no desempenho dos bancos que constituem a amostra. Esta poderá ser uma indicação do papel preponderante das práticas aplicadas pela Gestão de Recursos Humanos (HRM), e no impacto que a aplicação das “melhores práticas” poderá ter no desempenho do sector bancário Ibérico no geral, e também no desempenho dos bancos Portugueses e Espanhóis em particular.
keywords Intelletual Capital; VAIC; 2-stages DEA; Performance; Banks; Quantile regression; Fractional regression
abstract This study aims to assess 58 Iberian banks´ performance and its relationship
with Intellectual Capital efficiency. Therefore, a two-stage analysis was conducted in order to address several proposed research questions related to Iberian (Portuguese and Spanish) banks in general, and each country, individually, during the period from 2013 to 2016. In a first-stage, sampled banks´ performance and respective rankings were assessed, through the measurement of their efficiency scores, i.e. using DEA´s (Data Envelopment Analysis) Constant and Variable Returns to Scale (CRS and VRS) and Super efficiency models, and in second-stage, both quantile and fractional regression models were applied as way of inferring about the impact of selected independent variables, i.e. Value Added Intellectual Coefficient (VAIC™) components, Leverage and Size, on the DEA scores of Iberian banks´. Findings suggest that Portuguese banks have constantly better average Technical, Pure Technical, and Scale Efficiency (i.e. TE, PTE, and SE) scores throughout the studied period, in comparison to Spanish banks. Also, findings show an increase on average efficiency scores (for both CRS and VRS), over the studied four-year period, for all sampled Iberian banks. Finally, second-stage analysis findings suggest a positive and significant relationship between Human Capital Efficiency (HCE) and sampled banks´ performance. Conversely, results suggest a negative and significant impact of both Structural and Employed Capital Efficiency (i.e. SCE and CEE) on sampled banks´ performance. This may be an indication of the pivotal importance of Human Resources Management (HRM) practices and the impact that application of the “best practices” may have on Iberian banking industry´s performance in general, and also on Portuguese and Spanish banks´ performance in particular.
Table of contents
List of tables ... ii
List of figures ...iii
Abbreviations & Acronyms ... v
Chapter 1 Introduction ... 1
Chapter 2 Literature review ... 5
2.1 Performance conceptualisation and measurement ... 5
2.1.1 Measuring firms´ performance through efficiency (DEA) ... 6
2.2 Intellectual Capital ... 9
2.2.1 IC and its dimensions ... 12
2.2.1.1. Human Capital ... 14
2.2.1.2 Structural Capital ... 15
2.2.1.3 Relational Capital ... 16
2.2.2. IC measuring methods and tools ... 18
2.2.2.1 Measuring IC and its efficiency: The VAIC™ model ... 19
2.2.2.2 Modifying the original VAIC™: developing the formula ... 22
2.3 Relating firms´ IC and Performance ... 23
2.3.1. IC and performance in the banking sector: prior studies... 24
Chapter 3 Data collection and methodology ... 27
3.1 Contextual setting of the Iberian banking sector... 27
3.2 Data collection ... 28
3.3 The Data Envelopment Analysis (DEA) model ... 29
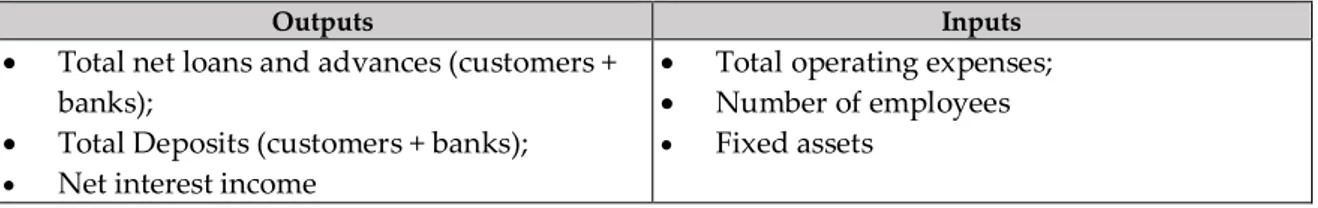
3.3.1 Input and Output variables ... 36
3.4 Econometric Analysis ... 37
3.4.1 Quantile regression model (QRM) ... 37
3.4.2 Fractional regression model (FRM) ... 39
3.4.3 Dependent, Independent and control variables ... 42
Chapter 4 Findings ... 45
4.1 Banks´ efficiency analysis ... 45
4.2 Banks´ IC analysis ... 50
4.3 IC and performance nexus analysis ... 51
4.4 Discussion ... 58
References ... 63
Appendices ... 73
Appendix 1 – Prior studies relating VAIC™ to performance ... 73
Appendix 2 – Prior studies relating VAIC™ to performance in the banking sector ... 76
Appendix 3 – Prior studies using DEA for measuring firms’ performance ... 81
Appendix 4 – Some of the applied variables in the reviewed banking sector related studies... 84
Appendix 5 – Original VAIC™ and variants specifics ... 86
Appendix 6 – Selection and calculation of variables ... 87
Appendix 7 – Super Efficiency amongst Spanish (isolated sample), Portuguese (isolated sample), and Iberian banks (full sample), respectively, from 2013 to 2016 ... 88
Appendix 8 – Rankings of Iberian banks according to the first-stage DEA from 2013 to 2016 ... 89
Appendix 9 – First-stage DEA scores of Iberian banks (assuming super efficiency) ... 90
Appendix 10 – Ranking and first-stage DEA scores of Portuguese banks (isolated sample) ... 91
Appendix 11 – Rankings of Spanish banks (isolated sample) according to the first-stage DEA from 2013 to 2016 ... 92
Appendix 12 – First-stage DEA scores of Spanish banks (isolated sample) ... 93
Appendix 13 – Correlation matrixes of the applied variables in the second-stage DEA (Portuguese and Spanish isolated samples) ... 94
Appendix 14 – Selected results of the OLS and quantile regressions applying both CRS and VRS super efficiency models: Portuguese and Spanish isolated samples ... 95
List of tables Table 1 – Chronologically-ordered Intellectual Capital definitions ... 10
Table 2 – Factorial summary of each IC dimension... 17
Table 3 – IC measuring methods categories ... 18
Table 4 – Summary of VAIC model advantages and limitations ... 21
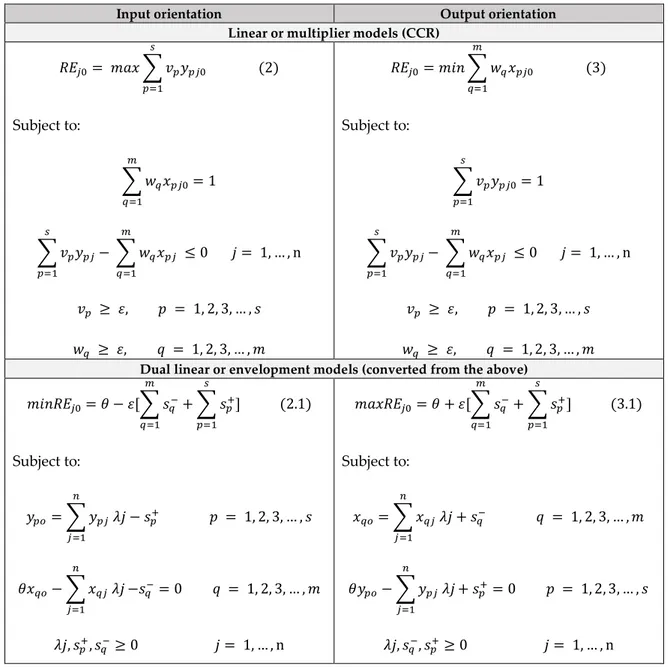
Table 5 -Expressions for the Input-or-Output orientations using DEA-CCR (multiplier and envelopment models) ... 32
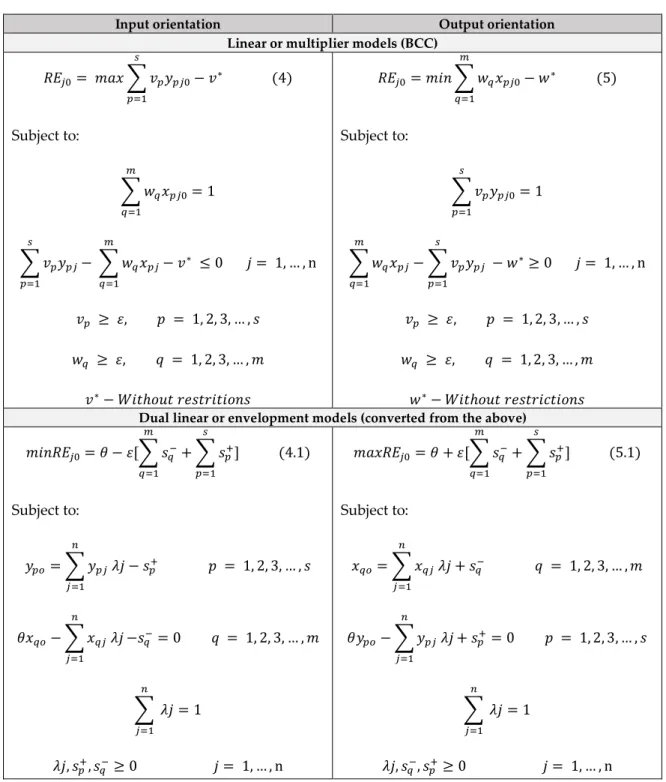
Table 6 - Expressions for the Input and Output orientations using DEA-BCC (linear or multiplier model)... 33
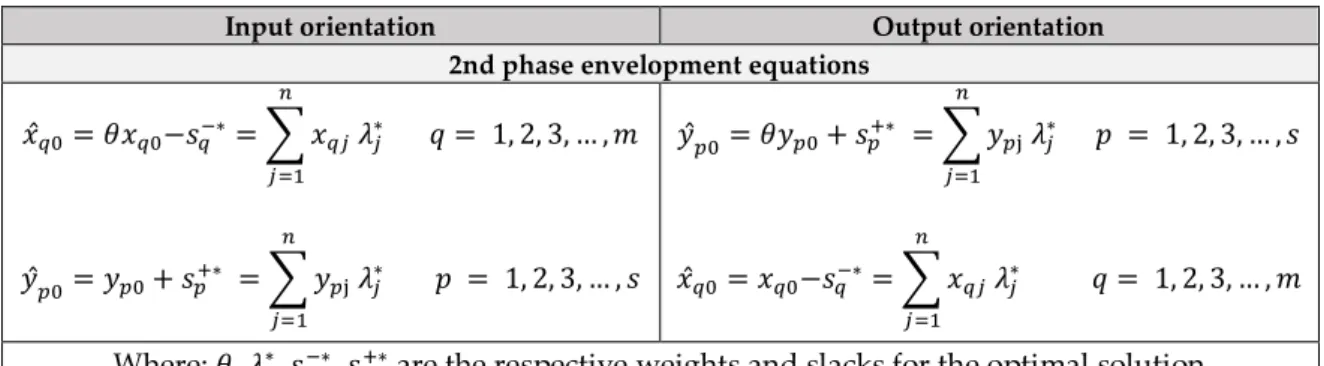
Table 7 –Second phase envelopment equations ... 34
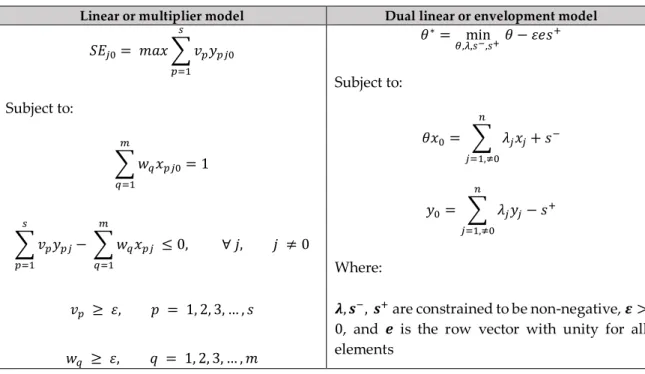
Table 8 – Expression for the CCR based Super-Efficiency model (Input-orientation) ... 35
Table 9 - Selected output and input variables for the application of the first-stage DEA ... 36
Table 10 – Fractional regression: standard models ... 40 Table 11 - Fractional regression: generalised models and partial effects of a unitary change of 𝑥𝑗
Table 12 – Correlation matrix of the selected outputs-inputs for the application of the first-stage DEA ... 45 Table 13 – Summarised statistics of the selected outputs-inputs for the application of the first-stage DEA ... 45 Table 14 - Annual TE, PTE and SE of Iberian banks during the period from 2013 to 2016... 46 Table 15 - Average annual efficiency measures of sampled Iberian banks from 2013 to 2016 ... 48 Table 16 – Annual and average IC measures of Iberian banks during the period from 2013 to 2016 ... 50 Table 17 - Summarised statistics of Iberian banks: Portuguese and Spanish differentiation ... 51 Table 18 - Correlation matrix of the applied variables for the second-stage analysis (Iberian sample)... 52 Table 19 - Selected results of the OLS and quantile regressions applying both CRS and VRS super efficiency models ... 53 Table 20 – Estimation results for the fractional regression models (Iberian sample) ... 56
List of figures
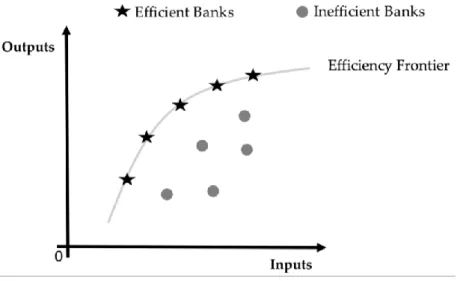
Figure 1 - Publication frequency regarding different IC Dimensions ... 13 Figure 2 - Conceptualisation of Intellectual Capital ... 14 Figure 3 -DEA efficiency frontier ... 30
Abbreviations & Acronyms
BV – Book Value
CEE – Capital Employed Efficiency CRS – Constant Returns to Scale DEA – Data Envelopment Analysis DUM – Decision Making Unit EPS – Earnings Per Share HC – Human Capital
HCE – Human Capital Efficiency IA – Intellectual Asset
IC – Intellectual Capital
ICE – Intellectual Capital Efficiency IL – Intellectual Liability
MV- Market Value
MVAIC – Modified Value Added Intellectual Coefficient
OECD – Organisation for Economic Co-operation and Development PTE – Pure Technical Efficiency
RC – Relational Capital
RCE - Relational Capital Efficiency ROA – Return on Assets
ROE – Return on Equity SC – Structural Capital
SCE – Structural Capital Efficiency SE – Scale Efficiency
TE – Technical Efficiency VA – Value Added
VAIC™ - Value Added Intellectual Coefficient VRS – Variable Returns to Scale
Chapter 1 Introduction
In the present global economy, a knowledge-based one, Intellectual Capital (IC) is progressively being recognised as the dominating resource and driver of organisational performance, efficiency, productivity, and value creation (or destruction) (Alhassan & Asare, 2016; M. Cabrita, Ribeiro da Silva, Gomes Rodrigues, & Muñoz Dueñas, 2017; Tiwari & Vidyarthi, 2018; Vale, Branco, & Ribeiro, 2016). Nowadays, IC seems to be built upon the same three-dimensional model followed by earlier conceptualisations (Inkinen, 2015; Inkinen, Kianto, Vanhala, & Ritala, 2017), namely Human Capital (HC), Structural Capital (SC), and Relational Capital (RC). These dimensions constitute IC, representing knowledge, experience, intellectual property, innovation potential, culture, external relationships, and information (Andreeva & Garanina, 2017; Kianto, Sáenz, & Aramburu, 2017; Tiwari & Vidyarthi, 2018), and are now seen as a vital input for improving performance, and thereby sustain a competitive advantage (Venugopal, Nambi, & M., 2018). This has been reflecting in the exponential increase of capital investment in immaterial resources (Intangibles Assets), in detriment of the more traditional physical resources (Tangible Assets). Hence, exploring the impact of IC efficiency on organisational performance has become a central issue in both academic and commercial fields worldwide (Inkinen, 2015; Xu et al., 2017).
Organisations have been using various measurement tools for assessing and evaluating their respective tangible (TA), and intangible assets (IA), such as IC (Pablos, 2003). VAIC™ seems to be one of the most attractive and suggested IC measurement tools (Zéghal & Maaloul, 2010) for analysing IC efficiency (Nazari & Herremans, 2007), which is used transversely in a panoply of countries and in different methodology contexts. This is due to the fact that the VAIC™ method, despite of its limitations, provides consistent and objective measurements, “which are applicable to any industry because they are designed to evaluate efficient usage of resources” (Xu et al., 2017, p. 1059).
The importance of IC transcends any specific sector particularities, beside all the intrinsic aspects that may exist, e.g. culture and inherent sectoral differences. Nevertheless, those differences may consubstantiate in the fact that some sectors are more knowledge-intensive than others. This is the case for institutions pertaining to the banking sector, which use knowledge as their main source and product in the input-output process (M. Cabrita et al., 2017).
The banking sector is entirely different from other sectors in the economy (Danisman, 2018), due to the pivotal socio-economic role it plays regionally, nationally and internationally, as banks act as financial intermediaries at the core of financial systems, by borrowing money, accepting deposits, issuing debt securities, and lending money both directly to their customers and indirectly by investing in debt securities through capital markets (Ouenniche & Carrales, 2018). After the 1970s, the liberalisation and deregulation process resulted in increased competition in the sector and has led banks to shift their focus from gathering deposits and providing loans to conducting a wider array of activities (Danisman, 2018).Therefore, banks are nowadays amongst the most important agents in the financial system by actively contributing to the efficient reallocation of resources in the market, funding enterprise projects, promoting economic growth, maintaining long-term relationships with organisations, reducing information asymmetry and share risk, hence mitigating economic fluctuation (Novickytė & Droždz, 2018).
On the other hand, in the same way, banks face great financial risks, and can become responsible for economic collapse, when in the epicentre of a potential systemic crisis by disseminating financial contagion through the interaction with other participants pertaining to the financial system (Danisman, 2018), as was the case in the subprime mortgage crisis of 2009 (Diallo, 2018). Consequently, nowadays banks comply to more stringent regulations, their financial reports are under constant scrutiny, and their performance is being continuously monitored, as a “prophylactic” approach that identifies poor performance indicators that may eventually lead to substantial financial, economic and social undesirable consequences (Ouenniche & Carrales, 2018). It is up to the regulatory and supervisory entities to properly monitor banking risks and to prevent such situations from occurring, which is not always the case due to information asymmetry (Bos & Kool, 2006).
Financial sector´s development should be seen as an essential strategy for achieving extensive sustainable economic growth in the long term (Novickytė & Droždz, 2018). Hence, it is of great importance to safeguard an effective operation of banking firms through the implementation of methods and tools that allow for the correct monitoring over the efficiency and effectiveness of management, as well as for the comparison with the best practices being followed by leaders in relevant market segments (i.e. benchmarking). Benchmarking allows for the assessment of banks´ strengths and weaknesses and, by comparison with the more efficient banks (top performers), the
One of the leading methods for efficiency evaluation and benchmarking, being applied to real world problems in an array of sectors, such as the banking one, is the Data Envelopment Analysis (DEA) method (C.-H. Tsai, Wu, Chen, Chen, & Ye, 2017). DEA is non-parametric method, which does not require a particular functional form, nor a specific structure of the shape of the efficiency frontier, thus resulting in a better method for the estimation of individual Decision Making Units (DMUs) than a parametric one (Diallo, 2018). Therefore, DEA is often suggested as the method of choice for compiling bank ratings (i.e. reference points for comparison), which takes efficiency as a key concept and is determined by comparing the related input and output variables (Ponomarenko, Kolodiziev, & Chmutova, 2017).
This study´s purpose consists in analysing both banks´ performance (through efficiency assessment) and IC efficiency (through VAIC™), as well as, their respective relationship (regression analysis). Taking into account the presented subject and framework, this study aims to analyse:
1. The evolution of Iberian banking industry´s efficiency in general, and also of both Portuguese and Spanish banking industry individually, during a recent time period, more specifically, in a post-crisis recovery period, i.e. 2013 to 2016.
2. The effect of the chosen IC-related efficiency variables on sampled banks´ performance.
Hence, to pursue the aforementioned objectives, it is important to raise a set of research questions, such as: (1) Which Iberian banks achieved maximum efficiency? (2) How are IC efficiency components related to sampled banks´ performance? (3) How do Portuguese and Spanish banks differ regarding both performance and IC efficiency?
This study applies a two-stage analysis as way to, in a first-stage, rank Iberian banks´ according to their efficiency (i.e. performance) scores, and in a second-stage, conduct the selected regression models (i.e. quantile and fractional) in order to infer about the effect of IC efficiency (using VAIC™ components) on performance (as measured by banks´ efficiency scores).
There seems to be a lack of studies that simultaneously encompass parametric (i.e. DEA) and non-parametric (i.e. regression analysis) methods for evaluating efficiency and its IC-related determinants, using a two-step analysis logic. Additionally, the existence of a study that includes data from these two EU countries, i.e. aggregating both Portugal and Spain, while applying the
aforesaid methodology for inferring about the relationship of IC efficiency on performance, is unknown to date.
Some contributions resulted from this study, namely:
1. The presentation of an efficiency analysis of sampled banks operating in the Iberian Peninsula, during the period from 2013 to 2016 (post-crisis).
2. Analysis of changes in efficiency and consequent relative positioning, including banks with maximum efficiency (i.e. efficient banks), through the application of the DEA-Super-efficiency;
3. Analysis of the determinants of banks´ performance (assessed through efficiency scores), more precisely, the components that allow for the assessment of IC efficiency (i.e. pertaining to the VAIC™ model), and also, the components of risk (i.e. Leverage ratios) and dimension (i.e. Size variable), during the proposed four-year period, through the application of both quantile and fractional regression models.
This dissertation is organised in five main chapters: In Chapter 1, an introduction to the subject is made, in which, the purpose, main objectives, and proposed research questions are outlined. In Chapter 2, a brief introduction will be made through an extensive literature review, including all theoretical and empirical evidence that sustains the subject of organisational performance and its nexus with intellectual capital efficiency. In Chapter 3, contextual setting, data collection and research methodology are described, as well as the applied variables in the first- (i.e. DEA) and second-stage (i.e. quantile and fractional regression models) analysis. Then, in Chapter 4, results are analysed and discussed, with a clear goal of identifying the existence or absence of similarities in the behaviour of bank´s performance explanatory variables, at the Iberian level (total sample of 58 Portuguese and Spanish banks), but also, at each country individual level (sample with 42 banks operating in Spain and sample with 16 banks operating in Portugal). Finally, conclusions and cues for future research are offered in Chapter 5.
Chapter 2 Literature review
2.1 Performance conceptualisation and measurement
One of the most intensively studied topics, at the management level, is entrepreneurial performance. Nevertheless, several scholars believe that there is an obvious necessity to deepen that study, and rethink the concept and measurement of performance, which is rarely defined with precision (e.g. Choong, 2014; Folan, Browne, & Jagdev, 2007; Franco‐santos et al., 2007; Lebas & Euske, 2011; Neely, Gregory, & Platts, 2005)
The difficulty in defining performance resides also in its multidisciplinary character, in its multiple coexisting dimensions, not always consistent with each other, since it is possible to appreciate performance through a myriad of perspectives, e.g. accounting, economy, human resources management, marketing, operational management, psychology, and sociology (Choong, 2014; Lebas & Euske, 2011; A. Neely et al., 2005).
Neely et al. (2005), defined performance measurement as the process of quantifying efficiency and effectiveness of a company´s equity through metrics that capture each share´s efficiency and effectiveness. Effectiveness refers to the satisfaction of clients´ necessities, while efficiency corresponds to the way an organisation´s resources are applied with the purpose of satisfying those necessities.
According to Lebas & Euske (2011), the term performance can be used while referring to an action or the result of that action, as well as to the success of that action´s result comparing to some particular reference. As for the concept, in general and empiric terms, this study delves into the term performance and relates it to the efficiency and profitability meanings.
Over the years, several methods or tools have been developed for measuring organisations´ performance. Until the 80s, performance was basically analysed through economic-financial indicators, such as: profit, sales volume, sales profitability, sales per employee, ROI, ROA, Equity profitability (e.g. ROE), appreciated either in simple form as in additive models or Dupont multiplicative, or the EVA (Economic Value Added). For many scholars these metrics were limited, because they only focused in the past and on the internal perspective of organisations, essentially only focusing in them and in their own processes (Chenhall & Langfield-Smith, 2007; Tezza, Bornia, & Vey, 2010). Therefore, these metrics do not take in account, nor measure all the critical factors
Since the 80s, pointed criticism to financial metrics allied with occurring changes in the corporate scenario (Melnyk, Bititci, Platts, Tobias, & Andersen, 2014), led to the development of more sophisticated tools, which incorporate both financial and non-financial indicators, e.g. the Strategic Measurement and Reporting Technique (SMART pyramid) from Cross & Lynch (1988); the performance Measurement Matrix from Keegan, Eiler, & Jones (1989); the Results-Determinants Framework from Brignall, Fitzgerald, Johnston, Silvestro, & Voss (1991); the Balanced Scorecard (BSC) from Kaplan & Norton (1992); the Input Process-Output-Outcome Framework from Brown (1996); and the Performance Prism (PP) from Neely & Adams (2001).
These tools measure performance in a multidimensional perspective, but they do not present a global performance index for comparing or benchmarking amongst organisations. This multidimensionality is captured through multiple indicators, which incurs in a risk of dispersing managers’ attention and in loss of focus (Neves & Lourenço, 2009). Eventually, one could summarise in a measure of performance, all the subjective weighted averages from the various analysed dimensions, as suggested by Kaplan & Norton (1996) with the BSC. This implies a previous attribution of subjective weights for analysing each variable, in each of the performance measuring methods, which has been generating a lot of controversy, and that may skew comparisons between firms (Neves & Lourenço, 2009).
2.1.1 Measuring firms´ performance through efficiency (DEA)
The abovementioned limitations to the traditional performance measurement have led to a rise in the use of frontier methods, which present a global performance index, and whose calculation requires the estimation of an efficiency frontier and the measurement of each unity´s deviation from that same frontier. Although several performance measurement methods have been developed, in the last decades, based on the frontier concept, the most popular seem to be the Stochastic Frontier Analysis (SFA) and the Data Envelopment Analysis (DEA) (Coelli, Rao, O’Donnell, & Battese, 2005).
The SFA is a parametric methodology that allows for error measurement, but that requires the previous definition of the functional form for the production function, i.e. the specification and estimation of an equation, which represents the transformation process of resources (inputs) in goods or services (outputs). On the other hand, the DEA is a non-parametric methodology, which is built upon an empirical model based on linear programming, therefore not requiring the previous
than a parametric one (Diallo, 2018). DEA is often suggested as the method of choice for compiling bank ratings (Ponomarenko et al., 2017), by taking both efficiency and effectiveness as key concepts for assessing productivity, and thus, measure performance.
Although sometimes used interchangeably, the terms efficiency, effectiveness, and productivity, have in fact distinctive semantic value. Both Efficiency and effectiveness compose productivity, which refers to the reason between outcomes (outputs) and applied resources (inputs). Efficiency (assessed by applying an input-oriented DEA) measures the efficient application of resources (doing things right), while effectiveness (assessed by applying an output-oriented DEA) measures the degree to which something is successful in producing a desired result (doing the right things) (Carvalho, 2004).
Given the DEA methodology´s flexibility and following the example of several authors (see also Appendix 3), such as (Barman, Adhikari, & Dey, 2015; Diallo, 2018; Kumar, Charles, & Mishra, 2016; Novickytė & Droždz, 2018; Ouenniche & Carrales, 2018; Ponomarenko et al., 2017; Rusydiana & Firmansyah, 2017; Said, Zouari-Hadiji, & Bouri, 2017; Sumantyo & Tresna, 2017; Vidyarthi, 2018), hence the DEA was the chosen method for the purpose of analysing the performance of the sampled Iberian banks. This is one of the leading methodologies for efficiency evaluation and benchmarking, being applied to real world problems in a multitude of sectors, such as the banking one (Cook, Tone, & Zhu, 2014; C.-H. Tsai et al., 2017). The two-stage analysis methodology applied in this study will be more thoroughly explained in Chapter 3.
Basílio, Pires, & Reis (2016), studied 24 Iberian (10 PT and 14 ES) banks´ efficiency in a first-stage (applying DEA) and its determinants in a second-stage (Generalised Linear Model with a fractional response model), from 2008 to 2013 (6 years). For the DEA an intermediation approach was followed, in which, personal expenses and deposits were chosen as the inputs, while Loans was the chosen output. These authors found Spanish banks to be slightly more efficient than their Portuguese counterparts, and positive and significant effect of liquidity on overall efficiency, and positive and negative (significant) impacts of the capitalisation variable on PT and ES banks´ overall efficiency, respectively. Also, Ghaeli (2017), studied the efficiency of 26 US banks (DMUs) in 2016, using Total Assets and Number of Employees as inputs, and Net Revenue as output for the DEA. The authors found “Santander” to be the most efficient bank operating in the US followed by “SunTrust” and “HSBC”, and that the other banks preserved lower efficiency in comparison. Liu (2018), studied the efficiency of 29 foreign commercial banks in Taiwan (DMUs), from 2011 to 2014 (4 years), using
Operating Resources (inputs), Interest and Non-Interest Revenue (outputs) for the DEA (3-stage model). The authors found that most foreign banks need to reduce more inputs in the third stage than in first stage to achieve relative efficiency, and that using a three-stage DEA approach can result in a more specific and precise set of criteria for true managerial efficiency. Novickytė & Droždz (2018), studied the performance efficiency of 6 commercial banks in Lithuania, from 2012 to 2016 (5 years), using Deposits, Labour expenses, Debts to banks and other financial institutions (inputs), Operating Profit, Loans, Profit before tax, and Net interest income (outputs) for the DEA (5 alternative models with different input-output combinations). The authors found that local banks show better efficiency results on the VRS assumption, while the CRS assumption shows that banks owned by the Nordic parent group and branches, have higher pure efficiency and success at working at the right scale than local banks. Ouenniche & Carrales (2018), studied the efficiency of 109 commercial banks in the UK, from 1987 to 2015 (29 years), using Resources, Costs (inputs), and the ability to provide both financial services and generate revenue (outputs) for the DEA (regression-based feedback mechanism, and models without explicit inputs (WEI) or outputs (WEO)). The author found that, on average, commercial banks in the UK (domestic or foreign) are yet to achieve acceptable levels of overall TE, PTE and SE, and also, that a linear regression-based feedback mechanism proves effective at improving discrimination in DEA unless the initial choice of inputs and outputs is well informed. Martins (2018), studied the efficiency of 26 Portuguese banks, from 2005 to 2010 (6 years), using two-stage models for obtaining efficiency scores for both production and intermediation approaches. For the production approach, these authors chose Equity, Nº of employees, and Nº of branches as inputs, while selecting deposits as the only output. In the intermediation approach, the deposits variable was chosen as the only input, while Loans, Gross Value Added, and Shareholder value creation, were chosen as the outputs. Furthermore, the author applied a fractional regression model for inferring about the effect of the selected 18 independent variables (classified into five categories, namely, competition, human resources, dynamics, finance, and characteristics). The author found that the average efficiency level was of 69,7%, and the internationalisation and dimension variables appear to have a major positive influence on overall efficiency.
2.2 Intellectual Capital
The term Intellectual Capital (IC) is not a new one. In fact, its use dates back to the 19th century, when the economist Nassau William Senior applied the term in his 1836´s book “An Outline of the Science of Politic Economy” (Marr, 2007). However, due to the scope and substance of its application, some authors also give a great relevance to the seminal use of the term by John Kenneth Galbraith in his 1967´s and 1969´s publications (Chang & Hsieh, 2011; Dyakona, 2015; Garcia‐Parra, Simo, Sallan, & Mundet, 2009; Hsu & Fang, 2009; Xu et al., 2017). Although Galbraith was not a pioneer in the use of the term IC, he was the first scholar to conceptualise and study it within the context of knowledge-intensive industries, and to relate the term with the concept of capital, describing IC as knowledge that generates profit or helps in the creation of other values (Dyakona, 2015).
Nowadays, this conceptualisation can be considered incomplete, ambiguous and even inadequate, however it captured some of the essence of IC, and is somewhat aligned with the connection of thought followed by contemporary definitions. According to Marr (2007), there are no right or wrong definitions of IC, only adequate or inadequate ones. This author claimed that a least adequate definition results from failing to concisely construct IC, leaving it open to different possible interpretations from the readers. As to be expected, these definitions have been evolving over the years with the blooming of new IC literature. Nevertheless, authors like Ozkan, Cakan, & Kayacan, (2017), W.-K. Wang, Lu, Kweh, & Cheng (2014), and Zéghal & Maaloul (2010), claimed there was no commonly accepted definition for the construct of IC at the time, and that premise still applies today.
One of the reasons for this lack of convergence (to some extent) regarding the construct of IC has to do with, the confusion raised by the application of diverse terminology and taxonomies (e.g. IC, Intangible Assets (IA), Intangible Liabilities (IL), Intellectual Property, Knowledge-based Assets, etc.), in some cases interchangeably, drawn from several fields of study (Anifowose, Rashid, & Annuar, 2017; Garcia‐Parra et al., 2009; Joshi, Cahill, Sidhu, & Kansal, 2013; Xu et al., 2017), e.g. Economy, Strategic Management, Finance, Accounting, Human Resources, Marketing, etc., which restricts the potential for generalisation and comparability (Marr, 2007). This incongruity between definitions and taxonomies, and the resulting proliferation of diverse classifications and measurement techniques, indicates methodological and practical difficulties (OECD, 2008).
Chronologically speaking, IC research can be said to have been developed in two major phases (Inkinen, 2015). The first phase occurred in 1990s with the publishing of the more theoretical papers
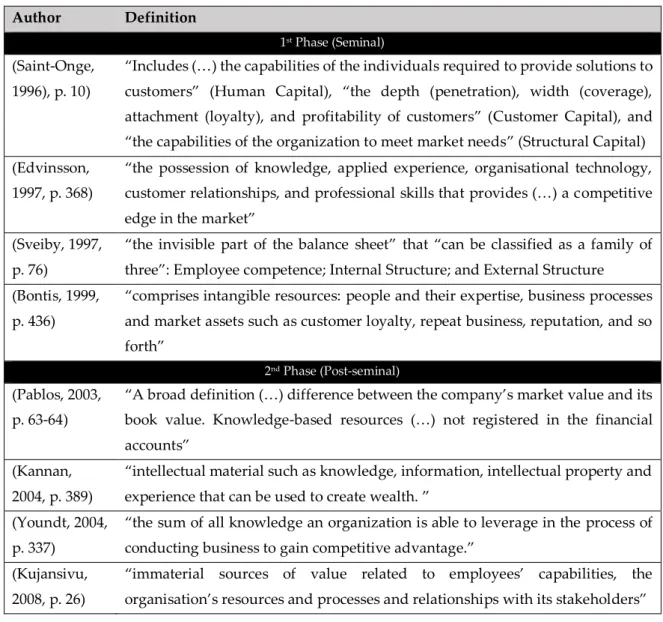
made by seminal authors like Bontis (1999), Kaplan & Norton (1992), Pulic (1998), Edvinsson (1997), Saint‐Onge (1996), Sveiby (1997), which gave the IC subject some momentum (Tiwari & Vidyarthi, 2018) and publicity, therefore attracting more attention, and making it a more thoroughly studied topic (Cheng, Lin, Hsiao, & Lin, 2011; Joshi et al., 2013; Martín-de-Castro, Delgado-Verde, López-Sáez, & Navas-López, 2011; Zéghal & Maaloul, 2010). Consequently, a second phase succeeded in the early 2000s (i.e. everything post-seminal), which has been focusing on the IC measurement methods and new levels of analysis (Inkinen, 2015). Before delving into those methods and other aspects of IC, one should try to define the term based on the revised literature. Table 1 contains a chronological-summary of a few selected IC definitions.
Table 1 – Chronologically-ordered Intellectual Capital definitions
Author Definition
1st Phase (Seminal)
(Saint‐Onge, 1996), p. 10)
“Includes (…) the capabilities of the individuals required to provide solutions to customers” (Human Capital), “the depth (penetration), width (coverage), attachment (loyalty), and profitability of customers” (Customer Capital), and “the capabilities of the organization to meet market needs” (Structural Capital) (Edvinsson,
1997, p. 368)
“the possession of knowledge, applied experience, organisational technology, customer relationships, and professional skills that provides (…) a competitive edge in the market”
(Sveiby, 1997, p. 76)
“the invisible part of the balance sheet” that “can be classified as a family of three”: Employee competence; Internal Structure; and External Structure (Bontis, 1999,
p. 436)
“comprises intangible resources: people and their expertise, business processes and market assets such as customer loyalty, repeat business, reputation, and so forth”
2nd Phase (Post-seminal)
(Pablos, 2003, p. 63-64)
“A broad definition (…) difference between the company’s market value and its book value. Knowledge-based resources (…) not registered in the financial accounts”
(Kannan, 2004, p. 389)
“intellectual material such as knowledge, information, intellectual property and experience that can be used to create wealth. ”
(Youndt, 2004, p. 337)
“the sum of all knowledge an organization is able to leverage in the process of conducting business to gain competitive advantage.”
(Kujansivu, 2008, p. 26)
“immaterial sources of value related to employees’ capabilities, the organisation’s resources and processes and relationships with its stakeholders”
(Zéghal & Maaloul, 2010, p. 41)
“the sum of all knowledge a company is able to use in the process of conducting business to create value – a VA for the company”.
(Alipour, 2012, p. 54)
“group of knowledge assets that are owned and/or controlled by an organization and most significantly drive organization value creation mechanisms for targeted company key stakeholders”
(Dyakona, 2015, p. 70)
“the aggregate of human, structural, consumer, organizational, process, innovative and cultural qualities of society, which are acquired through learning, skills and experience, applied in intellectual activity by each member of society individually or collectively and increase work efficiency.”
(Andreeva & Garanina, 2017, p. 32),
Defined IA as: “Knowledge, know-how, innovation potential, licence agreements, management culture, and other resources of company growth.”
(Cabrita et al., 2017, p. 3)
“Skilled employees as well as sound infrastructures, networking systems, information systems, innovativeness, brand name, trademarks and knowledge bases (…) needed to facilitate the delivery of high value-added products and services”.
(Vidyarthi, 2018, p. 2)
“knowledge, experience, intellectual property and information”, which enhances “productivity, efficiency, and profitability”.
As may be seen from the aforementioned definitions (Table 1), initial investigation on IC was mostly based on the fact that financial accounting could not explain the existing discrepancy between MV and BV (Anifowose et al., 2017; Appuhami, 2007; Kujansivu & Lönnqvist, 2007). Therefore, prior studies defined IC as the hidden value in traditional financial statements, which traditional reporting frameworks failed to identify (Brennan & Connell, 2000; Edvinsson, 1997; Pablos, 2003; Sveiby, 1997). Those definitions seem inadequate by today’s standards, nevertheless they touched some pertaining aspects about IC conceptualization, measurement, and reporting.
Bontis (1999), alleged that the hidden value in organisations financial reports could be partly explained by the traditional focus on reporting tangible assets in the annual reports, which could be explicitly calculated. Conversely, knowledge is mostly tacit and therefore difficult to measure, evaluate and report (Guthrie, Ferrier, & Wells, 1999). Guthrie et al. (1999), claimed that accounting practice did not provide for correct measure and evaluation of the intangibles such as staff competencies, customer relationships and models, nor even for the more traditional intangibles such as brand equity, patents, and goodwill, which not long ago, had also been omitted from the financial reports.
Therefore, this “hidden value theory” was preponderant for establishing the bases for future literature and spurred further investigation on the topic. Since then, other scholars have come along with their own idiosyncratic definitions of IC, which are normally linked to different disciplinary assumptions. Although this inter-disciplinary approach to the conceptualisation of IC seems a major source of divergence amongst the myriad of IC definitions, it is also a way for the “under-developed” perspectives of IC (e.g. Marketing, HR, Accounting) to improve their conceptualisation, measuring, and reporting approach, based on “more developed” ones, e.g. the economist and strategy perspectives (Marr, 2007).
Vale et al. (2016) claimed that IC conceptualizations tend to focus only on future benefits (e.g. competitive advantage, improved efficiency and productivity, and value creation) that IC investments (i.e. Intellectual Assets - IAs), may present, while future losses (e.g. bad application of IC investments, deterioration/destruction of IAs) from those investments (i.e. Intellectual Liabilities – ILs) seem to be relegated. This approach is based on two perspectives over ILs, i.e. a strategic and an accounting one (Garcia‐Parra et al., 2009), which explains the potential causes for organisational deterioration.
Based on Table 1 and other revised literature, we can try to define IC as a set of immaterial resources, not touchable by its nature (intangibles), such as knowledge, experience, intellectual property, innovation potential, culture, external relationships and information (Andreeva & Garanina, 2017; Kianto et al., 2017; Vidyarthi, 2018), which may be leveraged, and over time (Giuliani, 2015) result in “a Value added (VA) for the company”(Zéghal & Maaloul, 2010, p. 41), or in a deteriorated one (Vale et al., 2016; Vale, Ribeiro, & Branco, 2017).
2.2.1 IC and its dimensions
As can be seen from the aforementioned concepts and descriptions, there is still a lot of work to be done for achieving a standard definition of IC. Nevertheless, there seems to be a common base, grounded on seminal literature, suggesting a three-dimensional conceptualisation of IC (Anifowose et al., 2017; Bontis, Chua, Keow, & Richardson, 2000; M. do R. Cabrita & Bontis, 2008; M. Cabrita et al., 2017; Cavicchi & Vagnoni, 2017; Costa, 2012; Javornik, Tekavcic, & Marc, 2012; Özer, Ergun, & Yılmaz, 2015).
seem to use slightly altered terminologies, and/or add other subdivisions (Alipour, 2012; Inkinen et al., 2017; Javornik et al., 2012). Figure 1 results from the tracking of varied IC dimensions applied in the revised literature by Inkinen (2015). This author claims that highly cited publications from seminal authors have indeed “shaped the empirical state of the field” of research, which “is rarely conducted without incorporating human and structural/organisational capital within the measurement model”, (e.g. VAIC™), and also, “relational/customer capital as the third dimension”, p. 528.
Figure 1 - Publication frequency regarding different IC Dimensions
Source: (Inkinen, 2015)
Social Capital seems to be gaining more supporters (Figure 1) and has emerged as a fourth dimension of IC. However, this dissertation will be focusing on the three most commonly cited dimensions of IC (Figure 1 and 2), i.e. Human Capital (HC); Structural Capital (SC); and Relational Capital (RC), which are more related to the chosen VAIC™ method.
Figure 2 - Conceptualisation of Intellectual Capital
Source: (Bontis, 1999)
2.2.1.1. Human Capital
According to Ahangar (2011), p. 89, Human Capital (HC) is the most studied dimension of IC, and recognized as an organisation´s “largest and most important” intellectual asset. Kianto et al., (2017), referred to HC as “the most significant element of IC, because a firm can accomplish nothing ( including innovation) without it”, p. 12. Yang & Lin (2009), p. 1968, defined HC as the “core asset of an organisation”, that sustains a competitive advantage; “the greatest and most powerful asset”, which is composed by “knowledge, skills, experience, competence, attitude, commitment, and individual personal characteristics.”.
In essence, HC is the basic component for the IC process (Chahal & Bakshi, 2014), constituted by knowledge (explicit and tacit) generated and controlled by an organisation´s employees (Martín-de-Castro et al., 2011) and their idiosyncrasies, e.g. loyalty, versatility or flexibility (M. Cabrita et al., 2017), which represents a source of innovation and strategic renewal (Ahangar, 2011; Bontis, 1999; Kianto et al., 2017; C.-H. Liu, 2017a). Therefore, HC is not an asset owned by an organisation (Bontis et al., 2000), but the sum of all individual and collective innovation knowledge, which combines intelligence, skills, and expertise (Bontis, 1999), gathered by personnel within an organisation with
well turn into an IL, and therefore value may disappear if not properly managed (Dumay, 2016), by getting deteriorated or destroyed (Vale et al., 2016, 2017).
Martín-de-Castro et al. (2011) considered three main dimensions for categorizing the nature of HC, such as: Knowledge (i.e. formal education, specific training, experience, and personal development), Abilities (i.e. individual learning, collaboration-team work, communication and leadership), and Behaviours (i.e. felling of belonging and commitment, self-motivation, job-satisfaction, friendship, flexibility, and creativity).
As “knowledge generation and transfer is an essential source of firm´s sustainable competitive advantage” that “entirely depends on individuals´ willingness” (Cabrita & Vaz, 2005, p. 12), hence HC has been drawing more attention and investment from the organisations. Therefore, Human Resources Management (HRM) practices (i.e. recruiting and selection, health and safety, performance and appraisal, and training and development) have been seen as a crucial investment, since it can have a significant impact (positive or negative) in HC, and consequently, in innovation (Kianto et al., 2017), sustainable development (Cavicchi & Vagnoni, 2017), value creation (Yang & Lin, 2009), and in the overall company success (Inkinen, 2015). Again, this can work both ways, which means that a bad HRM practices implementation, may actually deteriorate HC, and thus negatively impact an organisation’s performance (Vale et al., 2016, 2017).
2.2.1.2 Structural Capital
Structural Capital (SC) can be seen as a supportive infrastructure (Ahangar, 2011), which comprises all non-human assets (M. do R. Cabrita & Bontis, 2008; Rehman, Rehman, & Zahid, 2011) owned by, and that therefore, stay within the organisation when employees go back home (Ahangar, 2011). Conversely to HC, SC “is an intangible asset that can be traded, reproduced and shared within the firm (Mehralian, Rasekh, Akhavan, & Ghatari, 2013), and as such, can be protected by law as intellectual property (Martín-de-Castro et al., 2011).
One may describe SC as the skeleton and the glue of an organisation, as it provides the tools for retaining, packaging, and moving knowledge, generated by HC, along the value chain, and therefore, may constitute a strategic asset, which embodies the information systems, routines, procedures, strategies, organisational charts, databases, managerial philosophies, organisational culture, patents, copy rights, trademarks, and anything whose material value is lower than the value to the organisation (Bontis et al., 2000; M. do R. Cabrita & Bontis, 2008; Y.-S. Chen, 2008), thus
necessary for the transformation of HC into business intellect (Nazari & Herremans, 2007). Organisation´s SC may be used to “inspire employees to question the prevailing learning culture norms and initiate new ways of thinking”, (Liu, 2017, p. 15), therefore fostering innovation “by providing a (collective) infrastructure for knowledge development activities within an organization.” (Kianto et al., 2017, p. 12).
One important constituent of SC is organisational culture, which composes the beliefs, core values, traditions and pervasive mind-sets within an organization, and “results in a language, symbols, and habits of behaviour and thought” (Bontis, 1999, p. 450). According to Bratianu et al. (2011), culture is a powerful integrator as it acts on individual intelligence and individual core values, contributing to the development of IC with potential for innovation.
Structural Capital seems to be the most applied term within the existing nomenclature for this class of IC (Appuhami, 2007; Bontis et al., 2000; M. Cabrita et al., 2017; Dyakona, 2015; Inkinen, 2015). However, other scholars have divided SC into other subcategories, such as Customer Capital and Organisational Capital (Edvinsson, 1997; C.-H. Liu, 2017b), and some have gone even further by also subcategorizing Organisational Capital into Process Capital and Innovation Capital (Nazari & Herremans, 2007). Anifowose et al. (2017), claimed that there was some ambiguity regarding the conceptualisation of SC and its taxonomies, therefore the author pertinently proposed a tripartite categorisation: (1) Innovation Capital (i.e. direct consequence of an organisation´s culture), (2) Protected Capital (i.e. IAs covered by legal protection - Intellectual Property), and (3) Process Capital (i.e. workflow, operation processes, specific methods, business development plans, information technology systems, cooperative culture, etc. (Hsu & Fang, 2009).
2.2.1.3 Relational Capital
Relational Capital (RC) is a transitional type of IC (Anifowose et al., 2017) encompassing the knowledge embedded in all the interactions an organisation develops (Nazari & Herremans, 2007), whether it is of market channels, customer and supplier relationships, as well as a profound understanding of governmental or industry association influences, representing the potential an organisation has to externalize its intangibles (Bontis, 1999). Hence, when talking about RC one should focus on the way organisations absorb, exploit and explore new knowledge from its environment (e.g. business ties) to obtain and sustain a competitive advantage (Martín-de-Castro et
According to Bontis (1999), RC is the most difficult of the three dimensions to develop since it is the most external to the organisation´s core, thus the most difficult to codify, and that can only be measured through a function of longevity, which relates to the dynamic process of value creation or destruction that evolves over time view of IC (Giuliani, 2015; Vale et al., 2016). Some of the knowledge composing RC can be considered proprietary, but merely within a temporal perspective and not with a great degree of confidence (Guthrie et al., 1999).
Although some researchers have been using distinct terminology for this class o IC (Inkinen, 2015), such as Social Capital (C.-H. Liu, 2017a, 2017b; W. Tsai & Ghoshal, 1998), Customer Capital (C.-H. Liu, 2017b; Saint‐Onge, 1996) and External Structure (Sveiby, 1997), nowadays, the vast majority of scholars seem to adopt the term RC (Hassan, Mei, & Johari, 2017; Inkinen et al., 2017; Tiwari & Vidyarthi, 2018; Vidyarthi, 2018; Xu et al., 2017), as it is more relatable to the concepts proposed by sociologists (Youndt et al., 2004).
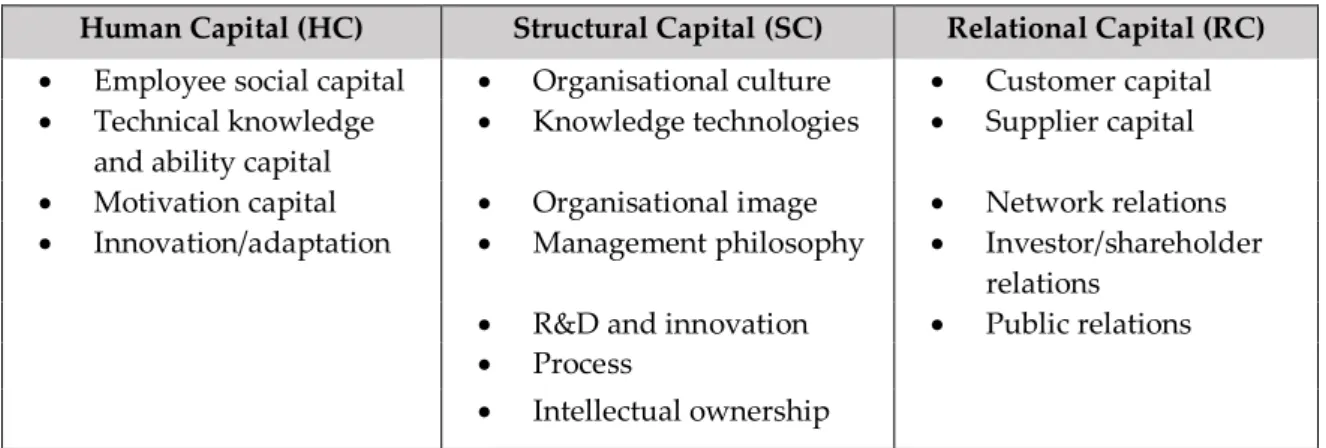
Youndt et al. (2004), referred that an organization might have the ability to develop each dimension of IC independently. However, these authors also indicated that many of the theoretical foundations of IC developed by literature across organisational learning and knowledge management, seem to confirm the existence of a significant positive interdependency between the aforementioned three dimensions (Table 2). Liu (2017a) and (2017b), also seems to confirm this interconnection by suggesting that Social Capital (i.e. RC) and Organisational Capital (i.e. SC) can increase the effects of innovation behaviour that can result from the development of HC, via connecting internal and external resources. Kianto et al. (2017), also corroborated this interconnection by suggesting that knowledge-based HRM could partially impact SC and RC through HC, and that, on the other hand, HC could impact innovation through SC and RC.
Table 2 – Factorial summary of each IC dimension
Human Capital (HC) Structural Capital (SC) Relational Capital (RC)
• Employee social capital • Organisational culture • Customer capital • Technical knowledge
and ability capital
• Knowledge technologies • Supplier capital • Motivation capital • Organisational image • Network relations • Innovation/adaptation • Management philosophy • Investor/shareholder
relations • R&D and innovation • Public relations • Process
2.2.2. IC measuring methods and tools
Organisations have been using various measuring tools to value their respective tangible, and intangible assets, such as IC (Pablos, 2003). According to the existent literature, the suggested methods for IC measuring could be decomposed in four main categories (Table 3), namely Direct, Scorecard, Market Capitalisation, and Return on Assets methods (Sveiby, 2010).
Table 3 – IC measuring methods categories
Method Definition
Estimate the monetary value of intangible assets by identifying its various micro-components. Once identified, these components can be directly evaluated, individually or as an aggregated coefficient (e.g. Dynamic Monetary Model and The Value explorer™).
Similarly to the DIC approach, but without determining monetary value, the various micro-components of intangible assets are identified. Indicators and indices generated are then reported in scorecards or charts (e.g. Balanced Score card, Intangible Asset Monitor and Skandia Navigator™)
Calculate a monetary amount for IC by determining the difference between a company´s market capitalisation and its stockholders’ equity (e.g. Tobin´s q and The Invisible Balance Sheet).
Uses average pre-tax earnings and divides them by the average tangible assets of the company for a period of time. This results in an indicator (ROA) that is then compared with its industry average. The difference from these two indicators (company´s and industry´s average) is then multiplied by the company´s average tangible assets, reflecting the average annual earnings from the intangibles. Dividing the above-average earnings by the company´s average cost of capital or an interest rate provides an estimate for the value of its IC (e.g. Knowledge Capital Earnings, Economic Value Added, VAIC™).
Source: Adapted from Sveiby (2010)
Without delving too much into the pros- and cons- of each category, there is one particular decision factor that stands out, which is the availability of the data required for the application of the chosen method. The SCM and DIC methods require non-public and therefore, less accessible data, whilst the ROA&ROE methods (e.g. VAIC™), normally apply financial indicators to measure IC based on
Market Capitalisation Methods (MCM) Direct Intellectual Capital (DIC) Scorecard Methods (SCM) Return on Assets (ROA)
audited reports, thus making these methods the most widely used amongst practitioners (Xu et al., 2017).
There are several measuring methods that fit into each of those four categories. In fact, Sveiby (2010), discriminated at least forty-two methods for measuring IC. The Skandia Navigator (Edvinsson, 1997) is one the most frequently cited seminal methods, since it gave a crucial contribute and ignited the debate and promotion for further research regarding the IC measurement conundrum. Other frequently cited methods are, e.g., the Balanced Scorecard (Kaplan & Norton, 1992), the Intangible Asset Monitor (Sveiby, 1997), and the Value Added Intellectual Coefficient - VAIC™ (Pulic, 1998). This dissertation will focus on the VAIC™ model, since it is the IC measuring method of choice for this study.
2.2.2.1 Measuring IC and its efficiency: The VAIC™ model
The Value Added Intellectual Coefficient (VAIC™) method was introduced by Pulic, partially based on the Skandia Navigator (Pulic, 1998, 2004), as a value creation efficiency analysis, which uses data collected from audited financial reports to identify efficiency of IC (Nazari & Herremans, 2007). In fact, the VAIC™ method works for the assessment of both value creation or destruction, as IC efficiency may indicate that value is being destroyed and not created (Pulic, 2004).
The VAIC™ method provides consistent and objective measurements, “which are applicable to any industry because they are designed to evaluate efficient usage of resources” (Xu et al., 2017, p. 1059). That is one of the reasons why this method remains one of the most attractive and suggested methods to measure IC (Zéghal & Maaloul, 2010) amongst both academic and commercial fields (Xu et al., 2017).
In the VAIC™ method, after calculating the added value (i.e. VA) generated by the organisation, then the created value-added coefficient is calculated according to the different types of resources involved, (Xu et al., 2017), whether its financial capital (physical, i.e. Capital Employed - CE) or IC (intangible). In other words, VAIC™ measures the value added created per monetary unit invested in each type of resource (i.e. VAIC™ components: Human Capital Efficiency – HCE; Structural Capital Efficiency – SCE; and Capital Employed Efficiency – CEE) (Ozkan et al., 2017).
This method has been applied for measuring organisation´s IC efficiency with good results, in particular when correlated with profitability indicators, such as Price-to-Earnings ratio (PER), Return
on Assets (ROA), Return on Investment (ROI) and Return on Equity (ROE) (Joshi et al., 2013; Maditinos, Chatzoudes, Tsairidis, & Theriou, 2011; Phusavat, Comepa, Sitko‐lutek, & Ooi, 2011; Rehman et al., 2011). Other popular approaches consist in combining the components of the VAIC™ with frontier methods, such as the Data Envelopment Analysis (DEA), which allows for the assessment of the efficient application of multiple Inputs (e.g. VAIC and components) and their effective transformation into outputs (e.g. performance variables), or the application of the VAIC™ as a mean of obtaining the necessary independent variables for relating IC and Performance through the regression models applied in the two-stage analysis, which is adopted for this study and explained further ahead in Chapter 3.
In Table 4 it can be seen a summary of the VAIC™ method advantages and limitations. Although, the method presents some downsides, there is no perfect method currently available (Joshi et al., 2013), hence one should select a suitable method, according to the purpose, situation and audience (Sveiby, 2010). That is probably one of reasons for the recurring adoption of the VAIC™ method for studying bank performance (Ozkan et al., 2017; Xu et al., 2017).
Therefore, this method was chosen taking in account its advantages, as they make it an appropriate measure for the purpose of this study. The process followed in the calculation of the VAIC™ method will be more thoroughly explained in the methodology section, in 3.3.3 (see also appendix 6).
Table 4 – Summary of VAIC model advantages and limitations
Value Added Intellectual Coefficient (VAIC™)
Advantages Limitations/Critiques
• Easy to apply and calculate; • Produces consistent, standardised,
quantifiable and objective measurements;
• Needed data is publicly disclosed and can be found in organisation´s audited reports (reliability); • Verifiability of the data gathered; • Comparability (e.g. traditional
financial indicators;
benchmarking);
• Provides indicators that are relevant, useful and informative to all stakeholders;
• Treats HC as the most important source of IC, which corroborates all major IC definitions found in the literature (Though, HC calculation is based on labour costs only, which is criticised);
• In addition to Pulic´s work, has more than 30 published studies in the past decade;
• The method uses overlapping variables (e.g. variables are pure financial parameters; indicates the efficiency of labour and capital investments); • Components are calculated from organisation
accounts; thus, one may consider that the method only measures operating efficiency, but has no actual connection to IC (e.g. HC is merely based on human resources costs);
• The derivation of SC appears as one of the weakest points of the model, lacking economic explanation (SC = VA – HC, which equals Operational Profit); • SCE results as SC divided by VA, which resembles
VA efficiency rather than SCE;
• R&D expenditure and advertising expenses, which are generally considered the drive for technological advancements and growth (should be treated as asset-like investments), are expensed as incurred (accounting standards), thus subtracted from the calculation of VA (i.e. omitted from the VAIC™ model).
• Does not generate valuable analysis in organisations whose Input surpasses Output (i.e. organisations with negative BV or OP);
• Does not take organisation risk into account (important factor for determining the value of an organisation and its IC;
• Does not deal with RC (Although, there are other Modified variants that do (e.g. MVAIC);
Source: (Chan, 2009a; Javornik et al., 2012; Kehelwalatenna, 2016; Kujansivu & Lönnqvist, 2007; Maditinos et
al., 2011; Ming‐Chin, Shu‐Ju, & Yuhchang, 2005; Nadeem, Dumay, & Massaro, 2017; Pulic, 2004; Ståhle, Ståhle, & Aho, 2011)
2.2.2.2 Modifying the original VAIC™: developing the formula
Several scholars have been working on new altered versions (e.g. MVAIC or M-VAIC, and Extend VAIC), which try to suppress the abovementioned critiques to the original VAIC™ model (Nadeem et al., 2017; Nazari & Herremans, 2007; Tiwari & Vidyarthi, 2018; Vidyarthi, 2018). These variations consist in adding new components to the formula, e.g. measuring Relational Capital Efficiency (RCE) via marketing expenses, and/or proposing new variables for calculating some of the other components, e.g. measuring SC through R&D expenses, and also adding back this expenses to the calculation formula of VA thus considering R&D as an investment rather than a cost (Nadeem et al., 2017).
While these new variants seem to fix some of the original model´s limitations, they also seem to require more sensible, and therefore, less accessible data (e.g. R&D, selling and marketing expenses), which turns what used to be an advantage in a downside for the model. Furthermore, previous work based on these new altered versions of the VAIC™ method does not appear to demonstrate any significant effect, since it has been producing divergent results (Nadeem et al., 2017).Nevertheless, these modified variants may represent a step in the right direction for improving the original model. The table presented in appendix 5, highlights the major differences between original VAIC™ and variants equation formulas, as well as the necessary variables for their respective calculation.
2.3 Relating firms´ IC and Performance
Assessing an organisation´s performance has been considered of extreme importance in the present globalised and technically advanced economy (Alipour, 2012), and consequently, so the accurate measurement of IC and its efficient application, as a determining factor for achieving optimal effectiveness and efficiency (i.e. obtain the best outcome applying less intellectual and non-intellectual resources ). Hence, several scholars have been applying some of the abovementioned methods and tools for measuring both IC and performance, and by relating them through different approaches.
The more common approach consists in using parametric methods (e.g. regression analysis) for measuring the average performance for a given population (Shewell, 2016). Thus, several scholars have been trying to apply the VAIC™ model (Appendix 1, 2 and 3) and to correlate it with other financial indicators (Nadeem et al., 2017), e.g. ATO, Earning Per Share (EPS), ROA and ROE.
Alipour (2012) studied 39 Iranian insurance firms between 2005 and 2007, having found a positive and significant relationship between VAIC™ (and all its components) and performance (ROA). M. Wang (2011) studied several Taiwanese companies, having found a positive relationship between VAIC™ and performance (ROA) and market capitalisation. Maditinos et al. (2011) studied 96 Greek companies from 4 sectors for a three-year period, having found a positive relationship between HCE and performance (ROE). Tan, Plowman, & Hancock (2007) studied 150 Singapore listed companies for a two-year period, having found a correlation between IC and performance, and also that the contribution of IC to performance will differ across industries. Veltri & Silvestri (2011) studied all financial sector firms listed in the Italian stock exchange between 2006 and 2008, having found positive relationship between BV and MV on the one hand, and IC components (VAIC) and MV on the other. Goswami & Maji (2016) studied 100 listed Indian companies between 1999 and 2012, having found a positive and significant relationship between VAIC™ and performance (ROA). This author also found that the impact of IC efficiency on ROA was greater on knowledge-based sectors than in traditional ones.
Nevertheless, results are far from being unanimous, as other studies presented mixed, contrary, or inconclusive results. Kujansivu & Lönnqvist (2007) studied Finnish companies from 11 industry sectors between 2001 and 2003, and were not able to clarify the existence of a relationship between value and efficiency of IC. Firer & Williams (2003) studied 75 publicly traded firms in South Africa