BIRD COMMUNITIES IN TWO FRAGMENTS OF
SEMIDECIDUOUS FOREST IN RURAL SÃO PAULO STATE
POZZA, D. D. and PIRES, J. S. R.
Laboratório de Análise e Planejamento Ambiental (LAPA), UFSCar, C.P. 676, CEP 13565-905, São Carlos, São Paulo, Brazil
Correspondence to: Didier David Pozza, Mestrado em Ecologia, Laboratório de Análise e Planejamento Ambiental (LAPA), UFSCar, C.P. 676, CEP 13565-905, São Carlos, São Paulo, Brazil,
e-mail: [email protected]
Received March 18, 2002 – Accepted July 16, 2002 – Distributed May 31, 2003 (With 1 figure)
ABSTRACT
A quali-quantitative survey was done in two fragments (75 and 100 ha) of semideciduous forest in ru-ral São Paulo State. The aim was to characterize the bird community according to richness, abundance, and occurrence frequency in these areas. The qualitative survey showed 145 species in the Estação Ecológica de São Carlos – EESCar (Brotas) – and 173 in the Fazenda Santa Cecília – FSC (Patrocínio Paulista), while the quantitative survey showed the presence of 60 and 72 species in EESCar and FSC respectively. The isolation and the lower environmental quality of the EESCar fragment may be responsible for the lower number of species in this area compared to that of FSC. Abundance index value analysis (IPA) showed that both areas have a large number of species with low IPA and few species with intermediate or high IPA compared to the pattern observed in other surveys. At FSC, a larger number of occurrences of species in danger of extinction in São Paulo State was also observed. Apparently, the FSC fragment had bet-ter environmental quality for shelbet-tering a larger number of species, including the endangered ones. The study of the community of birds is important in planning management and conservation of natural ar-eas.
Key words: bird community, semideciduous forest.
RESUMO
Avifauna em dois fragmentos de floresta estacional semidecídua do interior paulista Foi realizado o levantamento quali-quantitativo de dois fragmentos (75 e 100 ha) de floresta estacional semidecídua do interior paulista. O objetivo foi caracterizar a comunidade de aves por intermédio da riqueza, abundância e freqüência de ocorrência nessas áreas. O levantamento qualitativo revelou 145 espécies para a Estação Ecológica de São Carlos – EESCar (Brotas) – e 173 para a Fazenda Santa Cecília – FSC (Patrocínio Paulista), enquanto o levantamento quantitativo mostrou a presença de 60 e 72 espécies para EESCar e FSC, respectivamente. O isolamento e a pior qualidade ambiental do fragmento da EESCar podem ser responsáveis pelo menor número de espécies dessa área em relação à FSC. Analisando o índice pontual de abundância (IPA), observa-se que ambas as áreas possuem grande número de espécies com baixo IPA e poucas espécies com IPA intermediário ou alto, conforme observações feitas em outros levantamentos. Na FSC foi observado também maior ocorrência de espécies ameaçadas de extinção no Estado de São Paulo. Aparentemente, o fragmento da FSC possui melhor qualidade ambiental para abrigar um maior número de espécies, inclusive as ameaçadas. O estudo da comunidade de aves é importante para a elaboração do plano de manejo e conservação das áreas naturais.
INTRODUCTION
Semideciduous forests (SSF) of central São Paulo (Veloso et al., 1992) have suffered intense devastation (Schlittler, 1999), and are now reduced and highly fragmented (Pires, 1999).
The remaining areas can, however, provide information about the original ecosystems of the State (Rodrigues & Shepherd, 1992), and should be preserved as genetic banks and opportunities for reforestation (Araújo & Teixeira, in press).
Reduction and isolation of fragmented areas (Andrén, 1994) result in decreases of species and bird populations (Laurance et al., 2000; Stouffer & Bierregaard, 1995). Many authors have emphasized the importance of studies of bird communities as indicators of ecosystem quality (Ramos, 1997; Moraes, 1997; Simon & Ribon, 1997), as birds constitute one of the most suitable animal groups for this purpose use as indicators environmental quality (Machado, 1995).
The present study characterizes (quali-quantitatively) the structure of bird communities as to richness, abundance, and frequency of occurrence of the species in two fragments of semideciduous forest in rural São Paulo State.
MATERIAL AND METHODS Study area
Two remaining areas of the semideciduous forest (SSF) of São Paulo State were chosen for the present study: “Estação Ecológica de São Carlos” (EESCar) and “Reserva Ambiental da Fazenda Santa Cecília” (FSC) (Fig. 1).
EESCar is a conservation unit situated in the middle east of São Paulo State, in Brotas, between geographical coordinates 22º05’ and 22º7’S and 48º00’ and 48º05’W. An isolated fragment of 75.26 ha, it borders Santana Reservoir to the north; the other sides are bordered by sugarcane monoculture.
F F F F
This area was chosen because it is a preservation area close to UFSCar (30 km), where this study was developed.
The FSC is situated in Patrocínio Paulista, in northeastern of São Paulo State, between coordinates 20º46’2’’S and 47º14’24’’W. A remnant, it consists of 100 ha privately owned and preserved. The forest is bordered by 300 ha of cerradão, in addition to pastures and humid areas. This area was chosen because it is a major preserved area of northeastern São Paulo State.
Methodology
Quali-quantitative surveys were based on the sampling method by points (Vielliard & Silva, 1990). In the period from September 2000 to August 2001, each studied area was visited 24 times, an average of 6 hours per visit, totaling 150 observation hours for each area (Table 1).
Quantitative survey
To carry out this survey, two tracks 600 m long each in each were used fragment. Five points were chosen along the tracks, 150 m distant from each other. The order of the sampling was established by raffle and the observation time in each point was 15 minutes, according to methodology adapted from Vielliard & Silva (1990). The species and respective number
of individuals of each were identified auditorily and visually and noted. When doubts existed about the number of individuals, only one of each species was recorded to prevent overestimates. A mini tape recorder was used to record unknown vocalizations, for later identification. This survey was restricted to the points chosen along the tracks; it began at about 6.00 a.m.
Qualitative survey
The survey was carried out employing the same tracks used in the previous survey. The surrounding forest environment, including humid areas, pastures, cerrado and plantation areas were considered. All species observed, their locations, contact type (visual and/or auditory), and number of individuals were noted. All species observed in the quantitative survey were included in this survey.
RESULTS AND DISCUSSIONS Qualitative survey
A total of 145 species were recorded in or near EESCar and 173 in FSC. The number of species recorded is significant when compared to that of other surveys using the same methodology and sampling time equal to or higher than ours (Table 2).
2000 (days) 2001 (days)
Months
EESCar FSC EESCar FSC
January – – 8, 9 5, 6
February – – 7, 8 11, 13
March – – 3, 5 14, 23
April – – 9, 12 6, 7
May – – 21, 22 28, 30
June – – 1, 2 18, 19
July – – 10, 11 17, 18
August – – 22, 23 27, 30
September 22, 23 27, 28 – –
October 18, 19 30, 31 – –
November 21, 22 18, 19 – –
December 12, 13 8, 9 – –
TABLE TABLE TABLE TABLE TABLE 11111
Place Area (ha) Number of species Sampling time (months)
Santa Genebra, SP* 251 134 23
Santa Elisa, SP* 40 130 12
Morro Chato, SP* 30 151 12
EESCar, SP 75 145 12
FSC, SP 100 173 12
*Source: Almeida (1997).
TABLE 2 TABLE 2 TABLE 2 TABLE 2 TABLE 2 T
T T T
Taaaaabbbbble comparle comparle comparle comparing the nle comparing the number of biring the ning the ning the number of birumber of birumber of birumber of bird species and ard species and ard species and ard species and ard species and area sizea sizea sizea sizea sizeeeee...
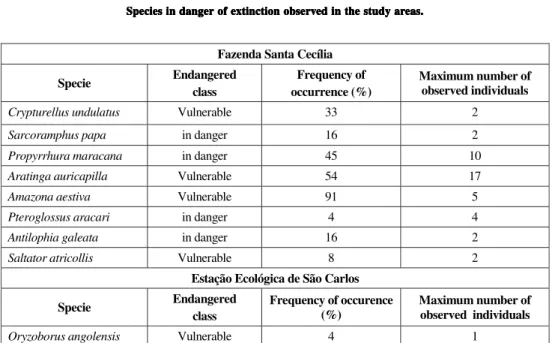
In both areas of São Paulo State were identified endangered species (SMA, 1998). In FSC the following species were identified: Crypturellus undulatus, Sarcoramphus papa, Propyrrhura maracana,Aratinga auricapilla,Amazona aestiva, Pteroglossus aracari,Antilophia galeata and Saltator atricollis.In EESCar Oryzoborus angolensis was identified. The frequency of occurrence of these species as well as the maximum number of individuals recorded are in Table 3.
The occurrence of a large number of endangered species in FSC may indicate that this fragment presents better environmental quality than does EESCar and is an important area for feeding, reproduction, and resting of these species.
Frequency of occurrence
The frequency of occurrence (FO) relates the proportion of the days on which the species were found with the total number of survey days, allowing us to conclude if a given species can be regularly found or not (Vielliard & Silva, 1990).
Species occurrence frequency was classified as shown in Table 4.
The FO above 75% includes resident species representing 4.8% of the species in EESCar and 20.35% in FSC.
A great part of the bird community (56.55% of EESCar and 41.86% of FSC) is composed of species with an FO inferior to 25%, appearing in less than six out of 24 visits. The lower FO or single occurrence of some species can be explained by their brief stay (rovers), such species may inhabit other environments and only occasionally exploit forest resources (occasional) or be they may migratory species.
The species recorded and their respective FO are in Table 5.
Quantitative Survey
Number of species
A total of 60 species was recorded for EESCar and 72 for FSC, with a total of 115 samples collected in each area.
Frequency of occurrence (%) EESCar (%) FSC (%)
< 25 56,55 41,86
25-49 23.45 22,09
50-74 15,17 15,70
75-99 4,83 18,60
100 0,00 1,75
TABLE 3 TABLE 3 TABLE 3 TABLE 3 TABLE 3 P
PP
Number of contacts
In the115 sample total from each area, 630 contacts were recorded for EESCar with an average 5.4 contacts per sample, and 774 contacts in FSC for an average 6.7 contacts per sample.
Abundance index values (IPA) per species The IPA per sampled species relates the average number of contacts of these species with the total number of samples. The IPA is a relative number but, like FO, it is comparable between measures of the same species for different dates, places, and communities (Aleixo & Vielliard, 1995). At EESCar the specific IPA varied from 0.008 (1 contact) to 0.408 (47 contacts); at FSC the IPA varied from 0.008 to 0.660 (76 contacts) (Table 5).
Both in EESCar and FSC few species had a high IPA and a great number of species showed intermediate and low numbers, compared to the pattern observed in other surveys (Vielliard & Silva, 1990; Aleixo & Vielliard, 1995; Almeida, 1997). Among species with a high IPA, some are conspicuous, like Herpsilochmus atricapillus, Basileuterus culicivorus, andVireo olivaceus for far-reaching chant or constant voca-lizations.
Some species presented a high IPA in one area and a low one in the other. This was the case with Leptotila verreauxi, Cyclarhis gujanensis, and Pitylus fuliginosus, which showed a high IPA in EESCar and a low one in FSC. On the other hand, Chiroxiphia caudata andSynallaxis ruficapilla presented a high IPA in FSC and a low one in EESCar. This could be because those species have larger populations in the areas where they presented a higher IPA, making their identification easier.
Other species were found in just one area, but with an intermediate/high IPA number. This was true ofAmazona aestiva in FSC and Baryphthengus ruficapillusin EESCar. A possible explanation is that due to their non-homogenous distribution in the original environment, their territories were not included during the fragmentation process (Bierregaard et al., 1992). This absence of given species in certain areas can also occur as a result of non-adaptation to a simplified environment or intensification of interspecific competition for limited or fragmented resources in their occurrence areas. Local extinction could also explain species lack in the studied areas, but real clarification depends on long-term studies on the ecology of these species. Fazenda Santa Cecília
Specie Endangered
class
Frequency of occurrence (%)
Maximum number of observed individuals
Crypturellus undulatus Vulnerable 33 2
Sarcoramphus papa in danger 16 2
Propyrrhura maracana in danger 45 10
Aratinga auricapilla Vulnerable 54 17
Amazona aestiva Vulnerable 91 5
Pteroglossus aracari in danger 4 4
Antilophia galeata in danger 16 2
Saltator atricollis Vulnerable 8 2
Estação Ecológica de São Carlos
Specie Endangered
class
Frequency of occurence (%)
Maximum number of observed individuals
Oryzoborus angolensis Vulnerable 4 1 Class of endanger according to SMA (1998).
TABLE 4 TABLE 4 TABLE 4 TABLE 4 TABLE 4 Species in dang
Species in dang Species in dang Species in dang
FO (%) IPA Species Habitat
EESCar FSC EESCar FSC Tinamidae
Crypturellus undulatus F – 33 – 0.078
Crypturellus tataupa F 29 4 0.017 0.008
Nothura maculosa A 12 4 – –
Phalacrocoracidae
Phalacrocorax brasilianus C 20 – – –
Anhingidae
Anhinga anhinga C 8 – – –
Ardeidae
Casmerodius albus C 29 – – –
Bubulcus ibis A – 50 – –
Butorides striatus C 16 8 – –
Syrigma sibilatrix A 54 16 – –
Nycticorax nycticorax C 4 – – –
Tigrisoma lineatum C 4 – – –
Threskiornithidae
Theristicus caudatus A – 83 – 0.052
Mesembrinibis cayennensis C 20 12 – 0.034
Cathartidae
Sarcoramphus papa B – 16 – –
Coragyps atratus B 25 83 – –
Cathartes aura B – 4 – –
Anatidae
Dendrocygna viduata C – 12 – –
Amazonetta brasiliensis C 20 29 – –
Accipitridae
Elanus leucurus A – 4 – –
Leptodon cayanensis F – 4 – –
Ictinia plumbea B – 8 – –
Buteo albicaudatus A – 20 – –
Rupornis magnirostris B 45 62 – –
Buteogallus meridionalis A 4 – – –
Falconidae
Herpetotheres cachinnans B – 25 – 0.026
Milvago chimachima A 8 16 – –
Polyborus plancus A 12 54 – –
Falco femoralis A 4 8 – –
Falco sparverius A – 25 – –
TABLE 5 TABLE 5 TABLE 5 TABLE 5 TABLE 5 Systema
SystemaSystema Systema
Systematic list (accortic list (accortic list (accortic list (accortic list (according to Sicding to Sicding to Sicding to Sick,ding to Sick, 1997) of the ork,k,k, 1997) of the or 1997) of the or 1997) of the or 1997) of the ornitholonitholonitholonitholognithologgical fggical fical fical fical fauna of the fauna of the fauna of the fauna of the forauna of the forororests in Estação Ecológorests in Estação Ecológests in Estação Ecológests in Estação Ecológica de São Carests in Estação Ecológica de São Carica de São Carica de São Carica de São Carlosloslosloslos (EESCar) and F
(EESCar) and F(EESCar) and F
(EESCar) and F(EESCar) and Fazazazazazenda Santa Cecília (FSC),enda Santa Cecília (FSC),enda Santa Cecília (FSC), with frenda Santa Cecília (FSC),enda Santa Cecília (FSC), with fr with fr with frequenc with frequencequencequencequency of occury of occurency of occury of occury of occurencencencency (FO = 4% – species obsery (FO = 4% – species obsery (FO = 4% – species observy (FO = 4% – species obsery (FO = 4% – species observvved on just oneved on just oneed on just oneed on just oneed on just one inspection) and a
inspection) and a inspection) and a inspection) and a
inspection) and abbundance indebbbundance indeundance indeundance indeundance index vx vx vx vx values (IPalues (IPA – one contact = 0.008). Haalues (IPalues (IPalues (IPA – one contact = 0.008). HaA – one contact = 0.008). HaA – one contact = 0.008). HaA – one contact = 0.008). Habitabitabitabitabitat:t:t: F = ft:t: F = f F = f F = f F = forororororest,est,est,est,est, A = open arA = open areas,A = open arA = open arA = open areas,eas,eas,eas, B = bor B = bor B = bor B = bor B = borderderderderder,,,,, C = cr
C = cr C = cr C = cr
FO (%) IPA Species Habitat
EESCar FSC EESCar FSC Rallidae
Aramides cajanea C 4 – – –
Porzana albicollis C – 4 – –
Gallinula chloropus C 4 – – –
Cariamidae
Cariama cristata A 37 95 – –
Jacanidae
Jacana jacana C 62 – – –
Charadriidae
Vanellus chilensis A 79 100 – –
Scolopacidae
Gallinago paraguaiae C – 37 – –
Columbidae
Columba picazuro B 50 95 0.052 0.034
Columba cayennensis B 4 8 0.026 0.043
Zenaida auriculata A 25 25 – –
Columbina talpacoti B 83 100 – 0.017
Claravis pretiosa B – 4 – –
Scardafella squammata A – 91 – –
Leptotila verreauxi B 83 45 0.356 0.052
Leptotila rufaxilla F 4 16 0.026 –
Psittacidae
Propyrrhura maracana F – 45 – 0.260
Aratinga leucophthalmus B 12 62 – 0.017
Aratinga auricapilla B – 54 – 0.017
Aratinga aurea A 4 66 – –
Forpus xanthopterygius B 16 45 – –
Brotogeris chiriri B 87 79 0.130 –
Pionus maximiliani F 45 79 0.034 0.043
Amazona aestiva B – 91 – 0.278
Cuculidae
Coccyzus melacoryphus B 8 – – –
Piaya cayana B 25 4 0.026 –
Crotophaga ani A 58 87 – –
Guira guira A 4 62 – –
Tapera naevia B 8 – 0.017 –
Tytonidae
Tyto alba B 8 – – –
TABLE 5 TABLE 5 TABLE 5 TABLE 5
FO (%) IPA Species Habitat
EESCar FSC EESCar FSC
Strigidae
Speotyto cunicularia A 4 62 – –
Caprimulgidae
Nyctidromus albicollis B 16 4 – 0.008
Apodidae
Streptoprocne zonaris B 4 4 – –
Trochilidae
Phaethornis pretrei B 16 25 0.008 –
Eupetomena macroura B 29 37 – –
Melanotrochilus fuscus B – 16 – –
Colibri serrirostris A 12 29 – –
Chlorostibon aureoventris B 8 45 – –
Thalurania glaucopis F 4 – – –
Amazilia fimbriata B 54 58 0.069 0.069
Amazilia lactea B 4 12 0.008 –
Trogonidae
Trogon surrucura F 37 16 0.139 0.026
Alcedinidae
Ceryle torquata C 33 – – –
Chloroceryle amazona C 12 12 – –
Momotidae
Baryphthengus ruficapillus F 58 – 0.147 –
Galbulidae
Galbula ruficauda B 8 8 0.017 –
Bucconidae
Nystalus chacuru A – 4 – –
Malacoptila striata F – 4 – –
Ramphastidae
Pteroglossus aracari F – 4 – –
Ramphastos toco B 25 75 0.017 0.078
Picidae
Picumnus cirratus B 45 4 0.017 0.017
Colaptes campestris A 33 70 – –
Colaptes melanochloros A 8 – 0.008 –
Dryocopus lineatus B 37 8 0.060 0.008
Melanerpes candidus A 4 20 – –
Veniliornis spilogaster B – 12 – 0.008
Veniliornis passerinus B 12 – – – TABLE 5
TABLE 5TABLE 5 TABLE 5
FO (%) IPA Species Habitat
EESCar FSC EESCar FSC Thamnophilidae
Hypoedaleus guttatus F – 4 – –
Taraba major B 58 12 0.095 0.008
Thamnophilus doliatus B 83 58 0.086 0.060
Thamnophilus pelzelni A 29 25 0.078 0.095
Thamnophilus caerulescens F 33 8 0.095 0.034
Dysithamnus mentalis F 41 41 0.200 0.191
Herpsilochmus atricapillus F 58 87 0.373 0.660
Formicivora rufa A 16 – – –
Conopophagidae
Conopophaga lineata F 62 62 0.121 0.147
Furnaridae
Furnarius rufus A 8 87 – –
Synallaxis spixi B – 41 – –
Synallaxis ruficapilla F 8 75 0.034 0.182
Synallaxis frontalis B 54 41 0.043 0.017
Synallaxis albescens A 16 8 – –
Certhiaxis cinnamomea C 8 45 – 0.008
Anumbius annumbi A – 20 – –
Automolus leucophthalmus F 62 58 0.173 0.234
Dendrocolaptidae
Sittasomus griseicapillus F 8 12 0.008 0.026
Xiphocolaptes albicollis F 4 4 0.008 –
Lepidocolaptes angustirostris A 8 37 – –
Lepidocolaptes fuscus F – 4 – 0.008
Tyrannidae
Camptostoma obsoletum B 4 12 – 0.017
Elaenia flavogaster B 20 25 0.008 –
Elaenia spectabilis B 29 33 0.008 0.017
Elaenia parvirostris B 4 – – –
Serpophaga nigricans C – 8 – –
Leptopogon amaurocephalus F 4 – – –
Corythopis delalandi F 37 95 0.104 0.539
Hemitriccus margaritaceiventer B 4 4 – –
Hemitriccus diops F 4 – – –
Todirostrum cinereum B 29 25 – –
Tolmomyias sulphurescens F – 8 – 0.026
Platyrinchus mystaceus F 29 29 0.060 0.043 TABLE 5
TABLE 5TABLE 5 TABLE 5
FO (%) IPA Species Habitat
EESCar FSC EESCar FSC
Tyrannidae
Myiophobus fasciatus B 12 4 – –
Contopus cinereus B – 4 – 0.008
Lathrotriccus euleri F 25 50 0.060 0.095
Cnemotriccus fuscatus B 37 33 0.069 0.086
Xolmis cinerea A – 25 – –
Xolmis velata A – 58 – –
Knipolegus lophotes A 4 50 – –
Fluvicola nengeta C – 83 – –
Arundinicola leucocephala C – 45 – –
Colonia colonus B 29 29 0.017 0.034
Gubernetes yetapa C 8 70 – –
Satrapa icterophrys B 4 20 – –
Hirundinea ferruginea A – 87 – –
Machetornis rixosus A – 75 – –
Myiarchus ferox B 33 25 0.052 0.034
Myiarchus tyrannulus B 50 45 0.095 0.017
Pitangus sulphuratus B 58 83 0.043 0.026
Myiozetetes similis B 16 54 0.017 0.008
Myiodynastes maculatus B 20 29 0.008 0.026
Tyrannus savana A 8 54 – –
Tyrannus melancholicus B 58 75 – –
Pipridae
Antilophia galeata F – 16 – 0.034
Chiroxiphia caudata F 29 83 0.078 0.600
Hirundinidae
Phaeprogne tapera B – 25 – –
Progne chalybea B – 41 – –
Notiochelidon cyanoleuca B 29 91 – –
Stelgidopteryx ruficollis B 4 70 – –
Corvidae
Cyanocorax cristatellus B 12 16 0.017 –
Troglodytidae
Donacobius atricapillus C 12 20 – 0.008
Thryothorus leucotis B 16 – – –
Troglodytes aedon B 12 95 – – TABLE 5
TABLE 5TABLE 5 TABLE 5
FO (%) IPA Species Habitat
EESCar FSC EESCar FSC
Muscicapidae
Turdus rufiventris B 4 20 – –
Turdus leucomelas B 66 95 0.104 0.147
Turdus amaurochalinus B – 20 – –
Mimidae
Mimus saturninus A 45 83 – –
Motacilidae
Anthus lutescens A – 70 – –
Vireonidae
Cyclarhis gujanensis B 66 50 0.408 0.086
Vireo olivaceus F 45 45 0.373 0.339
Hylophilus amaurocephalus B – 4 – –
Emberizidae
Geothlypis aequinoctialis C 16 8 – 0.017
Basileuterus flaveolus B 58 54 0.086 0.208
Basileuterus culicivorus hypoleucos F 66 58 0.339 0.469
Coereba flaveola B 8 54 – 0.043
Schistochlamys ruficapillus A – 4 – –
Hemithraupis ruficapilla F 8 25 0.017 0.017
Hemithraupis guira F 4 – – –
Nemosia pileata B 16 4 0.008 –
Eucometis penicillata F 4 8 – 0.008
Tachyphonus coronatus B 16 20 – –
Tricothraupis melanops F 29 37 0.052 0.130
Habia rubica F 70 50 0.391 0.286
Ramphocelus carbo B 37 33 0.034 –
Thraupis sayaca B 41 66 – –
Thraupis palmarum B 4 – – –
Euphonia chlorotica B 33 75 0.043 0.026
Tangara cayana B 8 41 – 0.026
Tersina viridis B – 12 – –
Dacnis cayana B 4 33 – 0.017
Conirostrum speciosum B 20 4 0.052 0.017
Zonotrichia capensis B 66 83 0.008 0.008
Ammodramus humeralis A 29 20 – –
Sicalis flaveola A – 79 – –
TABLE 5 TABLE 5TABLE 5 TABLE 5
FO (%) IPA Species Habitat
EESCar FSC EESCar FSC
Emberizidae
Volatinia jacarina B 70 87 – –
Sporophila lineola B – 37 – –
Sporophila caerulescens B 58 79 –
Sporophila leucoptera C – 4 – –
Oryzoborus angolensis B 4 – – –
Arremon flavirostris B 8 4 – 0.008
Coryphospingus cucullatus A 79 33 – 0.008
Pitylus fuliginosus F 50 16 0.156 0.026
Saltator similis B 29 83 0.252 0.330
Saltator atricollis A – 8 – –
Cacicus haemorrhous B – 8 – 0.017
Icterus cayanensis B – 12 – –
Agelaius ruficapillus A 4 25 – –
Leistes superciliaris A – 4 – –
Pseudoleistes guirahuro A 8 58 – –
Gnorimopsar chopi A 4 75 – –
Molothrus bonariensis A 16 100 – –
Passeridae
Passer domesticus A – 87 – – TABLE 5
TABLE 5 TABLE 5 TABLE 5
TABLE 5 ( ( ( ( (ContinueContinueContinueContinueContinueddddd)))))
It should be remembered that FSC is an area whose owners are always on the alert for harmful activity in this area, while EESCar lacks protection completely.
Even so, both areas are important for the conservation of bird communities and other animal groups. The current study can serve as a subsidy for management planning in these areas.
Fazenda Santa Cecília, which is environmen-tally protected, could be modified in order to become a conservation unit, governmental or private (“Re-serva Particular do Patrimônio Natural”) where as EESCar requires better management to qualify as a conservation unit.
Studies like this provide preliminary knowledge of fauna communities and a partial diagnosis of the environment quality of fragments studied. Further research can identify species and the fragments where they are found.
Acknowledgments — The authors thank the Master’s Degree Program in Ecology and Natural Resources of UFSCar for the opportunity to develop the present work, CAPES for a scholarship, and the proprietors of Fazenda Santa Cecília and the Instituto Florestal-SP for permission to carry out this research in these areas.
REFERENCES
ALEIXO, A. & VIELLIARD, J., 1995, Composição e dinâmica da avifauna da mata de Santa Genebra, Campinas, São Paulo, Brasil.Rev. Brasil. Zool.,12(3): 493-511.
ALMEIDA, M. E. C., 1997, Estrutura de comunidades de aves em dois remanescentes florestais na bacia do Rio Jacaré-Pepira, SP. Tese de Mestrado, Universidade Federal de São Carlos, São Carlos, 83p.
ANDRÉN, H., 1994, Effects of habitat on birds and mammals in landscapes with differente proportions of suitable habitat: a review. Oikos,71: 355-366.
LAURANCE, W. F., VASCONCELOS, H. L. & LOVEJOY, T. E., 2000, Forest loss and fragmentation in the Amazon: implications for wildilife. Oryx,34(1): 39-45
MACHADO, R. B., 1995, Padrão de fragmentação da Mata Atlântica em três municípios da bacia do Rio Doce (Minas Gerais) e suas conseqüências para a avifauna. Tese de Mestrado. Universidade Federal de Minas Gerais, Belo Horizonte, 72p.
MORAES, V. S., 1997, Mapeamento de áreas prioritárias para a conservação de aves costeiras e oceânicas no litoral do Paraná.Resumos, Congresso Brasileiro de Ornitologia, Belo Horizonte, p. 60.
PIRES, J. S. R., 1999, Considerações sobre a estratégia inter situ. Anais, Congresso Brasileiro de Conservação e Manejo da Biodiversidade, Ribeirão Preto, pp. 109-116.
RAMOS, C. C. N. G. A., 1997, Seleção de indicadores bioló-gicos no Estado de São Paulo. Resumos, Congresso Bra-sileiro de Ornitologia, Belo Horizonte, p. 163.
RODRIGUES, R. R. & SHEPHERD, G. J., 1992, Análise da variação estrutural e fisionômica da vegetação e caracte-rísticas edáficas, num ambiente altitudinal na Serra do Japi.
In: L. P. C. Morelatto (org.), História natural da Serra do Japi: ecologia e preservação de uma área florestal no Sudeste do Brasil. UNICAMP, Campinas.
SCHLITTLER, F. H. M., 1999, Os fragmentos florestais do interior do Estado de São Paulo. Anais,I Congresso Brasileiro de Conservação e Manejo da Biodiversidade, Ribeirão Preto, pp. 189-193.
SICK, H., 1997, Ornitologia Brasileira. Nova Fronteira, Rio de Janeiro.
SIMON, J. E. & RIBON, R., 1997, Extinção de aves na região de Viçosa, Zona da Mata de Minas Gerais. Resumos, VI Congresso Brasileiro de Ornitologia, Belo Horizonte, p. 67.
SMA – Secretaria do Meio Ambiente do Estado de São Paulo, 1998,Fauna ameaçada no Estado de São Paulo. SMA/ CED, São Paulo.
STOUFFER, P. C. & BIERREGAARD, J. R., 1995 Effects of forest fragmentation on understory hummingbirds in Amazonian Brazil. Conservation Biology,9(5): 1085-1091.
VELOSO, R. P. et al., 1992, Classificação da vegetação brasileira, adaptada a um sistema universal. IBGE, Rio de Janeiro.