iNtrODUctiON
An often dramatic example of human interference in the environment is mining, which frequently results in decreased habitat complexity and changes
in community composition (Wray et al. 1982). hese
changes may negatively afect the fauna, leading to decreasing populations (Scott & Zimmerman 1984). In an attempt to revert those negative efects, worldwide mining companies are often obliged by law to restore the vegetation in previously mined areas.
One of the techniques used to restore previously mined areas begins with the lattening of the local topography, followed by the deposition of soil with a seed bank and the planting of pioneer exotic and/or native plants (Tischew & Kimer 2007). he planting of tree species to recover degraded mining areas has been made in Brazil since the 1970s, mainly by planting exotic species such as eucalyptus (Eucalyptus spp.), and native species
such as bracatinga (Mimosa scabrella) (Willians 1984).
his restoration strategy results in an apparently well-developed vegetation in less than a decade. Nevertheless, the real efectiveness of this type of management in
he structure of bird communities in areas revegetated
after mining in southern Brazil
rafael Gustavo Becker1, 5, Gabriela Paise2 and Marco aurélio Pizo3, 4
1 PPG Diversidade e Manejo da Vida Silvestre. Universidade do Vale do Rio dos Sinos, UNISINOS. C.P. 275. São Leopoldo, RS, 93022-000, Brazil. 2 UFRGS - Universidade Federal do Rio Grande do Sul –Departamento de Ecologia Instituto de Biociências, Av. Bento Gonçalves, 9500, Cx. Postal
15007, CEP 91501-970 Porto Alegre, RS, Brazil.
3 UNESP – Univ. Estadual Paulista, Departamento de Zoologia, 13506-900 Rio Claro, SP, Brazil. 4 Corresponding author: Phone: 55-19-3526 4294, E-mail: [email protected]
5 Present address: BIOTA Soluções Ambientais. Lindolfo Collor, 439, sala 301, São Leopoldo, RS, 93010-080, Brazil.
Received on 22 January 2013. Accepted on 5 September 2013.
aBStract:Mined areas undergo physical changes and profound alterations in the structure and composition of the vegetation. Hence, the fauna cannot return to these areas without human intervention, usually through revegetation. In the state of Paraná, southern Brazil, we assessed the structure of bird communities (species richness, composition, trophic guilds, and forest dependence) in areas of diferent ages (5, 10, and 20 years) that were revegetated after mining with a single species of native tree (Mimosa scabrella). hese areas were compared with a forest area with no mining inluence (control). he areas difered in species richness and species composition. Birds of some foraging guilds (e.g., frugivores) were absent from 10- and 5-year-old areas. he occurrence of forest-dependent birds increased, whereas forest-inforest-dependent birds decreased with increasing area age. he death of Mimosa scabrella trees between 10 and 20 years after planting reduced vegetation complexity and afected the bird fauna. To avoid such an efect, and to assure the presence of frugivorous birds that are important to restore the vegetation through seed dispersal, we recommend the use of a high diversity of plant species in the initial planting, including plants with leshy fruits that attract frugivorous birds.
KeY-WOrDS: Araucaria Forest, foraging guilds, forest dependence, forest restoration, mining areas, restored areas.
promoting the return of the fauna to restored mining areas is still unknown (Barth 1989).
he return of birds to regenerating forests is important to the local or regional maintenance of bird
populations and the ecological roles played by birds (e.g.,
predation, pollination, seed dispersal, and pest control) (Sekercioglu 2006). Seed-dispersing birds, for example, contribute directly to the regeneration of degraded areas (Walker & Del Moral 2003).
In Brazil, there are no studies that evaluated the efectiveness of post-mining management for the recovery
of bird communities (but see Parrotta et al. 1997).
Whitman et al. 1998), the complexity and heterogeneity of the vegetation were assessed in the studied areas and related to the occurrence of birds.
Material aND MetHODS Study areas
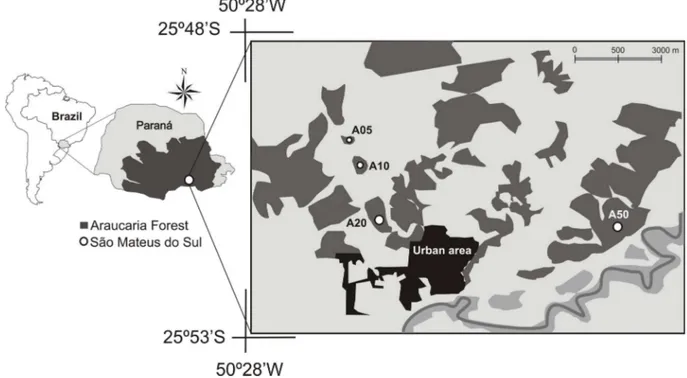
We carried out the present study in São Mateus do Sul, state of Paraná, Brazil (25°52’S; 50°23’W; Figure 1). his municipality is located on the Paraná Plateau at 800 m a.s.l. he regional climate is type Cfb of Köppen (1948), subtropical humid with no dry season. he average annual rainfall varies between 1,400 and 1,500 mm. he average temperature of the warmest month is below 22°C and the average temperature of the coldest month is above 10°C, with more than ive frosts per year. he vegetation of the region is the Araucaria forest,
characterized by the dominance of Araucaria angustifolia
(Bertol.) Kuntze (Araucariaceae) (Veloso et al. 1991).
We selected four study areas forming a regeneration gradient from areas at initial successional stages to areas at advanced successional stages (Table 1). hree areas, coded based on their succession stage as A05 (recovering for ive years), A10 (recovering for ten years), and A20 (recovering for 20 years) were located at the Unidade de Superintendência de Industrialização de Xisto of Petrobrás. hese are mining areas under restoration. he restoration began with the topographic lattening and covering of the exposed soil with humus, and then
the planting of bracatinga (Mimosa scabrella Benth,
Leguminosae), an evergreen tree native from southeastern and southern Brazil that varies from 4 to 18 m in height and 20 to 30 cm in diameter at breast height. It may reach up to 30 m in height and 50 cm or more in diameter at breast height when adult. It is a fast-growing pioneer species regardless of the physical conditions of the soil, being frequently used in the restoration of degraded areas (Mattos & Mattos 1980, Lorenzi 2002).
he youngest managed area (A05) was composed
exclusively of bracatingas and was at an initial
successional stage (Table 1). he area A10 had only bracatinga as a tree species, and had an herbaceous understory composed of pioneer species and a high undergrowth cover. In A20 there was an input of diferent tree species at initial and intermediate life
stages, i.e., seedlings, young, and subadult individuals
(Table 1). he fourth study area was a forest fragment located at the south of the managed areas that has never
been mined, but underwent selective logging of
erva-mate (Ilex paraguariensis St. Hil., Aquifoliaceae) in the 1960s. his area, coded as A50 (approximately 50 years of succession), corresponded to a control area in the present study (Figure 1, Table 1). he control area had a dense and continuous canopy. he emergent stratum
was composed of araucárias (Araucaria angustifolia) with
a developing understory, i.e., composed of young and
subadult trees, a herbaceous stratum of intermediate height (ca. 30 cm) compared to other areas, and a sparse undergrowth. With the exception of the urban area at the south of the restored areas, the matrix surrounding all the study areas was similar, composed of a mosaic of agricultural ields and small forest fragments (Figure 1).
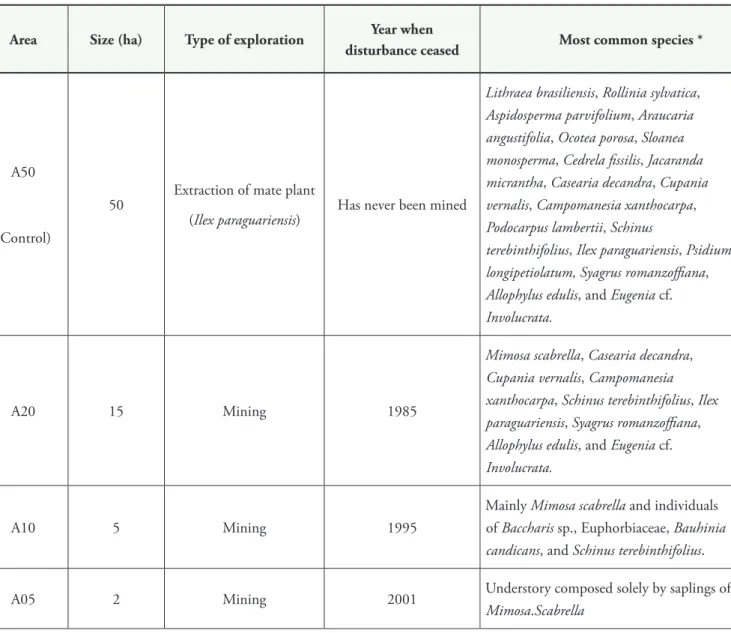
taBle 1. Summary of the main characteristics and vegetation of the study areas in São Mateus do Sul, state of Paraná, southern Brazil. he abbreviations correspond to the years after the beginning of regeneration (e.g., A20 is under regeneration for twenty years).
area Size (ha) type of exploration Year when
disturbance ceased Most common species *
A50
(Control)
50 Extraction of mate plant
(Ilex paraguariensis) Has never been mined
Lithraea brasiliensis, Rollinia sylvatica, Aspidosperma parvifolium, Araucaria angustifolia, Ocotea porosa, Sloanea monosperma, Cedrela issilis, Jacaranda micrantha, Casearia decandra, Cupania vernalis, Campomanesia xanthocarpa, Podocarpus lambertii, Schinus
terebinthifolius, Ilex paraguariensis, Psidium
longipetiolatum, Syagrus romanzoiana,
Allophylus edulis, and Eugenia cf. Involucrata.
A20 15 Mining 1985
Mimosa scabrella, Casearia decandra,
Cupania vernalis, Campomanesia
xanthocarpa, Schinus terebinthifolius, Ilex paraguariensis, Syagrus romanzoiana, Allophylus edulis, and Eugenia cf. Involucrata.
A10 5 Mining 1995
Mainly Mimosa scabrella and individuals
of Baccharis sp., Euphorbiaceae, Bauhinia candicans, and Schinus terebinthifolius.
A05 2 Mining 2001 Understory composed solely by saplings of
Mimosa.Scabrella
* Barbieri & Heiden (2009). Plant nomenclature follows APG II - Angiosperm Phylogeny Group II (2003).
Vegetation structure
We established three plots of 10 x 30 m in each sampling area inside which we measured six structural parameters to characterize the vegetation: (i) the stem girth at breast height of all tree species with circumference ≥ 15 cm; (ii) the height of these trees measured with a 1-m graduated ruler; (iii) the undergrowth cover estimated with
a 1-m2 grid divided into 100 squares of 10 x 10 cm placed
in 15 random sites within each plot; (iv) the understory height (plants > 1 m) with girth at breast height ≤ 15 cm; and (v) the absolute maximum height of the herbaceous vegetation (height < 1 m) at 15 random points in the plot. In addition, we also measured (vi) the percentage of canopy cover measured with a spherical densiometer in ive points at each plot, four of which were located at the vertex and one in the center of the plot. At each of
these points, we took four measurements of canopy cover to obtain an average value that characterized each point (Lemmon 1956).
Bird sampling
We sampled birds from January to December 2006 using the point count method with unlimited distance
(Bibby et al.1992), always taking care to avoid double
(Bibby et al. 1992, Lynch 1995). he nomenclature followed Comitê Brasileiro de Registros Ornitológicos (CRBO 2011).
Data analysis
We tested for diferences between average values of each vegetation structure parameter with a one-way analysis of variance (ANOVA). When such diferences were signiicant, we used a Tukey post-hoc test (Zar 1996). In addition, to interpret these variables we used a principal component analysis (PCA). hrough the interpretation of the PCA axis 1 (PC1), we obtained indexes of structural complexity and heterogeneity of the vegetation for each area (August 1983). We calculated the structural complexity of the areas as the average of the scores of axis 1, which concentrates all the variation of the original variables of each sample and outlines a space deined by the highest variation observed in the raw data (August 1983). Hence, structurally more complex areas were pointed out by high averages of these scores. We calculated the structural heterogeneity of the areas as the standard deviation of the scores of axis 1. Hence, heterogeneous areas were those with high variance in these scores. For these analyses, we transformed proportions to the arcsine of the square root (Zar 1996).
We analyzed sampling completeness with species accumulation curves made for each area (Krebs 1999). To compare richness between areas, we used a rarefaction analysis (Gotelli & Colwell 2001). his analysis is a non-biased way to compare areas, because it is not inluenced by variations in the density of individuals per area (Colwell & Coddington 1994, Gotelli & Colwell 2001), which is expected in areas of diferent sizes. For building
the rarefaction curve we used the program EstimateS® 7.5
(Colwell 1997).
To test for spatial autocorrelation among areas in species composition, we used a Mantel test with Bray-Curtis distances (dissimilarity) calculated based on the matrix of species records across areas and distances (m) among areas (Quinn & Keough 2002). We performed this Mantel test in the software PCord 4.20 (McCune & Meford 1999), using 1,000 permutations.
We tested for diferences in the composition of the bird fauna between areas through a clustering analysis based on the Bray-Curtis distance with the simple connection algorithm in the program MVSP (Kovach 2003). For analyzing foraging guilds, we grouped the species in six categories following Willis (1979), Sick (1997), and Sigrist (2006): CA (carnivores), FR (frugivores), NC (nectarivores), IN (insectivores), ON (omnivores), and GR (granivores). his analysis allows identifying the presence of some diet categories, so it indirectly allows assessing resource availability in the area. Forest dependence categories followed Silva (1995) with
modiications based on the experience of the authors. he following forest dependence categories were considered: dependent (species found mainly in forest habitats), semi-dependent (species that occur in the forest but are frequently found in open habitats), and independent (species that occur in open vegetation such as pastures, grasslands, and marshes).
Although we are aware of a possible spatial dependence among point counts in each area
(pseudo-replication sensu Hurlbert 1984), we assumed each point
count to be an independent sample. Hence, to minimize this efect, we used a resampling statistic calculated in
the program Resampling Stats® for Excel (Simon 1997,
Blank et al. 2001), with 10,000 randomizations, in order
to test for diferences among areas in rareied richness,
number of records of each species (i.e., abundances), and
Bray-Curtis index. When the variances were signiicantly
diferent (α ≤ 0.05), we adjusted them a posteriori to avoid
the error type I due to the multiple interactions between average values, thus following the correction proposed by Holm (1979).
reSUltS Vegetation structure
he study areas difered in several parameters of vegetation structure (Table 2). We observed an increase in tree girth and canopy cover with area age, but this gradient was not observed for other parameters, such as tree height (Table 2). Area A10 was more similar to A50 in tree height
than to A20 due to the death of bracatingas that occurred
10 to 20 years after planting. Hence, A10 was broadly
dominated by high individuals of bracatinga, whereas A20
had a low canopy with other tree species at initial and intermediate life stages. As a result, A50 had the highest complexity and heterogeneity of vegetation, followed by A10 and not by A20, as we expected (Table 2).
he youngest area (A05) had no well-developed canopy stratum; it presented an understory with average height higher than other managed areas, but formed only by bracatingas at initial life stage, with high herbaceous vegetation. his area had a homogeneous and less complex vegetation structure when compared to the other areas (Table 2).
Bird communities
taBle 2. Vegetation structure parameters in three restored mining areas (A05, A10, and A20) and one non-mined control area (A50). We present average values and standard errors based on three 10 x 30 m plots sampled in each area. he same letters indicate similar variances among areas. he indexes of vegetation complexity and heterogeneity correspond, respectively, to the average and standard deviation of the scores of the axis 1 obtained from a PCA calculated with the structural parameters listed in the table (see text for details about this analysis).
Vegetation parameters a50 a20 a10 a05
Girth at breast height (m) 0.43 ± 0.07a 0.38 ± 0.02a.b 0.30 ± 0.01 b 0.00 ± 0.00 c
Tree height (m) 10.62 ± 0.64 a 4.91 ± 0.16 b 10.00 ± 0.14 a 0.00 ± 0.00 c
Height of herbaceous vegetation (m) 0.30 ± 0.02 a 0.19 ± 0.02 b 0.29 ± 0.04 a 0.38 ± 0.02 c
Undergrowth cover (%) 24.10 ± 5.10a 88.97 ± 3.58b 88.47 ± 5.31b 59.50 ± 6.80c
Understory height (m) 3.36 ± 0.16 a 1.59 ± 0.22 b 1.39 ± 0.16 b 2.93 ± 0.17 c
Canopy cover (%) 96.10 ± 0.46a 91.24 ± 1.68b 73.16 ± 2.73c 0.00 ± 0,00d
Complexity 0.80 0.18 0.43 -1.40
Heterogeneity 0.90 0.36 0.45 0.23
FiGUre 2. Species accumulation curves of the restored mining areas (A05, A10, and A20) and the non-mined control area (A50) at diferent seasons. Sampling dates were Summer (4-19 January 2006); Autumm (15-25 April 2006); Winter (16-29 July 2006); and Spring (10-18 November 2006). followed by A10 with 66 species, A20 with 54 species,
and A05 with 39 species. he average rareied species richness difered between A50 (mean ± 95% conidence interval = 52.1 ± 3,89 species) and A20 (41.4 ± 3,02
he compositions of the avifauna were signiicantly diferent for all between-area comparisons, but the control (A50) and the youngest (A05) areas had the most dissimilar avifaunas, while A20 and A10 had 70% of similarity (Table 4). here was no spatial autocorrelation in species occurrence among areas (Mantel r = 0.298; P = 0.173),
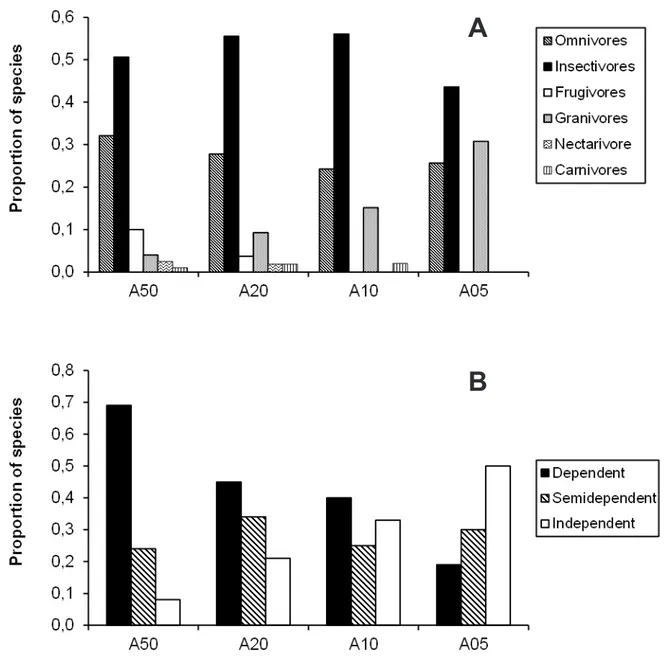
Overall, most bird species were insectivorous or omnivorous. Only the older areas (A50 and A20) had members of all six foraging guilds, while A05 had the lowest number of such guilds: only granivores,
taBle 3. Average diferences in rareied species richness and corrections of the signiicance level (following the method proposed by Holm, 1979) between pairs of study areas.
areas average diferences P-value adjusted P 0.05/(N+1-1) Signiicant
A50 x A20 10.79 0.001 0.008 Yes
A50 x A05 24.86 0.001 0.010 Yes
A20 x A05 14.06 0.001 0.013 Yes
A10 x A05 19.29 0.001 0.017 Yes
A50 x A10 5.56 0.036 0.025 No
A20 x A10 -5.23 0.066 0.050 No
omnivores, and insectivores with the noteworthy absences of frugivorous and nectarivorous species (Figure 3A). here were more granivores in the youngest areas, A10 and A05. (Figure 3A).
here was a decrease in the proportion of forest-dependent species from the control to younger areas, whereas the opposite pattern was observed for forest-independent birds (Figure 3B). Semi-dependent species were more evenly distributed among areas, varying from 27.5% to 33.3% of all species recorded in each area (Figure 3B).
taBle 4. Bray-Curtis dissimilarity indexes and corrections of the signiicance level (following the method proposed by Holm, 1979) used to compare species composition between study areas.
areas Bray-curtis dissimilarity index P value adjusted P 0.05/(N+1-1) Signiicant
A20 x A10 0.315 0.000 0.008 Yes
A50 x A10 0.684 0.000 0.010 Yes
A20 x A05 0.670 0.001 0.013 Yes
A50 x A05 0.926 0.007 0.017 Yes
A50 x A20 0.695 0.011 0.025 Yes
DiScUSSiON
We observed a signiicant change in bird species richness and composition a few years after post-mining management, a result that corroborates with other studies in restored mined areas in forest environments (Brewer 1958, Krementz & Sauer 1982, Armstrong & Nichols 2000, Passell 2000, Nichols & Nichols 2003). It should be noted, however, that in the present study we lack replicates of age categories for the areas sampled, which call for caution in the interpretation and generalization of results. Notwithstanding, we believe that some results are good indicatives of the efects of the restoration strategy adopted upon the bird community.
Based on the species-area relationship (reviewed by
Rosenzweig 1995), we expected a decreasing gradient of species richness from the older and larger to the smaller and younger area. Such gradient, however, did not exactly occurred because areas A10 and A20 did not difered from each other in species richness, likely
because the death of bracatingas 10 to 20 years after
planting reduced the complexity and heterogeneity of the vegetation at A20. Moreover, the area A10 showed similar species richness to the control area. he presence of forest-independent granivores species (such as Zonotrichia capensis, Sicalis laveola, and Lanio cucullatus)
together with forest-dependent species (such as Trogon
surrucura and Crypturellus obsoletus) likely contributed to increase the species richness in A10, making it similar to the richness observed in the control area. However,
FiGUre 3. Percentage of species in each diet (A) and forest dependence (B) categories recorded in restored mining areas (A05, A10, and A20) and in a non-mined control area (A50). he numbers of bird species recorded in A05, A10, A20, and A50 were 39, 66, 54, and 80, respectively.
A
diferently from A10, the control area harbors species that are more sensitive to human disturbance, such as
some Dendrocolaptidae and Formicariidae (Stotz et al.
1996), which were not recorded in the managed areas. herefore, although the species richness of a 10-yr old area is comparable to an area that has never been mined, it has less disturbance-sensitive species, regardless of their dependence on forested habitats.
We did not record frugivorous or nectarivorous species at A05 but only insectivorous, omnivorous, and granivores species. his functional composition probably relects the initial stage of regeneration of the vegetation at A05. Motta-Júnior (1990) reported that in degraded habitats there is a larger number of omnivorous birds, and possibly less specialized insectivorous birds. Indeed, likely as a result of the low structural complexity of A05, which
was typical of initial successional stages (D’Angelo Neto et
al. 1998), we did not record top predators (e.g., Accipitridae
and Falconidae), intermediate and large frugivores (e.g.,
families Tinamidae, Trogonidae, and Ramphastidae), soil insectivores (species of the family Formicariidae), large
bark insectivores (e.g.,Dendrocolaptidae), and several
other frugivores (e.g.,hraupidae). It is important to note
that the lowers of bracatinga, the dominant species in
A05, are pollinated by bees (Catharino et al. 1982), thus
not attracting nectarivorous birds. Likewise, it does not produce leshy fruits and, hence, does not represent a food source for frugivores. herefore, if the objective is to speed up forest succession and quickly restore a mining area, it is important to include plants with leshy fruits at the initial planting to attract frugivorous birds (Parrotta et al. 1997, Barbosa & Pizo 2006).
In conclusion, for the purpose of avifauna recovery we suggest that it is undesirable to adopt uniform
plantations of Mimosa scabrella as a restoration strategy
in mined areas because forest specialists and frugivorous birds lose suitable refuges for several decades until the planted forest regenerates and can thus disappear from the area. he initial planting of a high diversity of species is important not only to ensure the persistence of the
restored forest (Rodrigues et al. 2010) but also to speed
up the recovery of the bird fauna.
acKNOWleDGMeNtS
To Embrapa Clima Temperado for inancial and logistical support, and Capes for inancial support. To the scientists of this institution, Rosa Lia Barbieri and Clênio Pillon, who collaborated with us in diferent ways. To Eduardo Dornelles, professor at Universidade Federal de Pelotas. We are grateful to the comments by Edson Vargas Lopes and an anonymous reviewer who greatly improved the manuscript. M. A. P. receives a research scholarship from CNPq.
reFereNceS
aPG ii - he angiosperm Phylogeny Group. 2003. An update of the Angiosperm Phylogeny Group classiication for the ordens and families of lowering plants: APG II. Botanical Journal of the Linnean Society, 141: 399-436.
armstrong, K. N. & Nichols, O. G. 2000. Long-term trends in avifaunal recolonisation of rehabilitated bauxite mines in the jarrah forest of south-western Australia. Forest Ecology and Management, 126: 213-225.
august, P. V. 1983. he role of habitat complexity and heterogeneity in structuring tropical mammal communities. Ecology, 64: 1495-1507.
Barbieri, r. l. & Heiden, G. 2009.Árvores de São Mateus do Sul e região, Paraná. Pelotas: Embrapa Clima Temperado.
Barbosa, K. c. & Pizo, M. a. 2006. Seed rain and seed limitation in a planted gallery forest in Brazil. Restoration Ecology, 14: 504-515.
Barth, r. c. 1989. Avaliação da recuperação de áreas mineradas no Brasil. Boletim Técnico nº1. Viçosa: SIF/UFV.
Bibby, c. J.; Burgess, N. D. & Hill, D. a. 1992. Bird census techniques. Orlando: Academic Press.
Blank, S.; Seiter, c. & Bruce, P. 2001.Resampling Stats in Excel. Arlington: Resampling Stats Inc.
Brewer, r. 1958. Breeding-bird populations of strip-mined land in Perry County, Illinois. Ecology, 39: 543-545.
catharino, e. l. M.; crestana, c. S. M. & Kageyama, P. Y. 1982. Biologia loral da bracatinga (Mimosa scabrella Benth.).
Silvicultura em São Paulo, 16: 525-531.
colwell, r. K. 1997. EstimateS: Statistical estimation of species richness and shared species from samples, version 6.0b1. http:// viceroy.eeb.uconn.edu/estimates. (accessed on 22 October 2012).
colwell, r. K. & coddington, J. a. 1994. Estimating terrestrial biodiversity through extrapolation. Philosophical Transactions of the Royal Society(Series B), 345: 101-118.
cBrO comitê Brasileiro de registros Ornitológicos. 2011.Listas das aves do Brasil,10ª Ed., 25/01/2011. http://www.cbro.org.br (access on 19 July 2011).
D’ÂngeloNeto, S.; Venturin, N.; Oliveira-Filho, t. a. & costa, F. a. F. 1998. Avifauna de quatro isionomias lorestais de pequeno tamanho (5-8 ha) no campus da UFLA. Revista Brasileira de Biologia, 58: 463-472.
Gotelli, N. J. & colwell, r. K. 2001. Quantifying biodiversity: procedures and pitfalls in the measurement and comparison of species richness. Ecology Letters, 4: 379-391.
Holm, S. 1979. A simple sequential rejective multiple test procedure.
ScandinavianJournal of Statistics, 6: 65-70.
Hurlbert, S. H. 1984. Pseudoreplication and the design of ecologycal ield experiments. EcologicalMonographs, 54: 187-211.
Köppen, W. 1948.Climatologia: Con un estudio de los climas de la tierra. Mexico: Fondo de cultura economica.
Kovach, W. 2003. Multi-variate Statistical Package, version 3.13 for Windows. Anglesey, Wales: Kovoch Computing Services.
Krebs, c. J. 1999.Ecological methodology, 2 Ed. New York: Harper and How.
Krementz, D. G. & Sauer, J. r. 1982. Avian communities on partially reclaimed mine spoils in south central Wyoming. Journal of Wildlife Management, 46: 761-765.
lemmon P. e. 1956. A spherical densiometer for estimating forest overstory density. Forest Science, 2: 314-320.
lorenzi, H. 2002.Árvores brasileiras: manual de identiicação e cultivo de plantas arbóreas do Brasil, 4ª Ed. Nova Odessa: Instituto Plantarum.
Macarthur, r. H. & Macarthur, J. W. 1961. On bird species diversity. Ecology, 42: 594-598.
Mattos, J. r. & Mattos, N. F. 1980. A bracatinga. Porto Alegre: Instituto de Pesquisas de Recursos Naturais Renováveis.
Mccune, B. & Meford, M. J. 1999. PC-Ord: multivariate analysis of ecological data, version 4. Gleneden Beach: MJM Software Design.
Motta-Júnior, J. c. 1990. Estrutura tróica e composição de três habitats terrestres na região central do Estado de São Paulo.
Ararajuba, 1: 65-71.
Nichols, O. G. & Nichols, F. M. 2003. Long-term trends in faunal recolonization after bauxite mining in the Jarrah Forest of Southwestern Australia. Restoration Ecology, 11: 261-272.
Parrotta, J. a.; Knowlesb, O. H. & Wunderle Jr., J. M. 1997.
Development of loristic diversity in 10-year-old restoration forests on a bauxite mined site in Amazonia. Forest ecology and Management, 99: 21-42.
Passell, H. D. 2000. Recovery of bird species in minimally restored Indonesian thin strips mines. Restoration Ecology, 8: 112-118.
Quinn, G. P. & Keough, M. J. 2002.Experimental design and data analysis for biologists. Cambridge: Cambridge University Press.
rodrigues, r. r.; Gandoli, S.; Nave, a. G.; aronson, J.; Barreto, t. e.; Vidal, c. Y. & Brancalion, P. H. S. 2010. Large-scale ecological restoration of high-diversity tropical forests in SE Brazil. Forest ecology and Management, 261: 1605-1613.
rosenzweig, M. l. 1995. Species Diversity in Space and Time. Cambridge: Cambridge University Press.
Scott, M. D. & Zimmerman, G. M. 1984. Wildlife management at surface coal mines in the Northwest. Wildlife Society Bulletin, 12: 364-370.
Sekercioglu, c. H. 2006. Increasing awareness of avian ecological function. Trends in Ecology, Systematics and Evolution, 8: 464-471.
Sick, H. 1997.OrnitologiaBrasileira. Rio de Janeiro: Nova Fronteira.
Sigrist, t. 2006.Aves Brasileiras: uma visão artística. Valinhos: Editora Avis Brasilis.
Silva, J. M. C. 1995. Birds of the cerrado region, South America.
Steenstrupia, 21: 69-92.
Simon, J. l. 1997. Resampling: the new statistics, Arlington: Resampling Stats Inc.
Stotz , D. F.; Fitzpatrick, J. W.; Parker iii, t. a. & Moskovits, D. K. 1996. Neotropical birds: ecology and conservation. Chicago: University of Chicago Press.
tischew, S. & Kirmer, a. 2007. Implementation of Basic Studies in the Ecological Restoration of Surface-Mined Land.
RestorationEcology, 15: 321-325.
Veloso, H. P.; rangel-Filho, a. l. r. & lima, J. c. a. 1991. Classiicação da Vegetação Brasileira, adaptada a um sistema universal. Rio de Janeiro: IBGE, Departamento de Recursos Naturais e Estudos Ambientais.
Walker, l. r. & Del Moral, r. 2003.Primary succession and ecosystem rehabilitation. Cambridge: Cambridge University Press.
Whitman, a. a.; Hagan iii, J. M. & Brokaw, N. V. l. 1998. Efect of selective logging on birds of northern Belize. Biotropica, 30: 449-457.
Willians, D. D. 1984. Reabilitação de minas de bauxita exauridas em Poços de Caldas, MG, p.464-467. In: Simpósio Brasileiro sobre técnicas exploratórias aplicadas à geologia. Salvador: Sociedade Brasileira de Geologia.
Willis, e. O. 1979. he composition of avian communities inremanescent woodlots in southern Brazil. Papéis Avulsos de Zoologia, 33: 1-25.
Wray, t.; Strait, K. a. & Whitmore, r. c. 1982. Reproductive success of grassland sparrows on a reclaimed surface mine in West Virginia. Auk, 99: 157-164.
Zar, J. H. 1996.Biostatistical analysis. New Jersey: Prentice Hall.
aPPeNDix.
Number of records of bird species in each of the study areas in São Mateus do Sul, state of Paraná, Brazil. Abbreviations: A50 (area with no mining history, at least 50 years with no disturbances), A20 (mined area under recovery for 20 years), A10 (mined area under recovery for 10 years), and A05 (mined area under recovery for 5 years). Diet categories: C (carnivores), F (frugivores), N (nectarivores), I (insectivores), O (omnivores), and G (granivores). Forest dependence categories: D (dependent), S (semi-dependent), I (independent). See text for deinition of categories.
Families/species Diet Forest dependence areas
a50 a20 a10 a05
tinamidae
Crypturellus obsoletus (Temminck, 1815) F D 4 7 0 0
Crypturellus tataupa (Temminck, 1815) F D 3 0 0 0
Nothura maculosa (Temminck, 1815) I I 0 0 0 9
cracidae
Penelope obscura Temminck, 1815 F D 4 0 0 0
Odontophoridae
Odontophorus capueira (Spix, 1825) I D 4 0 0 0
accipitridae
Rupornis magnirostris (Gmelin, 1788) C I 0 1 1 0
Falconidae
Micrastur semitorquatus (Vieillot, 1817) C S 2 0 0 0
rallidae
Aramides saracura (Spix, 1825) I S 2 0 1 2
columbidae
Columbina talpacoti (Temminck, 1811) G I 0 0 6 0
Columbina picui (Temminck, 1813) G I 0 0 7 9
Columbina squammata (Lesson, 1831) G I 0 0 3 0
Zenaida auriculata (Des Murs, 1847) G I 0 0 1 1
Leptotila verreauxi Bonaparte, 1855 G S 18 3 8 1
Leptotila rufaxilla (Richard e Bernard, 1792) G D 6 0 5 0
Patagioenas picazuro (Temminck, 1813) G S 19 0 2 0
Psittacidae
Pyrrhura frontalis (Vieillot, 1817) F D 15 0 0 0
Triclaria malachitacea (Spix, 1824) F D 2 0 0 0
cuculidae
Coccyzus melacoryphus Vieillot, 1817 I D 0 0 1 0
Families/species Diet Forest dependence areas
a50 a20 a10 a05
Guira guira (Gmelin, 1788) I I 0 0 3 9
Tapera naevia (Linnaeus, 1766) I S 0 1 0 0
trochilidae
Chlorostilbon lucidus (Shaw, 1812) NC S 1 3 0 0
Leucochloris albicollis (Vieillot, 1818) NC D 1 0 0 0
trogonidae
Trogon surrucura Vieillot, 1817 O D 36 1 18 0
ramphastidae
Ramphastos dicolorus Linnaeus, 1766 F D 4 0 0 0
Picidae
Picumnus temminckii Lafresnaye, 1845 I D 0 1 6 0
Colaptes melanochloros (Gmelin, 1788) I S 1 1 4 0
Colaptes campestris (Vieillot, 1818) I I 0 0 0 10
Veniliornis spilogaster (Wagler, 1827) I S 9 5 21 2
Piculus aurulentus (Temminck, 1821) I D 4 2 1 0
Dryocopus lineatus (Linnaeus, 1766) I S 1 0 0 0
Campephilus robustus (Lichtenstein, 1818) I D 4 0 0 0
hamnophilidae
hamnophilus caerulescens Vieillot, 1816 I D 2 3 12 1
hamnophilus ruicapillus Vieillot, 1816 I I 0 3 1 26
Dysithamnus mentalis (Temminck, 1823) I D 22 0 0 0
Drymophila malura (Temminck, 1825) I D 0 0 4 0
conopophagidae
Conopophaga lineata (Wied, 1831) I D 13 0 0 0
Grallariidae
Hylopezus nattereri (Pinto, 1937) I D 1 0 0 0
Formicariidae
Chamaeza campanisona (Lichtenstein, 1823) I D 115 0 0 0
Scleruridae
Sclerurus scansor (Menetries, 1835) I D 36 0 0 0
Dendrocolaptidae
Sittasomus griseicapillus (Vieillot, 1818) I D 31 0 3 0
Xiphocolaptes albicollis (Vieillot, 1818) I D 2 1 5 0
Families/species Diet Forest dependence areas
a50 a20 a10 a05
Xiphorhynchus fuscus (Vieillot, 1818) I D 3 0 0 0
Lepidocolaptes falcinellus (Cabanis& Heine, 1859) I D 6 0 1 0
Furnariidae
Leptasthenura setaria (Temminck, 1824) I D 26 0 0 0
Synallaxis ruicapilla Vieillot, 1819 I D 0 12 0 0
Synallaxis cinerascens Temminck, 1823 I D 7 13 13 1
Synallaxis spixi Sclater, 1856 I S 0 20 25 10
Cranioleuca obsoleta (Reichenbach, 1853) I D 2 0 0 0
Syndactyla rufosuperciliata (Lafresnaye, 1832) I D 1 20 5 1
Heliobletus contaminates Berlepsch, 1885 I D 20 0 0 0
Furnarius rufus (Gmelin, 1788) I I 0 0 4 5
incertae sedis
Xenops rutilans Temminck, 1821 I D 0 1 0 0
rhynchocyclidae
Mionectes ruiventris Cabanis, 1846 I D 3 0 0 0
Phylloscartes ventralis (Temminck, 1824) I D 15 0 2 0
Tolmomyias sulphurescens (Spix, 1825) I D 25 0 1 0
Poecilotriccus plumbeiceps (Lafresnaye, 1846) I D 0 1 4 9
incertaesedis
Platyrinchus mystaceusVieillot, 1819 I D 12 0 0 0
tyrannidae
Phyllomyias fasciatus (hunberg, 1822) I S 0 0 0 0
Elaenia sp, O 3 0 0 0
Elaenia lavogaster (hunberg, 1822) O S 2 0 0 0
Elaenia spectabilis Pelzeln, 1868 O D 2 0 0 0
Elaenia parvirostris Pelzeln, 1868 O I 0 0 1 0
Elaenia mesoleuca (Deppe, 1830) O D 8 1 0 0
Camptostoma obsoletum (Temminck, 1824) O I 2 28 34 21
Serpophaga subcristata (Vieillot, 1817) I S 0 9 10 48
Euscarthmus meloryphus Wied, 1831 I S 0 2 34 16
Myiophobus fasciatus (Statius Muller, 1776) I I 0 1 0 1
Lathrotriccus euleri (Cabanis, 1868) I D 4 0 3 0
Machetornis rixosa (Vieillot, 1819) I I 0 0 1 0
Families/species Diet Forest dependence areas
a50 a20 a10 a05
Pitangus sulphuratus (Linnaeus, 1766) O I 24 29 49 21
Myiodynastes maculatus (Statius Muller, 1776) O S 7 9 3 0
Megarynchus pitangua (Linnaeus, 1766) O S 0 2 0 0
Empidonomus varius (Vieillot, 1818) I S 4 2 0 0
Tyrannus melancholicus Vieillot, 1821 I I 2 2 7 0
Myiarchus swainsoni Cabanis e Heine, 1859 I I 8 0 2 0
Attila phoenicurus Pelzeln, 1868 I D 49 0 0 0
Pipridae
Chiroxiphia caudata (Shaw e Nodder, 1793) O D 36 1 18 0
tityridae
Schifornis virescens (Lafresnaye, 1838) F D 16 0 0 0
Pachyramphus polychopterus (Vieillot, 1818) I D 15 3 2 1
Vireonidae
Cyclarhis gujanensis (Gmelin, 1789) I S 9 13 27 1
Vireo olivaceus (Linnaeus, 1766) I D 0 9 0 0
corvidae
Cyanocorax caeruleus (Vieillot, 1818) O D 12 0 0 0
Cyanocorax chrysops (Vieillot, 1818) O S 43 5 19 3
troglodytidae
Troglodytes musculus Naumann, 1823 I I 2 35 25 30
turdidae
Turdus ruiventris Vieillot, 1818 O S 75 16 25 12
Turdus leucomelas Vieillot, 1818 O S 4 0 0 0
Turdus amaurochalinus Cabanis, 1850 O S 36 0 5 1
Turdus subalaris(Seebohm, 1887) O D 3 0 0 0
Turdus albicollis Vieillot, 1818 O D 11 0 0 0
hraupidae
Saltator similis d’Orbigny e Lafresnaye, 1837 O D 12 26 47 2
Lanio melanops (Vieillot, 1818) O D 6 0 0 0
Tachyphonus coronatus (Vieillot, 1822) O D 1 3 0 0
Tangara sayaca (Linnaeus, 1766) O S 4 23 22 0
Pyrrhocoma ruiceps (Strickland, 1844) I D 4 3 11 0
Pipraeidea melanonota (Vieillot, 1819) O D 3 2 0 0
Families/species Diet Forest dependence areas
a50 a20 a10 a05
emberizidae
Zonotrichia capensis (Statius Muller, 1776) G I 10 91 130 212
Ammodramus humeralis (Bosc, 1792) G I 0 0 0 37
Poospiza cabanisi (Bonaparte, 1850) O D 4 20 5 0
Sicalis laveola (Linnaeus, 1766) G I 0 0 2 5
Lanio cucullatus (Statius Muller, 1776) G I 0 18 48 133
Sporophila caerulescens (Vieillot, 1823) G I 0 2 7 42
Volatinia jacarina (Linnaeus, 1766) G I 0 1 0 110
cardinalidae
Cyanoloxia glaucocaerulea (d’Orbigny&Lafresnaye, 1837) G S 0 0 0 12
Cyanoloxia brissonii (Lichtenstein, 1823) G S 0 0 9 1
Parulidae
Parula pitiayumi (Vieillot, 1817) I D 23 9 20 6
Geothlypis aequinoctialis (Gmelin, 1789) I I 0 0 11 14
Basileuterus culicivorus (Deppe, 1830) I D 53 41 38 0
Basileuterus leucoblepharus (Vieillot, 1817) I D 68 60 54 0
icteridae
Cacicus chrysopterus (Vigors, 1825) O D 3 2 7 0
Cacicus haemorrhous (Linnaeus, 1766) O D 6 17 6 0
Gnorimopsar chopi (Vieillot, 1819) O I 0 0 6 0
Pseudoleistes guirahuro (Vieillot, 1819) O I 0 0 1 0
Molothrus bonariensis (Gmelin, 1789) O I 0 0 0 1
Fringillidae
Sporagra magellanica (Vieillot, 1805) G I 0 0 0 4
Euphonia pectoralis (Latham, 1801) O D 9 0 0 0