Leaf traits and gas exchange in saplings of native
tree species in the Central Amazon
Keila Rego Mendes
1; Ricardo Antonio Marenco
2*
1
INPA/Instituto Nacional de Pesquisas da Amazônia – Programa de Pós-Graduação em Botânica. 2
INPA – Coordenação de Pesquisas em Silvicultura Tropical, Av. André Araújo, 1756 – C.P. 478 – 69011-970 – Manaus, AM – Brasil.
*Corresponding author <[email protected]>
ABSTRACT: Global climate models predict changes on the length of the dry season in the Amazon which may affect tree physiology. The aims of this work were to determine the effect of the rainfall regime and fraction of sky visible (FSV) at the forest understory on leaf traits and gas exchange of ten rainforest tree species in the Central Amazon, Brazil. We also examined the relationship between specific leaf area (SLA), leaf thickness (LT), and leaf nitrogen content on photosynthetic parameters. Data were collected in January (rainy season) and August (dry season) of 2008. A diurnal pattern was observed for light saturated photosynthesis (Amax) and stomatal conductance (gs), and irrespective of species, Amax was lower in the dry season. However, no effect of the rainfall regime was observed on gs nor on the photosynthetic capacity (Apot, measured at saturating [CO2]). Apot and leaf thickness increased with FSV, the converse was true for the FSV-SLA relationship. Also, a positive relationship was observed between Apot per unit leaf area and leaf nitrogen content, and between Apot per unit mass and SLA. Although the rainfall regime only slightly affects soil moisture, photosynthetic traits seem to be responsive to rainfall-related environmental factors, which eventually lead to an effect on Amax. Finally, we report that little variation in FSV seems to affect leaf physiology (Apot) and leaf anatomy (leaf thickness).
Key words: diurnal variation, forest understory, photosynthetic capacity, rainfall seasonality
Características foliares e trocas gasosas em arvoretas de
espécies nativas da Amazônia Central
RESUMO: Os modelos climáticos globais prevêem mudanças na extensão da época seca na Amazônia, o que pode afetar a fisiologia das árvores. Os objetivos deste trabalho foram determinar o efeito da sazonalidade da precipitação e fração de céu visível (FSV) no sub-bosque da floresta nas características foliares e trocas gasosas de 10 espécies florestais da Amazônia Central. Também examinou-se a relação entre área foliar específica (SLA), espessura da folha (LT) e nitrogênio foliar em parâmetros fotossintéticos. Os resultados foram coletados nos meses de janeiro (época chuvosa) e agosto (época seca) de 2008. Observou-se um padrão de variação diurna na fotossíntese saturada por luz (Amax) e na condutância estomática (gs). Independente da espécie, Amax foi menor na época seca. No entanto, não houve efeito da sazonalidade das chuvas em gs nem na capacidade fotossintética (Apot medida em [CO2] saturante). Apot e a espessura da folha (LT) aumentaram com FSV, o contrário foi observado para a relação FSV-SLA. Também, observou-se uma relação positiva entre Apot por unidade de área e conteúdo de nitrogênio foliar, e entre Apot, por unidade de massa e SLA. Embora o regime das chuvas apenas levemente influenciou a umidade do solo, características fotossintéticas parecem responderem a fatores relacionados com as chuvas, o que repercute em Amax. Finalmente, relata-se que pequenas variações em FSV parecem afetar a fisiologia da folha (Apot) e a anatomia foliar (espessura da folha).
Palavras-chave: capacidade fotossintética, sub-bosque, variação diurna, sazonalidade das chuvas
Introduction
Global climate models predict that in the Amazon the length of the dry season period will be extended as a result of global warming associated to an increase of atmospheric CO2 concentration (Cox et al., 2004). In-deed, a prolonged dry period may affect plant growth and physiological processes, such as photosynthesis and respiration (Hughes, 2000). Although severe soil mois-ture depletion during prolonged drought may lead to sto-matal closure and a decline in leaf area (Nepstad et al., 1994), there is still controversy on whether
photosyn-thetic traits of canopy trees have received some atten-tion in tropical forest (e.g. Marenco and Vieira, 2005; Poorter and Oberbauer, 1993), how seasonality of the rainfall regime affects seedling and sapling photosyn-thetic traits in the Central Amazon still remains to be elucidated.
In addition to soil moisture, light availability is one of the most important factors limiting seedling and sap-ling growth in the forest understory (Denslow et al., 1990; Valladares and Niinemets, 2008). Through the canopy profile light varies not only in total quantity, but also in quality, as the red/far red (R/Fr) ratio declines towards the forest floor (Smith, 1982). Low irradiance often leads to a decrease in leaf thickness and light satu-rated photosynthesis (Amax), whereas specific leaf area (SLA) commonly increases under low light intensity (Oguchi et al., 2005). Plant growth is the result of a com-plex of interacting factors intrinsically related to carbon gain via photosynthesis and loss due to respiration. However, over a wide range of plants species and growth conditions there seems to be a positive relationship be-tween plant growth and photosynthetic rates (Kruger and Volin, 2006)
In this study we hypothesized that variation in soil moisture and subtle changes in light availability in the forest understory affect leaf traits and carbon gain in sap-lings of canopy trees. Thus, the aims of this work were to determine the effect of the seasonal rainfall regime and understory irradiance on leaf traits and gas exchange in ten rainforest tree species. We also examined the ef-fect of specific leaf area (SLA), leaf thickness (LT), and nitrogen content on the photosynthetic capacity.
Material and Methods
The study was conducted 60 km north of Manaus (02º36’21" S; 60°08’11" W), state of Amazonas, Brazil, in an area of native “terra-firme” forest. The region has characteristics of a humid equatorial climate, with a short mild dry season (July-September, with a rainfall of 50-100 mm per month), and a dry-wet transition month (October). The wet season extends from
Novem-ber to May (200-300 mm month–1). Annual precipitation is 2240 mm (Inmet, 2008, mean of 1961 to 1990). The area is covered by a dense forest and the predominant soil type is an Oxisol of low fertility, clay texture and pH of 4.2 to 4.5.
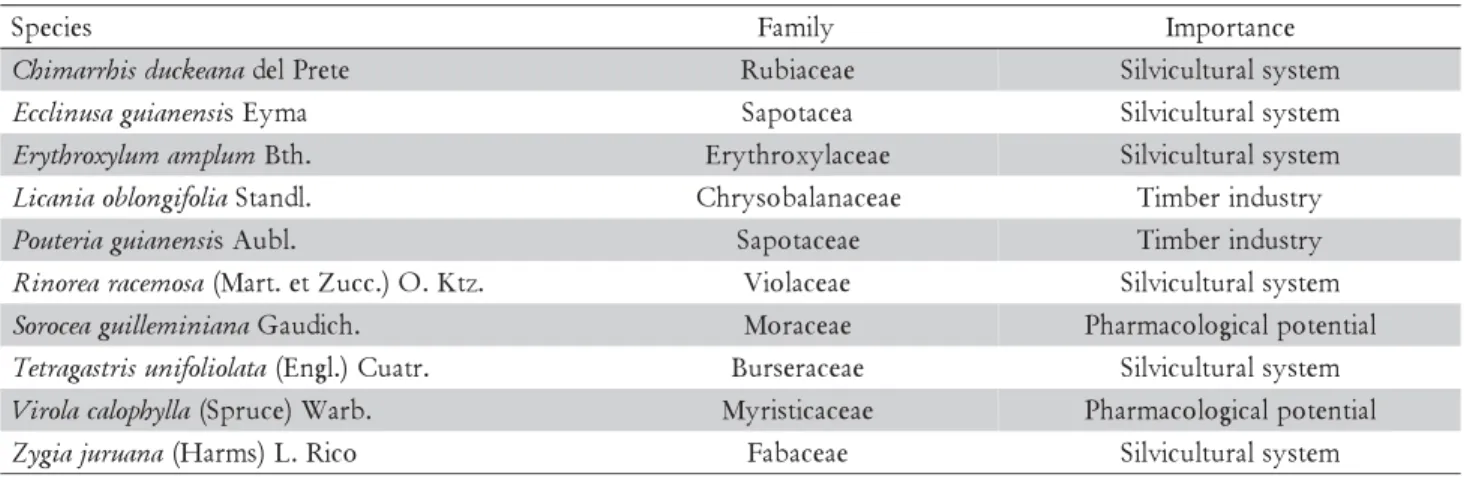
We used saplings (1.5 to 2-m tall) of 10 tree species selected taking into account their shade tolerance, rela-tive abundance of saplings in the forest understory (at least three replications per species), and economic im-portance (Table 1). The gas exchange parameters were measured with an infrared gas analyzer (Li-6400, Li-Cor, NE, USA) using one or two leaves per plant and three saplings per species on each season. Light saturated pho-tosynthesis (Amax) was measured at ambient CO2 concen-tration (380 μmol mol–1), light saturation (1000 μmol m–2 s–1, and ambient temperature (28 ± 1ºC). Potential pho-tosynthesis (Apot, hereafter termed photosynthetic capac-ity) was also measured at light saturation, but at a [CO2] of 2000 μmol mol–1, rather than ambient [CO
2]. Gas ex-change data were collected after a stabilization period of about 10-15 min (total coefficient of variation < 0.7%). The effect of the time of day on stomatal conductance (gs) and Amax was assessed across species by collecting data between 06h00 and 18h00. Data were collected in January and August 2008 in mature and fully expanded leaves.
Specific leaf area (SLA, the leaf area to leaf mass ra-tio) was determined in both seasons. As additional in-formation, leaf thickness was determined in the dry sea-son and leaf nitrogen content in the wet seasea-son. We mea-sured SLA in a sample of six circles of 240-mm2- per leaf obtained from a sample of two to eight leaves per plant, depending on leaf size. We only determined nitrogen (Kjeldahl method) in the wet season (first studied sea-son) in order to preserve the foliage for further studies in the same area. Fresh leaf thickness (FLT) and dry leaf thickness (DLT) were measured with digital calipers in 240-mm2-leaf circles (two per leaf) punched from the widest part of the leaf blade, and between the major veins (accuracy of 10 μm). Leaves used for SLA, leaf nitrogen and leaf thickness measurements were the same or simi-lar in appearance (when more than two leaves were
re-Table 1 – Families and importance of the species.
s e i c e p
S Family Importance
a n a e k c u d s i h r r a m i h
C delPrete Rubiaceae Silviculturalsystem
i s n e n a i u g a s u n i l c c
E sEyma Sapotacea Silviculturalsystem
m u l p m a m u l y x o r h t y r
E Bth. Erythroxylaceae Silviculturalsystem
a i l o f i g n o l b o a i n a c i
L Stand.l Chrysobalanaceae Timberindustry
i s n e n a i u g a i r e t u o
P sAub.l Sapotaceae Timberindustry
a s o m e c a r a e r o n i
R (Mart.etZucc.)O.Ktz. Violaceae Silviculturalsystem
a n a i n i m e l l i u g a e c o r o
S Gaudich. Moraceae Pharmacologicalpotential
a t a l o i l o f i n u s i r t s a g a r t e
T (Eng.l)Cuatr. Burseraceae Silviculturalsystem
a l l y h p o l a c a l o r i
V (Spruce)Warb. Myristicaceae Pharmacologicalpotential
a n a u r u j a i g y
quired for analysis) to those used for gas exchange terminations. Leaf dry mass was obtained after leaf de-hydration at 72°C until constant mass. The fraction of sky visible (FSV) beneath the canopy was measured us-ing a canopy analyzer (LAI-2000, Li-Cor, NE, USA), un-der overcast sky conditions to improve the accuracy of the instrument, and calculated by integrating the gap frac-tion to yield the fracfrac-tion of sky not blocked by foliage. For each sapling, six FSV readings, collected at a dis-tance of about 1.5 m from the stem and forming a circle around the plant (the microsite), were recorded at each microsite and a mean value was obtained. The height of the sensor above the ground corresponded to the height of leaves used for the gas exchange measurements (1 to 2 m above the ground). Finally, we used a second LAI-2000 sensor, operating in the remote mode and installed on the top of a 40-m-tall observation tower (located in a nearby area), to log FSV values above the forest canopy. Irradiance and rainfall data were recorded above the forest canopy at the top of the 40-m tall observation tower. Irradiance at the observation tower (Iopen) was measured using a quantum sensor (Li-190 SA, Li-Cor, NE, USA). Understory irradiance (Iund) was estimated as the product of FSV by Iopen (i.e. Iund = FSV x Iopen). We are aware that Iund is lower than the actual light availability at sapling height, as it does not take into account the background of diffuse light in the forest understory (about 5-8 μmol m–2 s–1 at midday (Marenco and Vieira, 2005). Temperature and air humidity data were recorded at 30-min-intervals with a sensor (Humitter 50y, Vaisala Oy, Finland) connected to a datalogger (Li-1400, Li-Cor, NE, USA) at a selected site in the understory. In addition, an external quantum sen-sor (Li-190 SA, Li-Cor, USA) mounted on the Li-6400's irga head was used to log irradiance data at the same time as gas exchange measurements were made. Both in the dry and rainy season, soil moisture was deter-mined gravimetrically: 100(Sw - Sd)/Sw,where Sw and Sd represent the mass of wet and dry, undisturbed 110-cm3 -soil samples. Soil samples were collected at random in the study area at the depth of 200 mm, both in the wet
(26 samples) and dry season (12 samples). All data, but leaf thickness and N content (determined only in one season), were subjected to analysis of variance (ANOVA) to assess the effect of the rainfall seasonal-ity on the parameters. The Lilliefors test was conducted to assess whether experimental errors were normally distributed. As no transformation was needed, all sta-tistical analyses were carried out on untransformed data. When the effect of rainfall seasonality on the vari-ables was not significant (p > 0.05), data were pooled and linear or quadratic regression analyses conducted to examine the effect of FSV and SLA on photosynthetic traits. Tukey post-hoc test was used for mean separa-tion (p ≤ 0.05).
Results and Discussion
Monthly rainfall was 353 mm in January and 105 mm in August (Table 2), which is in accordance with the his-torical mean (1961-1990) for the region (Inmet, 2008). In these months, soil moisture ranged between 31% in the dry season to 32% in the wet season, near the soil satu-ration point of 39% on a wet soil basis (Table 2). Air temperature at the forest floor ranged from 22°C at night to 29°C at noon, and for most of the day the relative humidity was above 90%, with no difference between seasons (Figure 1). Accumulated irradiance at the forest floor was 0.3 and 0.6 mol m–2 day–1 in the wet and dry seasons, respectively. On the other hand, mean maxi-mum understory irradiance was about 10 and 20 μmol m–2 s–1 for the wet and dry seasons, respectively, or about 1.5-2% of the irradiance recorded above the forest canopy (Figure 1). Iund values reported in this study are a some-what higher than those observed by others (Kursar and Coley, 1999; Marenco and Vieira, 2005), perhaps because our Iund values were recorded about 1-2 m above the ground rather than at the forest floor. Molion (1987) es-timated that the irradiance that reaches the forest floor is 1.2% (approximately 14 μmol m–2 s–1 on a sunny day) of that received above the forest canopy, similar to our Iund values observed in the wet season.
Table 2 – Light saturated photosynthesis (Amax) (mean ± SE), photosynthetic capacity (Apot), fraction of sky visible (FSV), stomatal conductance (gs), leaf area index, photosynthetic photon flux density (PFD) above the forest canopy, rainfall and soil moisture observed in January (rainy season) and August (dry season) of 2008.
r e t e m a r a
P January August
Amax(µmolm–2s–1) 3.3±0.3a 2.5±0.2b
Apot(µmolm–2s–1) 8.04±0.24a 8.66±0.31a
) s s e l t i n u ( V S
F 0.014±0.001b 0.020±0.001a
gs(molm–2s–1) 0.1±0.01a 0.1±0.01a
) s s e l t i n u ( x e d n i a e r a f a e
L 5.1±0.05a 4.7±0.06b
m l o m ( D F
P –2day–1) 20.83±1.2b 31.52±1.0a
1Rainfall(mm) 353 105
) % ( e r u t s i o m l i o
S 32±0.6%a 31±0.4%a
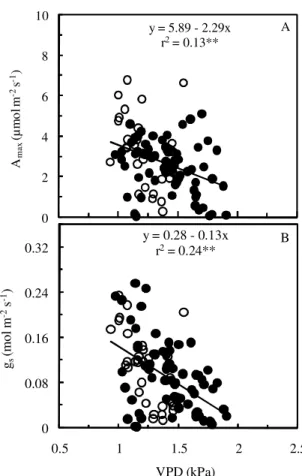
Early in the morning and late in the afternoon sto-mata did not respond to light stimulus, remaining closed even at saturating irradiance (1000 μmol m–2 s–1) for pho-tosynthesis in the leaf chamber (Figure 2). Stomata closed and Amax declined as the vapor pressure deficit (VPD) increased (Figure 3). However, as the forest un-derstory became brighter, Amax and gs tended to linearly increase with irradiance (Figure 4), which indicates that in this environment gs and Amax are under the influence of a diurnal cycle, perhaps affected by light and VPD (Figures 3, 4). Our results agree with those reported by Kaiser and Kappen (2000) who observed maximum gs val-ues between 10h00 and 14h00 and a minimum stomatal aperture at sunset.
Light induces stomatal opening (Shimazaki et al., 2007) and thus stomata may open at irradiances above 2-8 μmol m–2 s–1 (Habermann, 1973). However, soon af-ter dawn light was ineffective in triggering stomatal open-ing. Since irradiance, relative humidity and temperature changed during daytime on the forest floor (Figure 1), it is possible that somehow these environmental factors affected stomatal functioning during the day. Although the light environment had an effect on gs (p < 0.05, Fig-ure 4B), the correlation between gs and irradiance at
mea-suring time was tenuous (r2 = 0.05*). VPD has an im-portant effect on gs, but it only explains 24% of varia-tion (Figure 3B). Thus, we cannot rule out the effect of endogenous factors in modulating stomatal functioning, as reported by others, both in herbaceous plants (Gorton et al., 1993; Holmes and Klein, 1986) and forest trees (Doughty et al., 2006).
Although there was no difference in soil moisture between the dry and rainy season, Amax was lower in the dry season (Table 2), which suggests that even a slight decline in soil moisture, or perhaps in leaf water poten-tial associated to a higher irradiance in the dry period, may affect some photosynthetic traits of understory sap-lings, perhaps mesophyll conductance (gm). Under pro-gressive drought gm may decline (Flexas et al., 2002). This hypothesis is consistent with the fact that both Apot and gs were unaffected by rainfall seasonality. As gs was not influenced by rainfall seasonality (Table 2), differences in Amax between seasons may be ascribed to a limitation of carbon uptake imposed by non-stomatal factors. Had the dry season had any detrimental effect on Rubisco
Figure 1 – Diurnal irradiance above the forest canopy (A, Iopen), and relative humidity (RH), temperature (T) and irradiance at the forest understory (B, Iund). Data were collected in January (rainy season, R) and August (dry season, D) of 2008.
0 300 600 900 1200 1500
Iope
n
(µ
m
o
l m
-2
s
-1) I
open-D
Iopen-R
A
40 60 80 100
0 12 24 36 48
0 5 10 15 20 25
RH
(
%
)
Iund
(µ
m
o
l m
-2
s
-1), T
(°
C
)
Time (h)
RHR
RHD T
R
TD
Iund-R
Iund-D B
Figure 2 – Diurnal variation in light saturated photosynthesis (A, Amax), stomatal conductance (B, gs) in January (rainy season, open circle, {) and August (dry season, closed circle, z) of 2008 in saplings of 10 forest tree species of the Central Amazon. Each symbol represents one leaf (one or two leaves per plant). Measurements were made at a [CO2] of 380 μmol mol–1, irradiance of 1000 μmol m–2 s–1 and leaf temperature of 28 ± 1ºC. The continuous line shows the trend observed throughout the day. **significant at p < 0.01.
y = - 5.42 + 1.51x - 0.07x2
r2= 0.16**
0 2 4 6 8 10
Ama
x
(µ
m
o
l m
-2
s
-1)
A
y = - 0.32 + 0.08x - 0.003x2
r2= 0.24**
0 0.08 0.16 0.24 0.32
5 7 9 11 13 15 17 19
gs
(m
o
l m
-2
s
-1)
Time (h)
activity or ATP synthesis (Flexas and Medrano, 2002) Apot should have declined, but it did not. This allows us to conclude that the seasonality may have an effect on gm. In relation to the seasonal effect on Amax is im-portant to take into account that climate models pre-dict changes in the total rainfall in the Amazon as a result of global warming (Cox et al. 2004; Oyama and Nobre, 2003). Besides, differences among species were not observed in Amax nor in Apot, so data from both rain-fall seasons were pooled to obtain a mean value for each species (Table 3).
At ambient CO2 concentration (380 μmol mol–1), A max was closely related with gs (r2 = 0.60**, Figure 5A), which is consistent with results reported by others (Machado et al., 2002; Marenco et al., 2006; Park and Furukawa, 1999). Nonetheless, the correlation between Apot and gs was very low (r2 = 0.01ns) at saturating CO
2 concentra-tion (Figure 5B), indicating that Apot is little influenced by stomatal opening in the gs range observed for most of the day (08h00 to 16h00). Except very early in the morning, when most stomata were closed, their resis-tance to CO2 diffusion into intercellular spaces was off-set by an elevated CO2 concentration in the leaf cham-ber. However, when gs was very low (less than 0.015 mol m–2 s–1, denoted by diamonds in Figure 5B) the resistance imposed by stomatal closure was not compensated by a high CO2 concentration in the leaf chamber, which led to a reduction in photosynthetic capacity. Thus, a gs of 0.015 mol m–2 s–1 most likely reflects a threshold below which leaf conductance is mainly due to cuticular con-ductance (gc). Because Apot remained quite constant for most of the day, the effect of FSV, SLA, LT and leaf ni-trogen on photosynthetic rates were examined with re-spect to Apot rather that Amax, which was strongly depen-dent on gs. FSV was positively related to leaf thickness Figure 3 – Relationship between light saturated photosynthesis
(A, Amax) and stomatal conductance (B, gs) and vapor pressure deficit (VPD), in January (rainy season, open circle, {) and August (dry season, closed circle, z) of 2008 in saplings of 10 forest tree species of the Central Amazon. Each symbol represents one leaf (one or two leaves per plant). Experimental conditions as described in Figure 2. **significant at p < 0.01.
y = 5.89 - 2.29x
r2= 0.13**
0 2 4 6 8 10
Ama
x
(µ
m
o
l m
-2s -1)
A
y = 0.28 - 0.13x
r2= 0.24**
0 0.08 0.16 0.24 0.32
0.5 1 1.5 2 2.5
gs
(m
o
l m
-2
s
-1)
VPD (kPa)
B
Table 3 – Light saturated photosynthesis (Amax), photosynthetic capacity (Apot), specific leaf area (SLA), fresh leaf thickness (FLT), dry leaf thickness (DLT), and leaf nitrogen content determined in saplings of native tree species of the Central Amazon. Each value represents the mean of two seasons (Amax, Apot and SLA) or one season (leaf thickness and leaf nitrogen).
Means followed by the same letters within columns do not differ according to Tukey test at 5% probability. s
e i c e p
S Amax Apot SLA FLT DLT Leafnitrogen
--- µmolm–2s–1------------- m2kg–1 ------------------mm ------------------ gm–2
a n a e k c u d .
C 2.9a 8.0a 16.3bc 0.23a 0.18a 1.3bc
s i s n e n a i u g .
E 3.6a 8.3a 14.2c 0.18cd 0.13bc 1.4ab
m u l p m a .
E 4.2a 9.6a 19.0ab 0.22ab 0.16ab 1.1bcd
a i l o f i g n o l b o .
L 2.7a 7.1a 15.3bc 0.23a 0.16ab 1.2bcd
s i s n e n a i u g .
P 3.5a 8.8a 16.9abc 0.15d 0.11c 1.0cd
a s o m e c a r .
R 2.7a 8.0a 20.8a 0.21ab 0.15ab 0.9cd
a n a i n i m e l l i u g .
S 2.0a 8.6a 13.5c 0.20abc 0.15ab 1.7a
a t a l o i l o f i n u .
T 2.3a 8.1a 18.7ab 0.16cd 0.11c 0.9d
a l l y h p o l a c .
V 2.5a 8.1a 15.9bc 0.16cd 0.13bc 1.2bc
a n a u r u j .
Z 2.9a 8.7a 15.4bc 0.17bcd 0.12bc 1.3bc
n a e
M 3.3 8.3 16.6 0.19 0.14 1.2
) % ( V
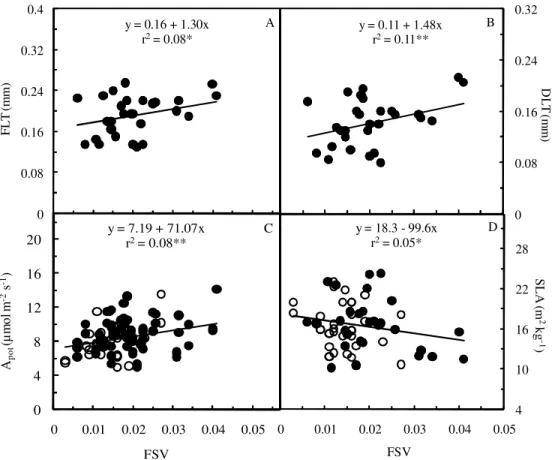
(Figures 6A, B) and Apot (Figure 6C), whereas its rela-tionship with SLA was negative (Figure 6D). DLT ranged from 0.11 mm in P. guianensis and T. unifoliolata to 0.18 mm in C. duckeana (Table 3), with an increase of about 35% in fresh leaves (Table 3), in both cases, a positive correlation between leaf thickness and Apot was found (Figure 7).
The effect of FSV on Apot, LT and SLA shows that even small changes in intensity of light in the forest floor can alter the performance of the photosynthetic appara-tus. This is in agreement with results reported by oth-ers (Ellsworth and Reich, 1993; Oguchi et al., 2005; Weston et al., 2000), who observed increases in LT in leaves exposed to brighter environments. The relation-ship between LT and Apot concurs with previous find-ings (McMillen and McClendon, 1983; Niinemets, 1999; Reich et al., 1998). Even when Apot and LT and SLA were strongly related (Figures 7, 8), we cannot attribute in-creases in Apot only to variations in LT or SLA, as
pho-Figure 5 – Relationship between light saturated photosynthesis (A, Amax) and photosynthetic capacity (B, Apot) and stomatal conductance (gs) in January (rainy season, open circle, {) and August (dry season, closed circle,
z) of 2008 in saplings of ten native forest tree species of the Central Amazon. Apot was measured at a [CO2] of 2000 μmol mol–1 and saturating light. Other experimental conditions as described in Figure 2. The diamonds () in Figure 5B show the values of Apot soon after dawn, when gs was very low. Each symbol represents one leaf (one or two leaves per plant). ns: not significant (p > 0.05), **significant at p < 0.01.
y = 5.91 + 1.18ln(x)
r2= 0.60**
-2 2 6 10 14
Ama
x
(µ
mo
l m
-2
s
-1)
A
y = 8.14 + 3.25x
r2= 0.01ns
0 6 12 18
-0.01 0.07 0.15 0.23 0.31
Apot
(µ
m
o
l m
-2s -1)
gs (mol m-2s-1)
B
Figure 4 – Relationship between light saturated photosynthesis (A, Amax) and stomatal conductance (B, gs) and instantaneous irradiance recorded at the forest understory during gas exchange measurements, in January (rainy season, open circle, {) and August (dry season, closed circle, z) of 2008 in saplings of 10 forest tree species of the Central Amazon. Each symbol represents one leaf (one or two leaves per plant). Experimental conditions as described in Figure 2. *significant at p < 0.05; **significant at p < 0.01.
y = 2.61 + 0.016x
r2= 0.09**
0 2 4 6 8 10
Ama
x
(µ
m
o
l m
-2
s
-1)
A
y = 0.090 + 0.0005x
r2= 0.05*
0 0.08 0.16 0.24 0.32
0 10 20 30 40 50
gs
(m
o
l m
-2
s
-1)
Irradiance (µmol m-2 s-1)
B
200 300
tosynthetic compounds are less effectively used in thicker leaves, perhaps because of a lower leaf conduc-tance in these leaves (Niinemets, 1999).
photosynthetic rates. For Acmena ingens, for example, under low irradiance (≤ 20 % of full sunlight) gs and Amax where lower in plants grown under a reduced R/Fr ra-tio (0.2) than in control plants (R/Fr of sunlight, 1.2) (Turnbull, 1991).
SLA ranged from 13.5 m2 kg–1 in S. guilleminiana to 20.8 m2 kg–1 in R. racemosa, whereas the leaf nitrogen con-tent varied between 0.9 g m–2 for T. unifoliolata and R. racemosa to 1.7 g m–2 for S. guilleminiana (Table 3). SLA values found in this study are within the range (15 and 24 m2 kg–1) observed by Marenco and Vieira (2005) for saplings of canopy tree species. FSV had a positive ef-fect on LT, and a negative one on SLA (p < 0.05). The positive effect of leaf nitrogen on Apot (Figure 9) is con-sistent with the results reported by Hikosaka (2004; 2005). However, although significant, the relationship between Apot and leaf N was weak (r2 = 0.14, p < 0.05) (Figure 9), indicating that a substantial fraction of the leaf nitrogen is partitioned into non-photosynthetic struc-tures. On the other hand, differences in determination coefficients (r2)between DLT and SLA against FSV (0.11** versus 0.05* for SLA, Figure 6B, D) occur because SLA depends not only on LT, but also on leaf density (Niinemets, 1999), which suggests that FSV has a lower effect on leaf density. Although LT is affected by growth irradiance, we can not explain the wide variations in SLA
Figure 6 – Fresh (A, FLT) and dry leaf thickness (B, DLT), photosynthetic capacity (C, Apot) and specific leaf area (D, SLA) as a function of the fraction of sky visible (FSV) in January (rainy season, open circle, {) and August (dry season, closed circle, z) of 2008 in saplings of ten forest tree species of the Central Amazon. Experimental conditions as described in Figure 5. Each symbol represents one leaf (one or two leaves per plant). *significant at p < 0.05; **significant at p < 0.01
y = 0.16 + 1.30x
r2= 0.08*
0 0.08 0.16 0.24 0.32 0.4
FL
T
(m
m)
A y = 0.11 + 1.48x
r2= 0.11**
0 0.08 0.16 0.24 0.32
D
LT (
m
m
)
B
y = 7.19 + 71.07x
r2= 0.08**
0 4 8 12 16 20
0 0.01 0.02 0.03 0.04 0.05
Apot
(µ
m
o
l m
-2
s
-1)
FSV
C y = 18.3 - 99.6x
r2= 0.05*
4 10 16 22 28
0 0.01 0.02 0.03 0.04 0.05
SL
A
(
m
2
kg
-1
)
FSV
D
among species only by differences in microsite bright-ness (inferred by FSV values) at the forest floor. This suggests that the genetic background of each species plays a major role in determining adaptive strategies to the physical and ecological environment (soil fertility and acidity, herbivory, etc.), which thereby leads to changes in LT and SLA under a given growth conditions (Lee et al., 2000; Peeters, 2002). Increase in LT (decline in SLA) is often related to higher photosynthetic rates per unit leaf area (McMillen and McClendon, 1983; Yun and Taylor, 1986), because of a greater accumulation of photosynthetic proteins. However, it may also involve an increase in the amount of molecules and compounds not directly related to carbon assimilation but with a key role for plant defense against herbivory and for in-creasing resistance against other physical hazards (Coley, 1988; Wright and Cannon, 2001).
the dry season of 2008 was not strong enough to unam-biguously negate any potential effect of rainfall season-ality on the photosynthetic capacity of saplings. Further studies are needed to elucidate how a prolonged dry sea-son may affect the diurnal pattern of photosynthesis, Rubisco activity, and electron transport rates, which may ultimately affect tree growth in the Central Amazon. Fi-nally, even though irradiance in the forest floor is usu-ally very low, it remarkably affects leaf physiology and leaf anatomy, as photosynthetic capacity, LT and SLA responded to variations in the fraction of sky visible in the forest understory.
Acknowledgements
To the Ministry of Science and Technology MCT/ INPA, FAPEAM (project PIPT-1746-08), CAPES and CNPq.
References
Coley, P.D. 1988. Effects of plant growth rate and leaf lifetime on the amount and type of anti-herbivore defense. Oecologia 74: 531-536.
Cox, P.M.; Betts, R.A.; Collins, M.; Harris, P.P.; Huntingford, C.; Jones, C.D. 2004. Amazonian forest dieback under climate-carbon cycle projections for the 21st century. Theoretical and Applied Climatology 78: 137-156.
Denslow, J.S.; Schultz, J.C.; Vitousek, P.M.; Strain, B.R. 1990. Growth responses of tropical shrubs to treefall gap environments. Ecology 71: 165-179.
Doughty, C.E.; Goulden, M.L.; Miller, S.D.; Rocha, H.R. 2006. Circadian rhythms constrain leaf and canopy gas exchange in an Amazonian forest. Geophysical Research Letters 33: 1-5 (L15404, DOI 10.1029/2006GL026750).
Ellsworth, D.S.; Reich, P.B. 1993. Canopy structure and vertical patterns of photosynthesis and related leaf traits in a deciduous forest. Oecologia 96: 169-178.
Figure 8 – Relationship between photosynthetic capacity (Apot) and specific leaf area (SLA) in January (wet season, open circle, {) and August (dry season, closed circle,
z) of 2008 in saplings of forest tree species of the Central Amazon. Experimental conditions as described in Figure 5. Each symbol represents one leaf (one or two leaves per plant). **significant at p < 0.01.
y = 22.8 + 6.9x
r2= 0.41**
0 60 120 180 240 300
4 10 16 22 28
Apo
t
(n
mo
l g
-1
s
-1)
SLA (m2kg-1)
Figure 7 – Relationship between photosynthetic capacity (Apot) and fresh leaf thickness (A, FLT) and dry leaf thickness (B, DLT) in August (dry season) of 2008 in saplings of ten forest tree species of the Central Amazon. Experimental conditions as described in Figure 5. Each symbol represents one leaf (one or two leaves per plant). **significant at p < 0.01.
0 4 8 12 16 20
Apot
(µ
m
o
l m
-2
s
-1)
r = 0.39** A
0 4 8 12 16 20
0 0.08 0.16 0.24 0.32
Apot
(µ
m
o
l m
-2
s
-1)
LT (mm)
r = 0.39** B
Figure 9 – Relationship between photosynthetic capacity (Apot) and leaf nitrogen content in January (wet season) of 2008 in saplings of ten forest tree species of the Central Amazon. Experimental conditions as described in Figure 5. Each symbol represents one leaf (one or two leaves per plant). *significant at p < 0.05.
y = 5.52 + 2.07x
r2= 0.14*
0 4 8 12 16 20
0 0.5 1 1.5 2 2.5
Apot
(µ
mo
l m
-2
s
-1)
Flexas, J.; Medrano, H. 2002. Drought-inhibition of photosynthesis in C3 plants: stomatal and non-stomatal limitations revisited. Annals of Botany 89: 183-189.
Flexas, J; Bota, J., Escalona, J.M.; Sampol, B.; Medrano, H. 2002. Effects of drought on photosynthesis in grapevines under field conditions: an evaluation of stomatal and mesophyll limitations. Functional Plant Biology 29: 461-471
Gorton, H.L.; Williams, W.E.; Assmann, S.M. 1993. Circadian rhythms in stomatal responsiveness to red and blue-light. Plant Physiology 103: 399-406.
Habermann, H.M. 1973. Evidence for two photoreactions and possible involvement of phytochrome in light-dependent stomatal opening. Plant Physiology 51: 543-548.
Hikosaka, K. 2004. Interspecific difference in the photosynthesis– nitrogen relationship: patterns, physiological causes, and ecological importance. Journal of Plant Research 117: 481-494. Hikosaka, K. 2005. Nitrogen partitioning in the photosynthetic apparatus of Plantago asiatica leaves grown under different temperature and light conditions: similarities and differences between temperature and light acclimation. Plant and Cell Physiology 46: 1283-1290.
Holmes, M.G.; Klein, W.H. 1986. Photocontrol of dark circadian rhythms in stomata of Phaseolus vulgaris L.Plant Physiology 82: 28-33.
Huete, A.R.; Didan, K.; Shimabukuro, Y.E.; Ratana, P.; Saleska, S.R.; Hutyra, L.R.; Yang, W; Nemani, R.R.; Myneni, R. 2006. Amazon rainforests green-up with sunlight in dry season. Geophysical Research Letters 33: 1-4 (L06405. DOI:10.1029/ 2005GL025583).
Hughes, L. 2000. Biological consequences of global warming: is the signal already apparent? Trends in Ecology and Evolution 15: 56-61.
Instituto Nacional de Meteorologia [INMET]. 2008. Climate. Available at: http://www.inmet.gov.br/clima. [Accessed Nov. 15, 2008].
Kaiser, H.; Kappen, L. 2000. In situ observation of stomatal movements and gas exchange of Aegopodium podagraria L. in the understorey. Journal of Experimental Botany 51: 1741-1749. Kruger, E.L.; Volin, J.C. 2006. Reexamining the empirical relation between plant growth and leaf photosynthesis. Functional Plant Biology 33: 421-429.
Kursar, T.A.; Coley, P.D. 1999. Contrasting modes of light acclimation in two species of the rainforest understory. Oecologia 121: 489-498.
Lee, D.W.; Oberbauer, S.F.; Johnson, P.; Krishnapilay, B.; Mansor, M.; Mohamad, H.; Yap, S.K. 2000. Effects of irradiance and spectral quality on leaf structure and function in seedlings of two Southeast Asian Hopea (Dipterocarpaceae) species. American Journal of Botany 87: 447-455.
Lewis, S.L.; Malhi, Y.; Phillips, O.L. 2004. Fingerprinting the impacts of global change on tropical forests. Philosophical Transactions of the Royal Society of London 359: 437-462. Machado, E.C.; Medina, C.L.; Gomes, M.M.A.; Habermann, G.
2002. Seasonal variation of photosynthetic rates, stomatal conductance and leaf water potential in ‘Valencia’ orange trees. Scientia Agricola 59: 53-58 (in Portuguese, with abstract in English).
Marenco, R.A.; Siebke, K.; Farquhar, G.D.; Ball, M.C. 2006. Hydraulically based stomatal oscillations and stomatal patchiness in Gossypium hirsutum. Functional Plant Biology 33: 1103-1113.
Marenco, R.A.; Vieira, G. 2005. Specific leaf area and photosynthetic parameters of tree species in the forest understorey as a function of the microsite light environment in Central Amazonia. Journal of Tropical Forest Science 17: 265-278.
McMillen, G.G.; McClendon, J.H. 1983. Dependence of photosynthetic rates on leaf density thickness in deciduous woody plants grown in sun and shade. Plant Physiology 72: 674-678.
Molion, L.C.B. 1987. Micrometeorology of an Amazonian rain forest. p. 255-272. In:Dickinson, R.E, ed. The geophysiology of Amazonia: vegetation and climate interactions. John Wiley, New York, NY, USA.
Nepstad, D.C.; Carvalho, C.R.; Davidson, E.A.; Jipp, P.H.; Lefebvre, P.A.; Negreiros, G.H.; Silva, E.D.; Stone, T.A.; Trumbore, S.E.; Vieira, S. 1994. The role of deep roots in the hydrological and carbon cycles of Amazonian forests and pastures. Nature 372: 666-669.
Nepstad, D.C.; Tohver, I.M.; Ray, D.; Moutinho, P.; Cardinot, G. 2007. Mortality of large trees and lianas following experimental drought in an Amazon forest. Ecology 88: 2259-2269. Niinemets, U. 1999. Research review components of leaf dry mass
per area: thickness and density; alter leaf photosynthetic capacity in reverse directions in woody plants. New Phytologist 144: 35-47.
Oguchi, R.; Hikosaka, K.; Hirose, T. 2005. Leaf anatomy as a constraint for photosynthetic acclimation: differential responses in leaf anatomy to increasing growth irradiance among three deciduous trees. Plant, Cell and Environment 28: 916-927. Oyama, M.D.; Nobre, C.A. 2003. A new climate-vegetation
equilibrium state for Tropical South America. Geophysical Research Letters30: 1-4 (DOI:10.1029/2003GL018600). Park, S.Y.; Furukawa, A. 1999. Photosynthetic and stomatal
responses of two tropical and two temperate trees to atmospheric humidity. Photosynthetica 36: 181-186.
Peeters, P.J. 2002. Correlations between leaf structural traits and the densities of herbivorous insect guilds. Biological Journal of the Linnean Society 77: 43-65.
Poorter, L.; Oberbauer, S.F. 1993. Photosynthetic induction responses of two rain-forest tree species in relation to light environment. Oecologia 96: 193-199.
Reich, P.B.; Ellsworth, D.S.; Walters, M.B. 1998. Leaf structure (specific leaf area) modulates photosynthesis-nitrogen relations: evidence from within and across species and functional groups. Functional Ecology 12: 948-958.
Saleska, S.R.; Didan, K.; Huete, A.R.; Da Rocha, H.R. 2007. Amazon forests green-up during 2005 drought. Science 318: 612-612.
Shimazaki, K.I.; Doi, M.; Assmann, S.M., Kinoshita, T. 2007. Light regulation of stomatal movement. Annual Review of Plant Biology 58: 219-247.
Smith, H. 1982. Light quality, photoperception, and plant strategy. Annual Review of Plant Physiology 33: 481-518.
Turnbull, M.H. 1991. The effect of light quantity and quality during development on the photosynthetic characteristics of six Australian rainforest tree species. Oecologia 87: 110-117. Valladares, F.; Niinemets, U. 2008. Shade tolerance, a key plant
feature of complex nature and consequences. Annual Review of Ecology Evolution and Systematics 39: 237-257.
Weston, E.; Thorogood, K.; Vinti, G.; López-Juez, E. 2000. Light quantity controls leaf-cell and chloroplast development in Arabidopsis thaliana wild type and blue-light-perception mutants. Planta 211: 807-815.
Williamson, G.B.; Laurance, W.F.; Oliveira, A.A.; Delamônica, P.; Gascon, C.; Lovejoy, T.E.; Pohl, L. 2000. Amazonian tree mortality during the 1997 El Niño drought. Conservation Biology 14: 1538-1542.
Wright, I.J.; Cannon, K. 2001. Relationships between leaf lifespan and structural defences in a low-nutrient, sclerophyll flora. Functional Ecology 15: 351-359.
Yun, J.I.; Taylor, S.E. 1986. Adaptive implications of leaf thickness for sun- and shade-grown Abutilon theophrasti. Ecology 67: 1314-1318.