1 Universidade de Brasília, Instituto de Ciências Biológicas, Programa de Pós-graduação em Ecologia, Brasília, DF, Brazil 2 Universidade de Brasília, Instituto de Ciências Biológicas, Departamento de Botânica, Brasília, DF, Brazil
3 Author for correspondence: acfranco@unb.br
Differences in morphological and physiological leaf characteristics
between
Tabebuia aurea
and
T. impetiginosa
is related
to their typical habitats of occurrence
Juliana Pfrimer Capuzzo1, Davi Rodrigo Rossatto1 and Augusto César Franco2,3
Recebido em 18/08/2011. Aceito em 16/04/2012
RESUMO
(Diferenças em características morfológicas e fisiológicas foliares entre Tabebuia aurea e T. impetiginosa estão relacio-nadas aos seus ambientes típicos de ocorrência). Tabebuia é um gênero representativo do bioma Cerrado, ocorrendo em formações savânicas e florestais, que diferem em termos de microclima, disponibilidade hídrica e propriedades do solo. Neste trabalho foi realizado um estudo comparativo de parâmetros morfológicos e fisiológicos entre duas espécies, sendo Tabebuia aurea (Silva Manso) Benth. & Hook. f. ex S. Moore típica de ambientes savânicos, como o cerrado sensu stricto, enquanto T. impetiginosa (Mart. Ex DC.) Standl é tipicamente encontrada nas matas de galeria, que margeiam os cursos de água. As duas espécies foram amostradas em ambientes savânicos, expostas a condições semelhantes de alta luminosidade. A espécie savânica apresentou maiores valores de espessura foliar, massa foliar específica, espessura do pecíolo, assimilação máxima de CO2, condutância estomática, transpiração e concentração
foliar de carotenóides. A espécie de mata destacou-se pelos maiores valores de área foliar específica, comprimento do pecíolo e de assimilação de CO2 em base de massa, parâmetros que contribuem para maior taxa de crescimento e de tolerância ao sombreamento. Esta distinção funcional entre as duas espécies em vários atributos foliares, mesmo quando situadas num mesmo tipo de ambiente, pode ser o resultado da história evolutiva dessas espécies em resposta às diferentes pressões seletivas nos ambientes típicos de ocorrência.
Palavras-chave: assimilação de CO2, área foliar; cerrado, pigmentos fotossintéticos, Tabebuia
ABSTRACT
(Differences in morphological and physiological leaf characteristics between Tabebuia aurea and T. impetiginosa is related to their typical habitats of occurrence). The genus Tabebuia is representative of the Cerrado biome, occurring in savanna and forest formations. These vegetation types are associated with distinct environmental conditions in terms of water availability, microclimate and soil properties. We compared morphological and physiological traits between Tabebuia aurea (Silva Manso) Benth. & Hook. f. ex S. Moore, which is typical of the savanna vegetation, and T. impetiginosa (Mart. ex DC.) Standl, which is commonly found in the gallery forests that occur along streams and rivers. Both were sampled in savanna conditions under full sun. The savanna species had higher values of leaf and petiole thickness, specific leaf mass, maximum CO2 assimilation on a leaf area basis, stomatal conductance, transpiration and in leaf concentration of carotenoids. The forest species stood out by higher values of specific leaf area, petiole length and of CO2 assimilation on a mass basis, parameters related to shade tolerance and higher growth rates. This functional distinction in a range of leaf traits that was maintained when both were naturally growing under similar environmental conditions, suggests that these are probably the result of differences in the evolutionary history of the two species in response to the contrasting environmental conditions in the typical habitats where they occur.
Introduction
The central part of Brazil is covered by a complex mosaic of grasslands, savanna and forests, known locally as the Cerrado, which originally covered an area of over 2 million km2. The position and large extent of this biome
favored the occurrence of a wide range of soils and forms of relief, which are reflected in the variety of vegetation types in this biome (Ribeiro & Walter 1998; Oliveira-Filho & Ratter 2002). The most prominent vegetation types are the cerrado sensu stricto, a savanna physiognomy highly diverse in terms of herbaceous and woody species (Ribeiro & Walter 1998) and gallery forests, which form narrow strips of arboreal vegetation along river basins and con-tain approximately one third of the tree species that are found within the Cerrado biome (Felfili 1995, Ribeiro & Walter, 2001). Cerrado sensu stricto and gallery forests are subjected to drastically different environmental pressures that impose strong constraints on species distributions in these two types of physiognomies. In cerrado sensu stricto, plants are subjected to high irradiances (Franco & Lüttgue 2002), low nutrient availability (Haridasan 2008), seasonal drought (Meinzer et al. 1999; Franco 2002) and the pre-sence of fire (Hoffmann et al. 2003). Gallery forests are generally associated with soils that have greater water and nutrient content than the surrounding savanna (Oliveira--Filho & Ratter 2002; Silva et al. 2008). On the other hand gallery forests are characterized by a dense tree canopy layer that considerably reduces incoming solar irradiance and produces strong spatial and temporal heterogeneity in the light environment (Felfili et al. 2001). Thus, the species of savanna and forest should behave as distinct functional groups due to different selective pressures imposed by these environments (Hoffmann et al. 2005).
Studies using congeneric pairs, in which a species typical of savanna (cerrado sensu stricto), and another species that occurs preferentially in the gallery forest, indicate that these two functional types differ in patterns of early growth and biomass allocation with a greater investment by savanna species in underground structures (Hoffmann & Franco 2003) and fire resistance (Hoffmann et al. 2003). The two groups also differ in some leaf characteristics such as lo-wer leaf nutrient concentrations and more leathery leaves in savanna trees (Hoffmann et al. 2005), when compared to forest trees. Forest species have a greater investment in aerial biomass, especially in leaf area and stem biomass (Hoffmann & Franco 2003; Hoffmann et al. 2005), which suggests that forest and savanna trees differ greatly in their responses to the contrasting light conditions they encounter in the two physiognomies (Barros et al. 2011). According to Hoffmann & Franco (2008), comparison of characteristics of species adapted to different environmental conditions can elucidate the selective pressures that led to morphological and functional plant diversity in these systems. In fact, to understand how plant communities would respond to
climatic and environmental changes, it is necessary to un-derstand ecophysiological differences between populations of species that inhabit different vegetation types (Lemos Filho et al. 2008).
The aim of this study was to compare morphological and physiological leaf traits of two species of the genus Tabebuia,
T. aurea (Silva Manso) Benth. & Hook. f. ex S. Moore and
T. impetiginosa (Mart. Ex DC.) Standl, which are typical
of savanna and forest, respectively (Lorenzi 2002). It was postulated that the species typical of gallery forests would have leaves that show evidence of a preferential investment in traits that minimize the effects of competition for light, while leaves in the savanna species would more strongly express traits that were related to tolerance to high amounts of light, water shortage and low availability of nutrients. It is further postulated that these differences would continue to be expressed in spite of the fact that both species have been sampled in savanna environments, subjected to similar conditions of high irradiance.
Material and methods
Study site and plant material
This study was conducted at the Ecological Reserve of IBGE (Recor), located 35 km from the center of the city of Brasilia, DF, Brazil. The administrative headquarters of the Reserve are located in the following geographical co-ordinates: 15°56’S, 47 ˚ 52’W. The reserve is located at an average altitude of 1100 m. Mean annual rainfall is about 1453 mm, with a distinct dry season from May to September and a mean annual temperature of 22 °C (www.recor.org. br). The months of June, July and August are often devoid of precipitation. Several vegetation types typical of the Cerrado vegetation are found within the Reserve including: several types of grasslands, typical savanna vegetation (cerrado
sensu stricto), woodlands (cerradão), and gallery forests
(Oliveira-Filho & Ratter 2002).
The studied species were Tabebuia aurea (Silva Manso) Benth. & Hook. f. ex S. Mooreand T. impetiginosa (Mart. Ex DC.) Standl. Ten individuals of each species were sampled in May 2011 (end of wet season). The morphological and physiological data were collected from three leaves of each individual. Trees of T. aurea were located in a transition between a campo sujo (an open savanna with scattered shrubs and few trees) and cerrado sensu stricto, while T.
im-petiginosa was measured in a cerrado sensu stricto site. Both
species were exposed to similar light conditions during the period of measurements. Photon flux density averaged 1700 ± 456 molm-2s-1 for sampled leaves of T. impetiginosa and
Morphological parameters
Leaf area was measured with a leaf area meter (CL-202, CID). Leaf thickness and petiole length and thickness were measured with a caliper (Mitutoyo, resolution of 0.001 mm). Leaves were collected and dried at 60 °C for 120 hours, and then weighed on a precision balance (± 0.0001 g). Specific leaf area (SLA, g-1 cm2) was calculated as the ratio of leaf
area to leaf dry mass. Leaf density (g cm-³), was calculated
by dividing the specific leaf mass (the ratio of leaf dry mass to leaf area) by the thickness of the leaf blade according to Wright & Westoby (2002).
Physiological parameters
Maximum CO2 assimilation (Amax; μmol m-2 s-1) with
simultaneous measurements of transpiration (E; mmol m-2 s-1) and stomatal conductance (gs; mol m-2 s-1) were
taken between 08:00 and 11:00 h with a portable system for measuring photosynthesis and transpiration (LCi, ADC BioScientific Ltd.). The system was connected to an external halogen lamp which delivered a photon flux density (DFF) of 1600 μmol m-2 s-1 at the leaf surface. Measurements were
taken every 30 seconds for 2 minutes. Maximum CO2 as-similation on a mass basis (Amass; μmol kg-1 s-1) was
calcu-lated by multiplying the specific leaf area by Amax and 0.1 to account for differences in units. Measurements of dark respiration (Resp; μmol m-2 s-1) were obtained by covering
the chamber of the IRGA with aluminum foil and waiting for the stabilization of the CO2 exchange rates. Intrinsic water use efficiency (IWUE) was calculated as the ratio of Amax and gs (Larcher 2000).
Photosynthetic pigment concentration was determined by using leaf discs of 0.5 cm in diameter placed in Eppendorf microcentrifuge tubes of amber color which contained 2 ml of DMF (N, N – dimethylformamide, Vetec). Two leaf discs were taken from each sampled leaf. The tubes were kept in the dark at 4 °C for a period of 48 hours. The samples were analyzed in a spectrophotometer Genesys 2 (Thermo Spectronic) to determine the absorbance at wavelengths of 480, 645 and 663 nm. The absorbance values were then used to calculate the concentrations of chlorophyll a, chlorophyll b, total chloro-phyll (a + b) and carotenoids according to Wellburn (1994).
Statistical analyses
In the analysis of morphological and physiological parameters, we used an ANOVA followed by Tukey’s test when the F test was significant. The significance level was set as 0.05. All data presented normality according to the Kolmogorov-Smirnov test (P> 0.50). We also tested whether the linear relationships between the different parameters differed in their slope and intercept between the two species. Differences in the regression lines between the two species were tested with the SMATR software (Warton et al. 2006).
Results
Morphological parameters
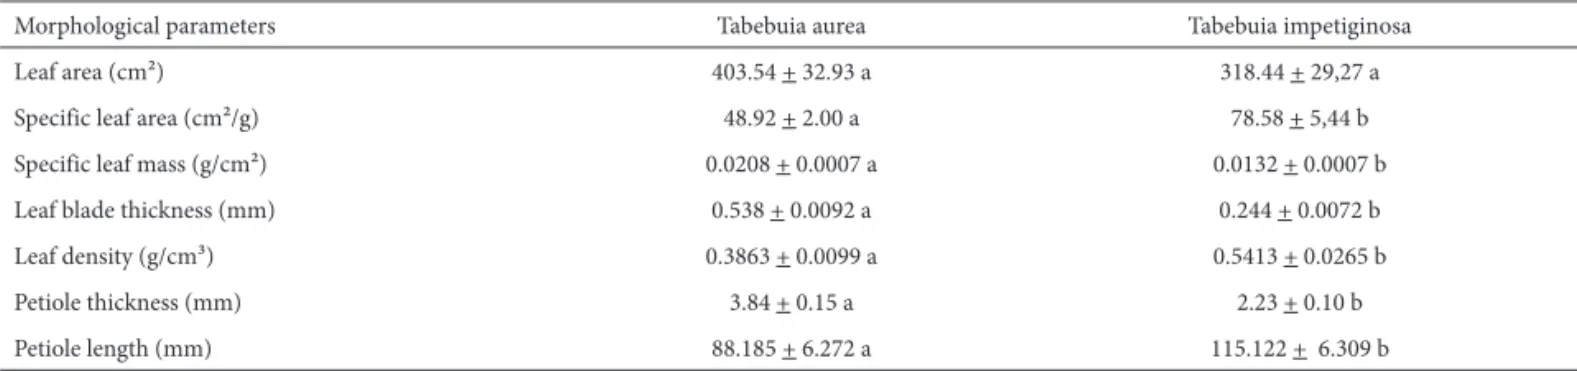
The savanna species had thicker leaves with higher specific leaf mass, while leaf density and specific leaf area were higher for the species typical of the forest environment (Tab. 1). The two species showed no statistical differences in relation to leaf area (Tab. 1).
Tabebuia aurea had thicker and shorter petioles in
relation to the forest species. Only the thickness of the pe-tiole showed a significant linear relationship with leaf area (Fig. 1) for both T. aurea (r2 = 0.741, P <0.001) and T.
im-petiginosa (r2 = 0.602, P = 0.008). These relationships did
not differ in slope (Wald statistic = 0.456, P = 0.512), but differed in their intercept (Wald statistic = 24.552, P <0.001), so that to support the same leaf area, the species typical of savanna environments had thicker petioles. There was no significant relationship between SLA and petiole thickness and SLA and petiole length (r2 <0.01, P> 0.50).
Physiological parameters
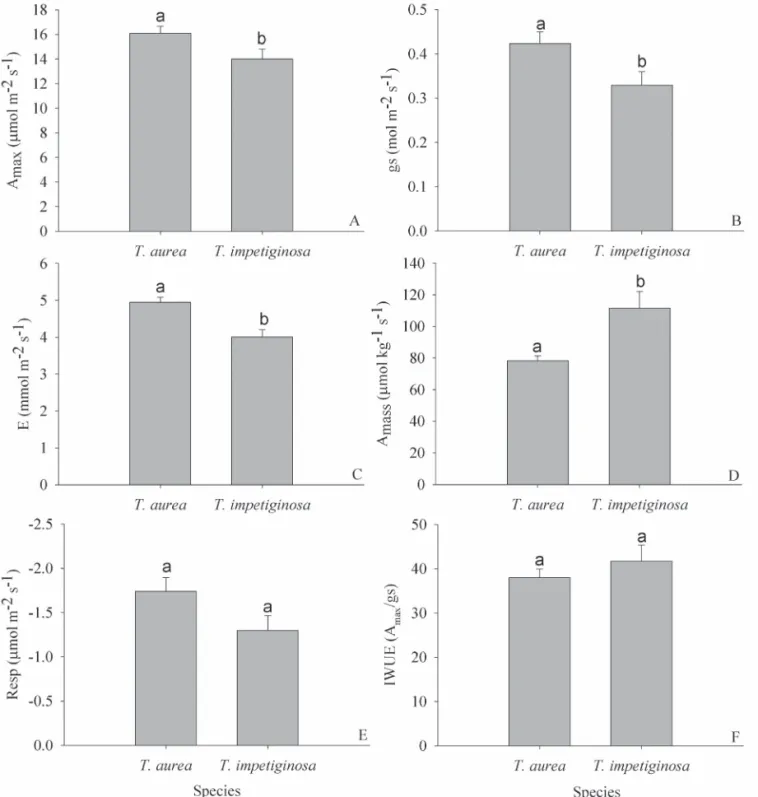
Values of Amax differed significantly between the two spe-cies. Amax averaged 16.10 μmol m-2 s-1 in T. aurea compared
to 14.01 μmol m-2 s-1 in T. impetiginosa (Fig. 2A). There was
a statistically significant difference for the two species in relation to gs (Fig. 2B) and E (Fig. 2C), with higher values for the species typical of savanna, T. aurea. Differences in the degree of stomatal opening between the two species were associated with differences in Amax, as Amax was
lin-Table 1. Leaf morphological parameters of Tabebuia aurea and T. impetiginosa. Different lowercase letters indicate differences between the two species according to Tukey’s test (P < 0.05). Data expressed as mean (± SE).
Morphological parameters Tabebuia aurea Tabebuia impetiginosa
Leaf area (cm²) 403.54 + 32.93 a 318.44 + 29,27 a
Specific leaf area (cm²/g) 48.92 + 2.00 a 78.58 + 5,44 b
Specific leaf mass (g/cm²) 0.0208 + 0.0007 a 0.0132 + 0.0007 b
Leaf blade thickness (mm) 0.538 + 0.0092 a 0.244 + 0.0072 b
Leaf density (g/cm³) 0.3863 + 0.0099 a 0.5413 + 0.0265 b
Petiole thickness (mm) 3.84 + 0.15 a 2.23 + 0.10 b
early related to gs (Fig. 3) in both T. aurea (r2 = 0.688, P =
0.003) and T. impetiginosa (r2 = 0.469, P = 0.029). These
relationships shared the same slope (Wald statistic = 0.21, P = 0.632), but with a displacement of T. aurea in relation
to T. impetiginosa along the same axis of inclination (Wald
statistic = 23.55, P < 0.01).
The forest species showed lower investment in non--photosynthetic leaf tissue producing leaves with higher SLA (Tab. 1). These differences in SLA were reflected in higher Amass for T. impetiginosa in comparison to T. aurea
(Fig. 2D). Both species showed a significant positive linear relationship between SLA and Amass (r2 = 0.401, P = 0.049
for T. aurea and r2 = 0.782, P = 0.001 for T. impetiginosa;
Fig. 4), whose slopes (Wald-statistic = 1.57, P = 0.21) and intercepts (Wald-statistic = 2.73, P = 0.11) did not differ between the two species, but with a displacement of T.
impetiginosa in relation to T. aurea along the same axis of
inclination (Wald-Statistics = 12.40, P = 0.00001).
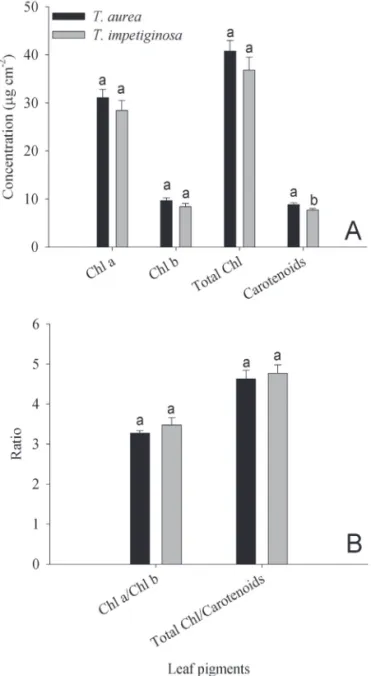
There were no statistical differences between the two species in the values of dark respiration (Fig. 2E) and of intrinsic water use efficiency (Fig. 2F). The analysis of the leaf concentration of photosynthetic pigments also revea-led no differences between the two species in chlorophyll
a, chlorophyll b, total chlorophyll, chlorophyll a:b and chlorophyll:carotenoid ratios (Figs. 5A,B). However, leaf concentration of carotenoids was significantly higher for the savanna species (Fig. 5A). The relationship between Amax and total chlorophyll and between Amax and carotenoid concentrations were not significant.
Discussion
In relation to the savanna species, the forest species had higher SLA, corroborating the studies of Hoffmann et al. (2005) and Rossato et al. (2009a), and thinner leaves. Higher values of SLA can be the product of a proportionally lower investment in
biosynthesis of tissue for support and protection, which would result in a thinner leaf (Grime 1979, Franco et al. 2005). Leaf thickness is higher in species that grow in environments with high incidence of light (Grime 1979, Reich et al. 1999, Dahlgren
et al. 2006), and is usually an effect caused by increased
invest-ment in structures and protective tissues, such as the cuticle and thickened cell walls (Fahn Cutler 1992). This strategy of high investment in these non-photosynthetic structures may serve to reduce the penetration of ultraviolet radiation (Turner 1994). The light environment can also influence other leaf structures, resulting in adjustments in leaf area and in the thickness of photosynthetic tissues (Goulet & Bellefleur 1986). Indeed, higher light intensities induce a thicker palisade parenchyma, and differences in the total number of cells within this tissue (Gratani et al. 2006).
Differences in thickness and size of the petiole between the two species and its correlation with functional variables such as leaf area, suggest that the two species have differ-ent strategies with regard to the capture of ambidiffer-ent light (Poorter & Bongers 2006). So to improve the capture of light, the forest species have invested in thinner leaves with longer and thinner petioles (Poorter 2008), which would provide greater capacity to capture light, when it is subjected to shaded conditions. Longer petioles would reduce aggrega-tion of leaf area around the stem (Tanekaka 1994) and also provide a more optimal placement of the leaves in relation to neighboring leaves of other trees in forest environments (Poorter 2008). The fact that the forest species maintained higher values for these characteristics in the high light conditions where both species were measured, suggests that these traits were selected and remained conserved in the species typical of the forest environment (Ackerly 2009). The savanna species had higher Amax in relation to the forest species, a pattern also found for two congeneric spe-cies of the genus Styrax, one of them of typical forest and the other of savanna (Habermann & Bressan 2011). The values of Amax are within the range reported by Prado et al.
(2004) and Franco et al. (2005) for savanna species, and by Nogueira et al. (2004) for forest species (between 7-23 μmol m-2 s-1). Although the concentration of chlorophyll
often explains differences in photosynthetic capacity among species (Lichtenthaler et al. 2007), this is apparently not the case for the species studied here, since there was no dif-ference in the concentration of these pigments (Fig. 5A), which also showed no significant correlation with Amax. The higher concentrations of carotenoids of the savanna species could contribute to a more efficient regulation of electron transport by the photosystems, as these pigments would act in protective mechanisms against high irradiances (Sims & Gamon 2002). However, this has to be considered with caution because other biochemical and physiological mechanisms of photoprotection are commonly found in plants of environments with high irradiance and carotenoid composition has to be taken into consideration (Gonçalves
et al. 2001, Franco et al. 2007, Lichtenthaler et al. 2007).
Despite the higher Amax of the savanna species, the species of the forest had higher Amass, suggesting a greater capacity and better competition for light in light-limiting conditions (Valladares & Niinemets 2008), even though both species were studied in high irradiance environments. Amass was positively correlated to SLA (Fig. 4). This type of relation has been previously reported for a number of species and environments (Prior et al. 2004, Franco et al. 2005).
The two species had similar dark respiration rates; although the respiration rates of the forest species were
marginally lower (Fig. 2E). This marginal difference would suggest that the leaves of savanna species have a higher metabolic cost, probably linked to a higher thickness of the photosynthetic parenchyma tissue (Dahlgren et al. 2006). Studies of the leaf anatomy of both species coupled with detailed gas exchange measurements are necessary to better evaluate any differences in leaf carbon costs.
Relative to the forest species, Tabebuia aurea showed higher E due to a greater degree of stomatal opening, which suggests greater water transport capacity on a leaf area basis Figure 2. Leaf characteristics related to gas exchange for T. aurea and T. impetiginosa. A- Maximum CO2 assimilation(Amax); B- Stomatal conductance (gs);
C- Transpiration (E); D- Maximum CO2 assimilation on a mass basis (Amass); E- Dark respiration (Resp) and F – Intrinsic water use efficiency (IWUE).
(Gotsch et al. 2010). However, as the savanna species also had higher values of Amax, intrinsic water use efficiency was similar between the two species. Differences in gs and E are not always found between congeneric pairs of savanna and forest species. In fact, Rossato et al. (2009b) measured gs and E in 10 congeneric pairs and found significant differences in only three of these pairs; the savanna species showed higher transpiration in two of them.
The observed differences in the morphological and phy-siological parameters described here revealed a functional distinction between T. aurea and T. impetiginosa, even when exposed to the same environmental determinants. We suggest that such differences could be the result of the evolutionary history of these species, which were exposed to different se-lective pressures in the environments of origin. Thus, higher values of SLA, petiole length and Amass of the forest species are indicative of functional variables evolutionarily shaped to increase the ability to capture light in shaded environments
(Valladares & Niinemets 2008, Rossato et al. 2010, Barros
et al. 2011) and to achieve higher growth rates (Poorter &
Bongers 2006). On the other hand, the higher values of Amax, leaf thickness and carotenoids and lower SLA in the savanna species would be adaptations to nutrient-poor soils (Hari-dasan 1992), high irradiance and dry environments (Turner 1994), which are typical conditions of savannas.
Acknowledgements
The authors thank the Reserva Ecológica do IBGE (Recor) for logistic support and the National Council for Scientific and Technological Development (CNPq) for financial support.
Figure 3. Relationship between stomatal conductance (gs) and maximum CO2
assimilation (Amax). Individual linear regressions were significant for T. aurea
(r2 = 0.688; P = 0.003) and T. impetiginosa (r2 = 0.469; P = 0.029).
Figure 4. Relationship between specific leaf area (SLA) and maximum CO2
assimilation on a mass basis (Amass). Individual linear regressions were significant
for T. aurea (r2 =0.401; P = 0.049) and T. impetiginosa (r2 = 0.782; P = 0.001).
Figure 5. A- Leaf concentrations of photosynthetic pigments for T. aurea e T. impetiginosa. A- Chlorophyll a (Chl a), chlorophyll b (Chl b), total chlorophyll
(Total Chl), and carotenoids. B- Chlorophyll a:b and total chlorophyll:carotenoid
References
Ackerly, D. 2009. Conservatism and diversification of plant functional traits: evolutionary rates versus phylogenetic signal. Proceedings of the National Academy of Sciences 106: 19699-19706.
Barros, F.V.; Goulart, M.F.; Teles, S.B.S.; Lovato, M.B., Valladares, F. & Lemos Filho, J.P. 2011. Phenotypic plasticity to light of two conge-neric trees from contrasting habitats: Brazilian Atlantic Forest versus cerrado (savanna). Plant Biology 14: 208-215.
Dahlgren, J.P.; Eriksson, O.; Bolmgren, K.; Strindell, M. & Ehrlen, J. 2006. Specific leaf area as a superior predictor of changes in field layer abundance during forest sucession. Journal of Vegetation Science 17: 577-582.
Fahn, A. & Cutler, D. 1992. Xerophytes. Berlin, Gebrüder Borntraeger. Felfili, J.M. 1995. Diversity, structure and dynamics of a gallery forest in
Central Brazil. Vegetatio 117: 1-15.
Felfili, J.M.; Franco, A.C.; Fagg, C.W. & Sousa-Silva, J.C. (2001) Desen-volvimento inicial de espécies de Mata de Galeria. Pp. 779-811. In: Ribeiro, J.F.; Fonseca, C.E.L. & Sousa-Silva, J.C (Eds). Cerrado: caracterização e recuperação de Matas de Galeria. Planaltina, Embrapa Cerrados.
Franco, A.C. 2002. Ecophysiology of woody plants. Pp. 178-197. In: Ol-iveira, P.S. & Marquis, R.J. (Eds.). The cerrados of Brazil: ecology and natural history of a Neotropical savanna. New York, Columbia University Press.
Franco, A.C. & Lüttge, U. 2002. Midday depression in savanna trees: coor-dinated adjustments in photochemical, efficiency, photorespiration, CO2 assimilation and water use efficiency. Oecologia 131: 356-365. Franco, A.C.; Matsubara, S. & Orthen, B. 2007. Photoinhibition, carot-enoid composition and the co-regulation of photochemical and non-photochemical quenching in neotropical savanna trees. Tree Physiology 27: 717-725.
Franco, A.C.; Bustamante, M.; Caldas, L.S.; Goldstein, G.; Meinzer, F.C.; Kozovits, A.R.; Rundel, P. & Coradin, V.T.R. 2005. Leaf functional traits of Neotropical savanna trees in relation to seasonal water deficit. Trees 19: 326-335.
Gonçalves, J.F.C., Marenco, R.A. & Vieira, G. 2001. Concentration of photosynthetic pigments and chlorophyll fluorescence of mahogany and tonka bean under two lights environments. Revista Brasileira de Fisiologia Vegetal 13: 149-157.
Gotsch, S.G.; Geiger, E.L.; Franco, A.C.; Goldstein, G.; Meinzer, F.C. & Hoffmann, W.A. 2010. Allocation to leaf area and sapwood area affects water relations of co-occurring savanna and forest trees. Oecologia 163: 291-301.
Goulet, F. & Bellefleur, P. 1986. Leaf morphology plasticity in response to light environment in deciduous tree species and its implication on forest succession. Canadian Journal of Forest Research 16: 1192-1195.
Gratani, L.; Covone, F. & Larcher, W. 2006. Leaf plasticity in response to light of three evergreen species of the Mediterranean maquis. Trees 20: 549-558.
Grime, J.P. 1979. Plant strategies and vegetation process. London, Wiley. Haberman, G. & Bressan, A.C.G. 2011. Root, shoot and leaf traits of the
congeneric Styrax species may explain their distribution patterns in the cerrado sensu lato areas in Brazil. Functional Plant Biology 38: 209-218.
Haridasan, M. 1992. Observations on soils, foliar nutrient concentra-tions and floristic composition of cerrado sensu stricto and cerradão commuities in central Brazil. Pp. 171-184. In: Furley, P.A.; Proctor, A.; Ratter, J.A. (Eds.). Nature and Dynamics of Forest-Savanna Boundaries. London, Chapman and Hall.
Haridasan, M. 2008. Nutritional adaptations of native plants of the cer-rado biome in acid soils. Brazilian Journal of Plant Physiology 20(3): 183-195.
Hoffmann, W.A. & Franco, A.C. 2003. Comparative growth analysis of tropical forest and savanna woody plants using phylogenetically-independent contrasts. Journal of Ecology 91: 475-484.
Hoffmann, W.A. & Franco, A.C. 2008. The importance of evolutionary history in studies of plant physiological ecology: examples from
cerrados and forests of central Brazil. Brazilian Journal of Plant Physiology 20: 247-256.
Hoffmann, W.A.; Orthen, B. & Nascimento, P.K.V. 2003. Comparative fire ecology of tropical savanna and forest trees. Functional Ecol-ogy 17: 720-726.
Hoffmann, W.A.; Franco, A.C.; Moreira, M.Z. & Haridasan, M. 2005. Specific leaf area explains differences in leaf traits between conge-neric savanna and forest trees. Functional Ecology 19: 932-940. Larcher, W. 2000. Ecofisiologia vegetal. 1 ed. São Carlos, Editora Rima. Lemos Filho, J.P.; Gulart, M.F. & Lovato, M.B. 2008. Populational ap-proach in ecophysiological studies: the case of Plathymenia reticulata, a tree from Cerrado and Atlantic Forest. Brazilian Journal of Plant Physiology 20: 205-216.
Lichtenthaler, H.K., Ač, A., Marek, M.V., Kalina, J. & Urban, O. 2007. Differences in pigment composition, photosynthetic rates and chlorophyll fluorescence images of sun and shade leaves of four tree species. Plant Physiology and Biochemistry 45: 577-588. Lorenzi, H. 2002. Árvores Brasileiras. 4 ed. Plantarum, Nova Odessa. Meinzer, F.C.; Goldstein, G.; Franco, A.C.; Bustamante, M.; Igler, E.;
Jackson, O.; Caldas, L. & Rundel, P.W. 1999. Atmospheric and hydraulic limitations on transpiration in Brazilian cerrado woody species.Functional Ecology13: 273-282.
Nogueira, A.; Martinez, C.A.; Ferreira, L.L. & Prado, C.H.B.A. 2004. Photosynthesis and water use efficiency in twenty tropical tree species of differing succession status in a Brazilian reforestation. Photosynthetica 42(3): 351-356.
Oliveira-Filho, A.T. & Ratter, J.A. 2002. Vegetation physiognomies and woody flora of the Cerrado Biome. Pp. 121-140. In: Oliveira, P.S. & Marquis, R.J. (Eds.). The cerrados of Brazil: ecology and natural his-tory of a Neotropical savanna. Columbia, Columbia University Press. Poorter, L. 2008. Leaf traits show different relationships with shade
tolerance in moist versus dry tropical forests. New Phytologist 181: 890-900.
Poorter, L. & Bongers, F. 2006. Leaf traits are good predictors of plant performance across 53 rain forest species. Ecology87: 1733-1743. Prado, C.H.B.A.; Wenhui, Z.; Rojas, M.H.C. & Souza, G.M. 2004.
Sea-sonal leaf gas exchange and water potential in woody cerrado species community. Brazilian Journal of Plant Physiology 16(1): 7-16. Prior, L.D.; Bowman, D.M.J.S. & Eamus, D. 2004. Seasonal differences in
leaf attributes in Australian tropical trees species: family and habitat comparisons. Functional Ecology 18: 707-718.
Reich, P.B.; Ellsworth, D.S.; Walters, M.B.; Vose, J.M.; Gresham, C.; Volin, J.C. & Bowman, W.D. 1999. Generality of leaf traits relationships: a test across six biomes. Ecology 80: 1955-1969.
Ribeiro, J.F. & Walter, B.M.T. 1998 Fitofisionomias do Bioma Cerrado. Pp. 89-166. In:Sano, S.M. & Almeida, S.P. (Eds.). Cerrado: ambiente e flora Brasília, Embrapa/CPAC.
Ribeiro, J.F. & Walter, B.M.T. 2001. As matas de galeria no contexto do Bioma Cerrado. Pp. 29-47. In: Ribeiro, J.F.; Fonseca, C.E.L. & Sousa-Silva, J.C. (Orgs.). Cerrado: caracterização e recuperação de matas de galeria. Planaltina, Embrapa.
Rossatto, D.R.; Hoffmann, W.A. & Franco, A.C. 2009a. Differences in growth patterns between co-occurring forest and savanna trees af-fect the forest-savanna boundary. Functional Ecology 23: 689-698. Rossatto, D.R.; Hoffmann, W.A. & Franco, A.C. 2009b. Características
estomáticas de pares congenéricos de cerrado e mata de galeria cre-scendo numa região transicional no Brasil Central. Acta Botanica Brasilica 23: 499-508.
Rossatto, D.R.; Takahashi, F.S.C.; Silva, L.C. & Franco, A.C. 2010. Cara-cterísticas funcionais de folhas de sol e sombra de espécies arbóreas em uma mata de galeria no Distrito Federal, Brasil. Acta Botanica Brasilica 24(3): 640-647.
Silva, L.C.R.; Sternberg, L.; Haridasan, M., Hoffmann, W. A., Miralles-Wilhelm, F. & Franco, A.C. 2008. Expansion of gallery forests into central Brazilian savannas. Global Change Biology14: 2108-2118. Sims, D.A. & Gamon, J.A. 2002. Relationships between leaf pigment
Tanekaka, A. 1994. Effects of leaf blade narrowness and petiole length on the light capture efficiency of a shoot. Ecological Research 9: 109-114. Turner, I.M. 1994. Sclerophylly: primarily protective? Functional
Ecol-ogy 8: 669-675.
Valladares, F. & Niinemets, U. 2008. Shade tolerance, a key plant feature of complex nature and consequences. Annual Review of Ecology and Systematics 39: 237-257.
Warton, D.I.; Wright, I.J.; Falster, D.S. & Westoby, D. 2006. Bivariate line-fitting methods for allometry. Biological Reviews 81: 269-291. Wellburn, A.R. 1994. The spectral determination of Chlorophylls a and b, as
well as total carotenoids, using various solvents with spectrophotom-eters of different resolution. Journal of Plant Physiology 144: 307-313. Wright, I.J. & Westoby, M. 2002. Leaves at low versus high rainfall: coordina-tion of structure, lifespan and physiology. New Phytologist 155: 403-416.