BIOMEDICAL SCIENCES
AND
CLINICAL INVESTIGATION
www.bjournal.com.br
www.bjournal.com.br
Faculdade de Medicina Campus
Ribeirão Preto
Institutional Sponsors
The Brazilian Journal of Medical and Biological Research is partially financed by
Hotsite of proteomics metabolomics developped by:
Braz J Med Biol Res, November 2010, Volume 43(11) 1062-1075
An improved strategy for evaluating the extent of chronic arterial
baroreceptor denervation in conscious rats
M. Rodríguez-Martínez, M.L. Torres-Rodríguez, M.D. Brito-Orta, J.F. López-Rodríguez,
A.S. Rodríguez-Pérez, M.Z. Calvo-Turrubiartes and L. Llamazares-Azuara
An improved strategy for evaluating the extent
of chronic arterial baroreceptor denervation
in conscious rats
M. Rodríguez-Martínez, M.L. Torres-Rodríguez, M.D. Brito-Orta, J.F. López-Rodríguez,
A.S. Rodríguez-Pérez, M.Z. Calvo-Turrubiartes and L. Llamazares-Azuara
Integrative Physiology Laboratory, Department of Physiology, Faculty of Medicine, Autonomous University of San Luis Potosí, San Luis Potosí, México
Abstract
There is no index or criterion of aortic barodenervation, nor can we differentiate among rats that have suffered chronic sham, aortic or sino-aortic denervation. The objective of this study was to develop a procedure to generate at least one quantitative, reproducible and validated index that precisely evaluates the extent of chronic arterial barodenervation performed in conscious rats. Data from 79 conscious male Wistar rats of about 65-70 days of age with diverse extents of chronic arterial barodenerva-tion and used in previous experiments were reanalyzed. The mean arterial pressure (MAP) and the heart rate (HR) of all rats were measured systematically before (over 1 h) and after three consecutive iv bolus injections of phenylephrine (PHE) and sodium nitroprusside (SNP). Four expressions of the effectiveness of barodenervation (MAP lability, PHE ratio, SNP ratio, and SNP-PHE slope) were assessed with linear fixed models, three-level average variance, average separation among levels, outlier box plot analysis, and overlapping graphic analysis. The analysis indicated that a) neither MAP lability nor SNP-PHE slope was affected by the level of chronic sodium intake; b) even though the Box-Cox transformations of both MAP lability [transformed lability index (TLI)] and SNP-PHE slope [transformed general sensitivity index (TGSI), {(((3-(ΔHRSNP-ΔHRPHE/ ΔMAPSNP-ΔMAPPHE))-0.4)-1)/-0.04597}] could be two promising indexes, TGSI proved to be the best index; c) TLI and TGSI
were not freely interchangeable indexes for this purpose. TGSI ranges that permit differentiation between sham (10.09 to 11.46), aortic (8.40 to 9.94) and sino-aortic (7.68 to 8.24) barodenervated conscious rats were defined.
Key words: Aortic denervation; Sinoaortic denervation; Effectiveness of barodenervation
Introduction
Correspondence: M. Rodríguez-Martínez, Department of Physiology, Faculty of Medicine, Universidad Autónoma de San Luis Potosí, Av. V. Carranza, 2405, Bellas Lomas, 78210 San Luis Potosí, México. E-mail: [email protected]
Received February 20, 2010. Accepted September 13, 2010. Available online October 1, 2010. Published November 12, 2010. Although arterial baroreflexes play an important role in
the short-term regulation of blood pressure, their role in the long-term regulation of blood pressure is still debated (1). However, it is clear that chronic total or partial functional
deficit in these reflexes (baroreflex dysfunction) causes
increased variability in blood pressure although the absolute value of mean arterial pressure (MAP) measured on a long-term basis may not change (2-4). Since there is a greater likelihood that humans (and other vertebrates) will suffer
partial baroreflex dysfunction rather than total baroreflex
dysfunction (5), then, pathophysiologically speaking it is perhaps more relevant to study the long-term consequences
of partial baroreflex dysfunction and its direct or indirect
impact on the long-term regulation of blood pressure. One approach to the study of these last two aspects has been
to examine the effects of different extents of surgical baro-denervation, sham denervation (SHM), aortic denervation (AD), and sinoaortic denervation (SAD). However, so far there is no index or criterion of AD, nor a general index or
criterion that allows identification of rats that have suffered
SHM, AD, or SAD.
Experimentally, two basic quantitative methods have been used to assess the effectiveness of barodenervation
in conscious rats. One is the sensitivity of the baroreflex
control of heart rate (HR), which is also called cardiac
baroreflex sensitivity (BRS). The other is the lability of MAP
pharmacological or standard method), or by analysis of
spontaneous fluctuations in blood pressure and pulse inter -val with time or frequency-domain methods (6). However, in
intact conscious rats, the reported correlation coefficients
for BRS between Oxford and sequential time-series meth-ods or between Oxford and spectral analysis methmeth-ods are lower than expected (r = 0.787 and 0.4, respectively), and the agreement in estimates of BRS between Oxford and spontaneous methods is poor (6).
These findings encouraged us to focus on the Oxford
and MAP lability methods in order to develop a valid index of the effectiveness of barodenervation that would be ap-plicable at any level of barodenervation. In 1990, Osborn and England (2) used these two methods in conscious Sprague-Dawley rats 5 days after SHM, AD, and SAD, and
statistically documented significant differences between the
three levels of barodenervation; however, some overlap among levels was apparent. Subsequently, Franchini and Krieger (3), using small variants of both methods, reported results that were consistent with the study cited above in conscious Wistar rats with semi-acute (24 h) but not chronic (20 days) barodenervation (at the three levels). In the chronic setting, they could not demonstrate differences between AD and SAD. Subsequent studies (4,7-18) using variants of either or both of these methods only showed differences between rats with SHM and SAD or between rats with SHM and AD (19-22). Nevertheless, none of the studies mentioned above formally evaluated both methods on an individual conscious rat basis as tools to assess the effectiveness of barodenervation; moreover, there has been no formal comparison to identify which method was the best to use for this purpose.
Thus, the objectives of the present study were: a) to develop an operative-analytical procedure to generate one or more quantitative, reproducible and valid indexes that would allow a precise evaluation, in any given conscious rat, of the extent of chronic arterial barodenervation performed, b) to evaluate the effect of high and low sodium diets on these indexes, and c) to compare the indexes obtained and to determine whether they are truly interchangeable.
Material and Methods
Data from two distinct studies (A: N = 37 and B: N = 42, N = 79) performed on male Wistar rats (Charles River, USA) 1 year apart by two expert technicians were reana-lyzed. All experimental procedures were in accordance with the UASLP Medical School Bioethics Committee and the Mexican Guidelines for the Care and Use of Experimental Animals (NOM-062-Z00-1999).
Comparison of methods for the evaluation of effectiveness of barodenervation
In study A (SHM = 21, SAD = 16) and study B (SHM = 22, AD = 20), rats weighing about 100-150 g were housed
individually in the animal care facility (12-h light-dark au-tomatic cycle, controlled temperature (21°C) and humidity (45%)), with free access to standard solid diet (Lab Diet 5P14, PMI Nutrition International, USA; 0.4% Na) and tap water. In both studies, once they reached 200 g body weight, the rats were randomly subjected to one of three kinds of barodenervation (SHM, AD, or SAD). Thereafter, rats con-tinued to receive the same diet until they recovered their pre-denervation weight (~2-9 days depending on the level of barodenervation). The rats were then randomly allocated to a high sodium diet (HNa; 8% Na (TD92012, Harlan-Teklad, USA) plus tap water) or a low sodium diet (LNa; 0.04% Na (TD90228, Harlan-Teklad) plus distilled water) for 21 days, so that six groups of rats were initially studied.
Barodenervation procedure
Rats under ip anesthesia with ketamine and xylazine (Anesket and Rompun; 33.3 and 6.7 mg/kg; Pisa and Bayer, Mexico, respectively) plus ip atropine (0.05 mg/kg, Atropisa, Mexico) were subjected to aseptic chronic bilat-eral arterial barodenervation as described by Krieger (23). Under microscope visualization (X25), aortic baroreceptors were denervated (AD) by removal of a 1-cm segment of the cervical sympathetic trunk, section of the superior laryngeal nerve at its origin in the nodose ganglion, and resection of all the tissue surrounding the vagus nerve. SAD was performed, in addition, by stripping the area of the carotid
bifurcation, including the carotid branches of neural fibers,
the carotid chemoreceptors and connective tissue, and painting the area with 10% phenol-ethanol. SHM denerva-tion consisted of a similar surgical exposure but without the sectioning of any neural or vascular structure and lasted 15-40 min. After denervation, each rat received ~180,000 IU penicillin G benzathine (im), 500 mg/kg body weight dipyrone (sc), and heat until they became conscious. The rats were returned to the animal care facility where they had free access to a normal sodium diet until they recovered their pre-denervation weight.
Blood pressure and heart rate measurements of conscious rats
After 21 days on the high or low sodium diet and under brief ether anesthesia (~10 min), the rats were equipped with catheters in the left femoral artery and vein. Once the rats regained consciousness (on average 5-10 min after halting ether anesthesia), they were placed in a well-ventilated non-restrictive rat holder. After at least 30 min of stabilization, blood pressure was recorded via a P23 XL transducer (Gould, USA) coupled to Grass polygraphs via
HP-Vee software (Hewlett-Packard Co., USA). After 1 h of continuous and simultaneous recordings of MAP and HR and at least 100 min after the termination of ether anesthesia, the response (lasting ~4 min) to three 100-µL bolus injections of phenylephrine (PHE, 10 µg/kg, iv) at 10-min intervals was recorded after 1 min of control recording. Subsequently, the same protocol was repeated but with three 100-µL bolus injections of sodium nitroprusside (SNP, 5 µg/kg, iv), with 6 min for recuperation between injections.
The effectiveness of barodenervation was evaluated in two ways: i) by the assessment of MAP lability, and ii) by the assessment of the BRS. MAP lability was measured as the standard deviation of the MAP recordings made in conscious rats (7200 samples) for 1 h. The BRS was obtained by determining the response of HR to acute in-creases and dein-creases of MAP in the conscious state. The
average of steady peak changes of MAP (ΔMAP) and HR (ΔHR) observed with three consecutive bolus injections of
PHE and three of SNP was calculated for each rat, yielding
four values: ΔHRPHE, ΔHRSNP, ΔMAPPHE, and ΔMAPSNP. Special care was taken to ensure that the bolus injections were not given until the MAP was stable. Three expressions
of BRS were generated: the common PHE ratio = ΔHRPHE/
ΔMAPPHE and SNP ratio = ΔHRSNP/ΔMAPSNP, but in addi-tion, the SNP-PHE slope. The latter was calculated as the
mathematical slope [(y2 - y1 / x2 - x1) = (ΔHRSNP-ΔHRPHE/
ΔMAPSNP-ΔMAPPHE)] of a straight line that passes through
two points because it was necessary to take into account
both directions of the linear part of the baroreflex action in
a unique formal expression easy to calculate.
Statistical analysis
The data were modeled by linear fixed models (95%CI)
for the study factor (2 levels: studies A and B), the baro-denervation factor (3 levels: SHM, AD, SAD), the diet fac-tor (2 levels: HNa and LNa), and their interactions, after testing the residuals for normality (Shapiro-Wilk test) and homoscedasticity (Brown-Forsythe test) (24). The best models were chosen on the basis of the highest adjusted r2 (r2 adj.), the lowest Akaike information criterion (AIC)
(25) and the principle of parsimony. On the basis of the modeling results, classical parametric tests for independent and non-independent samples were used after testing the residuals for normality and homoscedasticity. To adhere to the assumptions of parametric statistics and to reduce the variance of the data at each level of barodenervation, the data underwent a Box-Cox transformation (26); otherwise, nonparametric statistical tests were used. An outlier box plot analysis (27) and an overlapping graphic analysis were applied to the Box-Cox transformed values in order to eliminate, at the three levels of barodenervation, either extreme values or edge overlapping values among them, respectively (see Appendix A of the Supplemental material). Data are reported as means ± SEM, and were analyzed using the JMP V.5.01 software (SAS Institute, USA).
To determine which of the four expressions of effective-ness of barodenervation would be used in the remainder of
the analysis, the one that fulfilled most of the following four
criteria obtained before and after experiment elimination, was chosen: 1) before: a) the lowest value of the average variance of the three levels of barodenervation (three-level average variance), b) the highest value of the average separation between the levels of barodenervation,
calcu-lated as Σ [grand mean - SHM mean + grand mean - AD mean + grand mean - SAD mean] / 3; 2) after: c) the lowest
number of experiments eliminated after both an outlier box plot analysis and overlapping graphic analysis, and (d) the greatest adjusted r2 (determination coefficient).
Results
The raw data of the four expressions of effectiveness of barodenervation (MAP lability, PHE ratio, SNP ratio, SNP-PHE slope) for the six groups of rats with SHM, AD, and SAD on high and low sodium diets (N = 79) are shown in Table 1 (see Before Elimination columns). It was apparent that at the three levels of barodenervation and indepen-dently of the level of dietary sodium, PHE administration
elicited similar changes in MAP (ΔMAP), whereas SNP
administration brought about greater changes in this variable according to the extent of barodenervation. In contrast, the
HR responses (ΔHR) consecutive to MAP changes induced
by PHE were greater than those induced by SNP. As a
consequence, the PHE ratio was significantly greater than
the SNP ratio at the SHM and AD barodenervation levels but not at the SAD level.
The initial modeling and subsequent bivariate analysis
of the four expressions indicated only the influence of the
denervation factor, but not of the study factor, diet factor or their interactions, so that the data for the six groups were pooled into three groups for each of the four expressions of the effectiveness of barodenervation. Next, these data were used to obtain the three-level average variance and the average separation between the levels of barodenervation (Table 2, columns A and B). Subsequently, an outlier box plot analysis as well as an overlapping graphic analysis were applied to the Box-Cox transformed data, so that, with respect to MAP lability, PHE ratio, SNP ratio, and SNP-PHE slope expressions, 15, 18, 21, and 11 experiments were eliminated, respectively (Table 2, column C) and,
therefore, each expression was finally represented by 64,
61, 58, and 68 experiments, respectively (Table 2, column n1). The complete modeling process for MAP lability and SNP-PHE slope expression can be seen in Appendix A in the Supplemental material.
MAP lability
The raw data from the 64 experiments retained for MAP
lability were reanalyzed. MAP lability differed significantly
(2.85 ± 0.10, N = 37) to the AD level (5.48 ± 0.25, N = 16)
and to the SAD level (13.71 ± 1.48, N = 11). The final
Box-Cox transformation of the MAP lability data, called trans-formed lability index (TLI) was: TLI = {((SD of MAP-0.4)-1) /
-0.038002}. The upper panel in Table 3 shows a summary of the statistics of the TLI at each level of barodenervation. The Box-Cox transformation of this variable improved the ability to discriminate between levels, reduced the variance at each level of denervation, and was able to homogenize the variances.
Selection of the best expression of BRS
The raw data from 61, 58, and 68 experiments retained for every expression of BRS (PHE ratio, SNP ratio, SNP-PHE slope, respectively) were remodeled for the dener-vation factor, after subjecting them to one last Box-Cox transformation. Columns A, B, C, and D in Table 2 show the results of the four criteria (see Material and Methods) used to choose the best expression for BRS. Before the elimination of outlying and overlapping experiments, the SNP-PHE slope showed the lowest three-level average
Table 1. Lability of MAP and cardiac baroreflex response to iv PHE and SNP in conscious rats at three levels of barodenervation, before elimination (N = 79) and after elimination of experiments when only the transformed SNP-PHE slope criterion was considered (N = 68).
SHM AD SAD
LNa HNa LNa HNa LNa HNa
Before elimination
N 21 22 10 10 7 9
Lability of MAP (mmHg) 2.82 ± 0.16 3.37 ± 0.19 4.90 ± 0.60° 5.64 ± 0.34° 11.32 ± 2.42#♦ 13.70 ± 1.9#♦
ΔMAPPHE (mmHg) 36 ± 2 37 ± 1 43 ± 2 42 ± 3 40 ± 5 37 ± 4
ΔHRPHE (bpm) -115 ± 5 -115 ± 10 -63 ± 12° -79 ± 16° -8 ± 3°* -10 ± 3°* PHE ratio (bpm/mmHg) -3.25 ± 0.15 -3.11 ± 0.3 -1.46 ± 0.30* -2.11 ± 0.48° -0.19 ± 0.08#♦ -0.32 ± 0.09#♦ ΔMAPSNP (mmHg) -25 ± 1 -25 ± 1 -40 ± 3° -47 ± 2° -56 ± 3° -60 ± 3°*
ΔHRSNP (bpm) 48 ± 5 42 ± 5 16 ± 3° 15 ± 2° 12 ± 3° 5 ± 8°
SNP ratio (bpm/mmHg) -1.91 ± 0.21¢ -1.71 ± 0.19¢ -0.44 ± 0.09°¢ -0.33 ± 0.06°¢ -0.22 ± 0.09° -0.11 ± 0.13° SNP-PHE slope -2.68 ± 0.08 -2.58 ± 0.14 -0.96 ± 0.15° -1.12 ± 0.22° -0.21 ± 0.05°♦ -0.19 ± 0.09°♦
Average of ratios -2.58 -2.41 -0.95 -1.22 -0.20 -0.21
SHM AD SAD
After elimination
N 41
37 ± 1 -114 ± 5 -3.13 ± 0.12
-25 ± 1 45 ± 4 -1.81 ± 0.14¢ -2.61 ± 0.07 -3.49 to -1.75
-2.47
15 43 ± 2 -65 ± 8° -1.56 ± 0.21§
-40 ± 2° 16 ± 2° -0.43 ± 0.07§¢ -0.97 ± 0.11§ -1.60 to -0.39
-0.99
12 39 ± 4
-8 ± 3°* -0.25 ± 0.08§
-59 ± 2°* 8 ± 2°* -0.14 ± 0.04£♦
0.17 ± 0.02£¤ -0.28 to 0.26
-0.19 ΔMAPPHE (mmHg)
ΔHRPHE (bpm) PHE ratio
ΔMAPSNP (mmHg) ΔHRSNP (bpm) SNP ratio SNP-PHE slope
Range of SNP-PHE slope Average of ratios
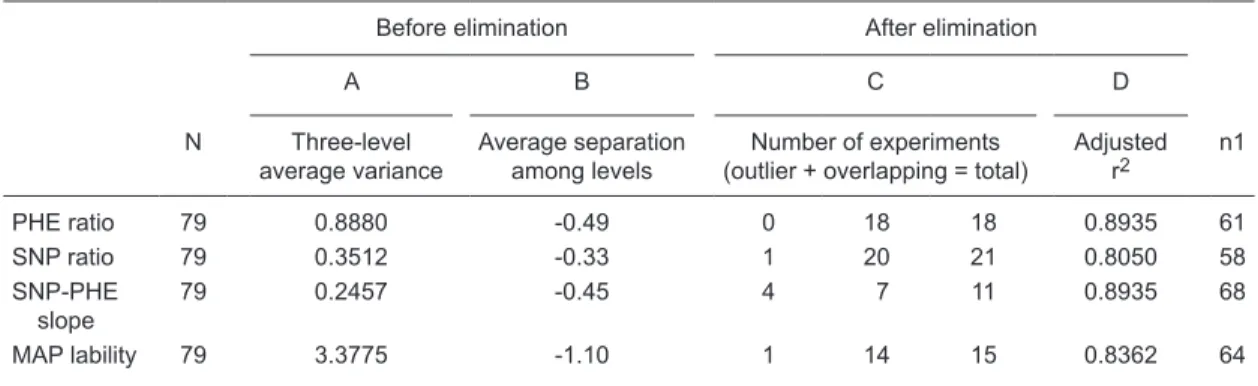
variance (0.2457) and an intermediate separation among the levels of denervation (-0.45). Moreover, after the elimina-tion of outlying and overlapping experiments, the SNP-PHE slope showed the highest adjusted r2 (0.8935), similar to
that shown by the PHE ratio, and the lowest number of experiments eliminated (11), so that the SNP-PHE slope
fulfilled all criteria except the second, and therefore was
considered to be the best expression for BRS.
SNP-PHE slope
Since the SNP-PHE slopes were calculated from the
raw changes in MAP (ΔMAP) and in HR (ΔHR) induced by
SNP and PHE at each level of barodenervation in the 68 experiments retained for the SNP-PHE slope, these raw changes were reanalyzed (see After Elimination columns in Table 1 and Figure 1). Baseline HR was 457 ± 7 bpm at the SHM level, 511 ± 7 bpm at the AD level, and 453 ± 10 bpm
at the SAD level. Once again the PHE ratio was significantly
greater than the SNP ratio at the SHM and AD levels of barodenervation but not at the SAD level. To further validate the use of the SNP-PHE slope as an expression for BRS, the raw changes in MAP and HR induced by SNP and PHE at each level of barodenervation were plotted and subjected to regression analysis (Figure 1). The resultant regression
Table 2. Results of the four selection criteria used for choosing the best method to evaluate the effectiveness of baro-denervation.
Before elimination After elimination
A B C D
N Three-level average variance
Average separation among levels
Number of experiments
(outlier + overlapping = total) Adjusted r2 n1
PHE ratio 79 0.8880 -0.49 0 18 18 0.8935 61
SNP ratio 79 0.3512 -0.33 1 20 21 0.8050 58
SNP-PHE slope
79 0.2457 -0.45 4 7 11 0.8935 68
MAP lability 79 3.3775 -1.10 1 14 15 0.8362 64
PHE = phenylephrine; SNP = sodium nitroprusside; PHE ratio, SNP ratio, SNP-PHE slope were three different expres-sions of cardiac baroreflex sensitivity (BRS). The standard deviation of the continuous mean arterial pressure (MAP) recordings over 1 h was the expression of the lability of MAP used. N = initial number of experiments; n1 = final number of experiments. Before elimination (A, B) means that criteria were obtained from 79 experiments, whereas After elimina-tion (C, D) means that criteria were obtained after eliminaelimina-tion of experiments by outlier and overlapping analyses. See Material and Methods for definitions of the criteria used.
Table 3. Mean, SD, SEM, 95%CI, minimum and maximum values of both transformed lability index and transformed general sensitivity index at sham (SHM), aortic (AD) and sinoaortic (SAD) levels of bilateral denervation in Wistar rats.
N Mean SD SEM 95%CI Minimum Maximum
Transformed lability index (TLI)
SHM 37 8.77 1.55 0.25 8.25/9.29 5.65 11.40
AD 16 12.87* 0.97 0.24 12.36/13.39 11.60 14.54
SAD 11 16.82**°° 1.17 0.35 16.03/17.61 15.72 18.89
Transformed general sensitivity index (TGSI)
SHM 41 10.28 0.35 0.05 10.71/10.93 10.09 11.46
AD 15 9.18° 0.56 0.14 8.87/9.49 8.40 9.94
SAD 12 8.03°°+ 0.17 0.05 7.93/8.14 7.68 8.24
slopes were dependent on the level of barodenervation (SHM = -2.55, AD = -0.92, and SAD = -0.15 bpm/mmHg) and their explained variations (r2) and correlation coefficients
decreased progressively (90.5, 71.3 and 47%, and 0.95, 0.84, and 0.68 for SHM, AD, and SAD, respectively). The regression slopes obtained at each level of barodenervation were essentially equal to the calculated SNP-PHE slopes: SHM = -2.61 ± 0.07, AD = -0.97 ± 0.11 and SAD = -0.17 ± 0.02 (see After Elimination columns in Table 1).
The best model for the SNP-PHE slope data from the 68 retained experiments was obtained as a product of the aforementioned remodeling by the denervation
fac-tor. The final Box-Cox transformation of the SNP-PHE
slope data, called transformed general sensitivity index
(TGSI) was: TGSI = {(((3-(ΔHRSNP-ΔHRPHE/ΔMAPSNP
-ΔMAPPHE))-0.4)-1)/-0.04597}. The lower panel in Table 3 shows the summary statistics of TGSI at each level of denervation and Figure 2 shows the comparison of means ± SEM, minimum and maximum values of the SNP-PHE slope with the corresponding TGSI at each level of baro-denervation. It is apparent that the Box-Cox transforma-tion of the SNP-PHE slope (TGSI) improved the ability to discriminate among the levels and minimized the variance of each one, although it was unable to homogenize these small variances.
Discussion
The major findings of the present study were that: a)
the TGSI was a better index than the TLI for evaluating quantitatively the effectiveness of several levels of baro-denervation in conscious rats. In other words, the TGSI al-lowed differentiation among conscious rats that had suffered chronic sham, aortic or sinoaortic denervation; b) although
TGSI and TLI are improved indexes of cardiac baroreflex
sensitivity and MAP lability, respectively, they were not freely interchangeable for the purpose of evaluating the effectiveness of barodenervation; c) neither MAP lability nor SNP-PHE slope or their Box-Cox transformations were affected by the level of chronic sodium intake.
Although the Oxford method is not free of problems (28), many investigators (7,11,14,16,18) have used the
mean peak of ΔHR and ΔMAP obtained with fixed PHE and SNP doses (or with fixed PHE doses alone) and calcu
-lated the ΔHR/ΔMAP ratio (BRS) separately for each drug. Schreihofer et al. (14,16), using this methodology, defined
the BRS criterion to identify, on an individual basis, which rats suffer total or partial SAD. In contrast, other investiga-tors (10) have performed separate PHE and SNP ramps or bolus injections of progressive doses of PHE and SNP in each rat and have obtained the slope of the regression
equation relating ΔHR to ΔMAP for each drug, thus defining
the group BRS for each component. One exception to this is the study of Osborn and England (2), in which the slope
of the regression line was calculated taking the ΔMAP and
Figure 1. The level of barodenervation changes the ΔHR versus ΔMAP relationship. Scatter plot of changes in heart rate (ΔHR) versus changes in mean arterial pressure (ΔMAP) induced by iv
ΔHR of both PHE and SNP into account, so as to define
the group BRS.
As mentioned in Results, of the three expressions of BRS assessed (PHE ratio, SNP ratio and SNP-PHE slope) SNP-PHE slope was considered the best (see Table 2),
be-cause it fulfilled all except the second established criterion.
Thus, these results indicate that it is more appropriate to use the raw SNP-PHE slope or ideally its transformation (TGSI) than the raw or transformed PHE ratio or SNP ratio
as an isolated criterion to define the effectiveness of baro
-denervation in any given rat. When raw ΔMAP and ΔHR
data derived from retained SNP-PHE slope experiments (N = 68) were subjected to regression analysis (Figure 1) for further validating the SNP-PHE slope as an expression of BRS, regression slopes and the calculated SNP-PHE slopes were similar at the three levels of barodenervation. Unexpectedly, our SNP-PHE slopes calculated for ~30-day post-denervation conscious male Wistar rats (SHM = -2.61 ± 0.07; AD = -0.97 ± 0.11; SAD: -0.17 ± 0.03 bpm/ mmHg) were very similar to the regression slopes obtained by Osborn and England (2) from 5-day post-denervation conscious male Sprague-Dawley rats (SHM = -2.31, AD = -0.80 and SAD = -0.2 bpm/mmHg), though their
correla-tion coefficients were slightly lower (0.94, 0.76 and 0.36,
respectively) than ours, very likely because they did not perform a prior outlier box plot analysis and overlapping graphic analysis.
Despite the coincidence of the slope values between the two studies, in the present one the SNP ratio (-1.8 ±
0.14 bpm/mmHg) was significantly lower than the PHE ratio
(-3.13 ± 0.12 bpm/mmHg) at the SHM level of barodenerva-tion, in contrast to what can be inferred from the analysis
of the first figure of Osborn and England’s paper (2) (SNP
ratio: -2.70 ± 0.4 vs PHE ratio: -2.16 ± 0.4) at the same level of barodenervation but also opposite with respect to that reported by Bedran-de-Castro et al. (29) (SNP: -3.8 ± 0.5 vs PHE: -2.2 ± 0.3 bpm/mmHg) and Farah et al. (30) (SNP: -3.9 ± 0.8 vs PHE: -1.8 ± 0.3 bpm/mmHg) for Wistar rats with intact baroreceptors 24 h after halting ether or ketamine/xylazine anesthesia, respectively. A fact worth mentioning was that, in the present study, this inversion of ratios was inversely proportional to the extent of the performed barodenervation, being maximal at the SHM level, intermediate at the AD level, and essentially null at the SAD level of barodenervation.
Even though we do not have an explanation, this could be the result of a residual effect of a very short ether an-esthesia observable 100 min after halting the drug. It has been reported that ether administration for 30 min increases catecholamine concentrations for about 4 h (31), counteract-ing the heart depressant effect of this drug and maintaincounteract-ing the blood pressure at near-normal levels, without increas-ing the baseline HR as observed in the present study. On the other hand, such an inversion could be the result of stressful postoperative conditions, which might increase
the baseline HR. Although speculative, the latter could enhance the bradycardic response to PHE administration (resulting inan increased PHE ratio) but could also attenuate the tachycardic response to SNP administration (causing a decreased SNP ratio) and thus explain the observed
inversion of ratios. Since all studies on intact baroreceptor conscious rats that have reported SNP and PHE ratios or slopes (2,10,18,24,30) have demonstrated greater SNP ratios than PHE ratios independently of rat strain, of type of anesthesia used, or of the time after halting anesthesia, the inversion of ratios in the present study strongly suggests the existence of an interaction between rat strain phenotype (or source rat strain phenotype) and either the residual effect of ether anesthesia or stressful postoperative conditions. In our opinion and as discussed above, the latter option is more likely than the former.
In support of this contention are the results of experi-ments performed in our laboratory using intact barorecep-tor conscious Wistar rats provided by a different supplier (Harlan, Mexico, instead of Charles River, USA), which did
not show statistically significant differences between SNP
ratio and PHE ratio at 100 min, 4 h and 6 h after halting ether anesthesia, even though the PHE ratio tended to be slightly higher than the SNP ratio (see Appendix B in the Supplemental material). Whatever the cause of the inver-sion, what is really important is that neither the calculation nor the capacity of the SNP-PHE slope (or its transformation) to evaluate correctly the effectiveness of barodenervation was affected by the inversion of ratios. Otherwise, it would
have been unlikely to find the coincidence of slopes at
the three levels of barodenervation between the present study and the study of Osborn and England (2). Finally, it is necessary to note that, if instead of an overlapping graphic analysis (less wide than twice the standard deviation and given by the minimum and maximum values in Table 3)
the 95% confidence interval (Table 3) were used to define
which experiments would be retained at each level of barodenervation, the consequence, at least regarding the SNP-PHE slope, would have been a huge reduction in the number of retained experiments (from 68 to 15; SHM = 5, AD = 4, SAD = 6).
The modeling of MAP lability (N = 79) showed the
in-fluence of the barodenervation factor, but not of the study
or sodium diet factors, corroborating earlier observations (2,12). SNP-PHE slope expression was considered better than MAP lability expression for evaluating the effective-ness of barodenervation because, comparatively, the former
expression fulfilled three of the four criteria mentioned in
Methods (Table 2). Moreover, the acceptance and
elimina-tion coefficients were 86 and 14% for TGSI and 81 and
19% for TLI, respectively, and, except for three cases, the experiments eliminated by each index were different. Furthermore, the twelve experiments eliminated by the TLI fell well within the operative range of the TGSI. Taken together, all of these elements indicate that TGSI and TLI are not freely interchangeable indexes for evaluating the effectiveness of barodenervation and that the practice of
using MAP lability as a single criterion for this purpose should be considered with caution. On the other hand, our results also show that TGSI was not affected by the level of chronic sodium intake or by the participation of different expert technicians at different times. Further validation of TGSI as well as its implementation can be found in Appen-dices C, D and E of the Supplemental material.
To know precisely the extent of barodenervation that has been performed in a given conscious animal is not a trivial issue. Schreihofer and Sved (14,15) demonstrated
at least five functional differences (including MAP lability) between SAD rats whose arterial baroreflex was totally (ΔHR = zero or <10 bpm) or partially abolished. In this
respect, in the present study, where 12 rats were ac-cepted (by TGSI) to be at this level of barodenervation,
50% fulfilled the above criterion (14,15) for a total SAD
and their respective TGSI values were in the range of 7.68 to 8.03. The remaining 50% could be considered to have a partial SAD, with their TGSI ranging from 8.09 to 8.24. On the other hand, several early studies (32-35) focused on the cardiovascular and neural effects of AD (a form of partial barodenervation) in rats. However, the lack of any individual test for the extent of barodenervation
makes it difficult to derive valid conclusions from these
studies. It is important to state that TGSI, like any other index of cardiac BRS, has the limitation of being unable
to measure the baroreflex control of vascular resistance.
However, this fact does not invalidate its use as an index of the effectiveness of barodenervation.
In summary, the Box-Cox transformation of the SNP-PHE slope (TGSI) is a valid, robust, quantitative, reproducible, and practical index for measuring the extent of barodenervation performed or the effectiveness of barodenervation in con-scious rats. In other words, it indicates the residual functional
level of baroreflex control of HR after different extents of
functional or surgical barodenervation. The present study contributes to a valuable operative-analytical procedure from which the TGSI was derived. This index may be useful in the future to study with certainty the pathological consequences not only of total and partial chronic SAD, but also of chronic AD for cardiovascular physiology. We have recently published (36) preliminary evidence that just chronic AD, as assessed by the TGSI, plus a high sodium diet induces salt-sensitive hypertension.
Acknowledgments
References
1. Osborn JW, Averina VA, Fink GD. Current computational models do not reveal the importance of the nervous system in long-term control of arterial pressure. Exp Physiol 2009; 94: 389-396.
2. Osborn JW, England SK. Normalization of arterial pressure after barodenervation: role of pressure natriuresis. Am J Physiol 1990; 259: R1172-R1180.
3. Franchini KG, Krieger EM. Carotid chemoreceptors influ -ence arterial pressure in intact and aortic-denervated rats.
Am J Physiol 1992; 262: R677-R683.
4. Van Vliet BN, Chafe LL, Montani JP. Contribution of barore-ceptors and chemorebarore-ceptors to ventricular hypertrophy produced by sino-aortic denervation in rats. J Physiol 1999; 516 (Part 3): 885-895.
5. Gribbin B, Pickering TG, Sleight P, Peto R. Effect of age and high blood pressure on baroreflex sensitivity in man. Circ Res 1971; 29: 424-431.
6. Oosting J, Struijker-Boudier HA, Janssen BJ. Validation of a continuous baroreceptor reflex sensitivity index calculated from spontaneous fluctuations of blood pressure and pulse interval in rats. J Hypertens 1997; 15: 391-399.
7. Barres C, Lewis SJ, Jacob HJ, Brody MJ. Arterial pressure lability and renal sympathetic nerve activity are dissociated in SAD rats. Am J Physiol 1992; 263: R639-R646.
8. Osborn JW, Provo BJ. Salt-dependent hypertension in the sinoaortic-denervated rat. Hypertension 1992; 19: 658-662.
9. Franchini KG, Cestari IA, Krieger EM. Restoration of arte-rial blood oxygen tension increases artearte-rial pressure in sinoaortic-denervated rats. Am J Physiol 1994; 266: H1055-H1061.
10. Irigoyen MC, Moreira ED, Ida F, Pires M, Cestari IA, Krieger EM. Changes of renal sympathetic activity in acute and chronic conscious sinoaortic denervated rats. Hypertension
1995; 26: 1111-1116.
11. Zhang ZQ, Barres C, Julien C. Involvement of vasodilator mechanisms in arterial pressure lability after sino-aortic baroreceptor denervation in rat. J Physiol 1995; 482 (Part 2): 435-448.
12. Osborn JW, Hornfeldt BJ. Arterial baroreceptor denervation impairs long-term regulation of arterial pressure during di-etary salt loading. Am J Physiol 1998; 275: H1558-H1566. 13. Van Vliet BN, Hu L, Scott T, Chafe L, Montani JP. Cardiac
hypertrophy and telemetered blood pressure 6 wk after baroreceptor denervation in normotensive rats. Am J Physiol
1996; 271: R1759-R1769.
14. Schreihofer AM, Sved AF. Nucleus tractus solitarius and control of blood pressure in chronic sinoaortic denervated rats. Am J Physiol 1992; 263: R258-R266.
15. Schreihofer AM, Sved AF. Use of sinoaortic denervation to study the role of baroreceptors in cardiovascular regulation.
Am J Physiol 1994; 266: R1705-R1710.
16. Schreihofer AM, Ito S, Sved AF. Brain stem control of arterial pressure in chronic arterial baroreceptor-denervated rats.
Am J Physiol Regul Integr Comp Physiol 2005; 289: R1746-R1755.
17. Van Vliet BN, Chafe LL. Reduction of blood pressure vari-ability by amlodipine in baroreceptor denervated rats. Clin Exp Hypertens 2000; 22: 645-661.
18. Julien C, Chapuis B, Cheng Y, Barres C. Dynamic interac-tions between arterial pressure and sympathetic nerve activ-ity: role of arterial baroreceptors. Am J Physiol Regul Integr Comp Physiol 2003; 285: R834-R841.
19. Fink GD, Kennedy F, Bryan WJ, Werber A. Pathogenesis of hypertension in rats with chronic aortic baroreceptor deaf-ferentation. Hypertension 1980; 2: 319-325.
20. el-Mas MM, Abdel-Rahman AA. Role of aortic baroreceptors in ethanol-induced impairment of baroreflex control of heart rate in conscious rats. J Pharmacol Exp Ther 1992; 262: 157-165.
21. el-Mas MM, Abdel-Rahman AA. Aortic barodenervation up-regulates alpha2-adrenoceptors in the nucleus tractus soli-tarius and rostral ventrolateral medulla: an autoradiographic study. Neuroscience 1997; 79: 581-590.
22. Kouvelas D, Amaniti E, Pourzitaki C, Kapoukranidou D, Thomareis O, Papazisis G, et al. Baroreceptors discharge due to bilateral aortic denervation evokes acute neuronal damage in rat brain. Brain Res Bull 2009; 79: 142-146. 23. Krieger EM. Neurogenic hypertension in the rat. Circ Res
1964; 15: 511-521.
24. Heiberger RM, Holland B. Statistical analysis and data dis-play: an intermediate course with samples in S-plus, R and SAS. New York: Springer Science + Business Media Inc.;
2004.
25. Box GEP, Cox DR. An analysis of transformations. J R Stat Soc Series B Stat Methodol 1964; B26: 211-243.
26. Akaike H. New look at the statistical model identification.
IEEE Trans Automat Contr 1974; 19: 716-723.
27. Frigge M, Hoaglin DC, Iglewicz B. Some implementations of the Boxplot. Am Stat 1989; 43: 50-54.
28. Bertinieri G, di Rienzo M, Cavallazzi A, Ferrari AU, Pedotti A, Mancia G. A new approach to analysis of the arterial barore-flex. J Hypertens Suppl 1985; 3: S79-S81.
29. Bedran-de-Castro MT, Farah VM, Krieger EM. Influence of general anesthetics on baroreflex control of circulation. Braz J Med Biol Res 1990; 23: 1185-1193.
30. Farah VM, Moreira ED, Pires MD, Irigoyen MC, Krieger EM. Comparison of three methods for the determination of baroreflex sensitivity in conscious rats. Braz J Med Biol Res
1999; 32: 361-369.
31. Carruba MO, Bondiolotti G, Picotti GB, Catteruccia N, Da Prada M. Effects of diethyl ether, halothane, ketamine and urethane on sympathetic activity in the rat. Eur J Pharmacol
1987; 134: 15-24.
32. Werber AH, Fink GD. Cardiovascular and body fluid changes after aortic baroreceptor deafferentation. Am J Physiol 1981; 240: H685-H690.
33. Fink GD, Bryan WJ, Mann M, Osborn J, Werber A. Con-tinuous blood pressure measurement in rats with aortic baroreceptor deafferentation. Am J Physiol 1981; 241: H268-H272.
34. Patel KP, Ciriello J, Kline RL. Noradrenergic mechanisms in brain and peripheral organs after aortic nerve transection.
Am J Physiol 1981; 240: H481-H486.
35. Kline RL, Patel KP, Ciriello J, Mercer PF. Effect of renal denervation on arterial pressure in rats with aortic nerve transection. Hypertension 1983; 5: 468-475.
López-Rodríguez JF, Calvo-Turrubiartes MZ. Chronic aortic dener-vation switches salt sensitive normotension to salt sensitive hypertension in rats. FASEB J 2009; 23: 1017.
37. Rodríguez-Martínez M, Jones SY, DiBona GF. Mechanisms
of exaggerated renal sympathoinhibition during volume load-ing in spontaneously hypertensive rats. J Hypertens 1995; 13: 1449-1455.
Supplemental material
Appendix A
Conformation of this series
Lability of MAP. To form this series with respect to the lability of mean arterial pressure (SD of MAP), MAP lability data from 79 experiments (see Table A below) derived from both study A (N = 37, 21 SHM and 16 SAD) and study B (N = 42, 22 SHM and 20 AD) were modeled by the study factor (two levels: A and B), denervation factor (three levels: SHM, AD, SAD), diet factor (two levels: HNa and LNa), and their interactions (denervation x diet, diet x study and denerva-tion x diet x study) after subjecting them to Box-Cox transformadenerva-tion. The modeling indicated (r2 adj. = 0.7135, ANOVA:
<0.0001) the effects of both denervation (P < 0.0001) and diet (P = 0.0071) factors, but not the effect of the study factor or the interactions. However, bivariate analysis of these transformed values followed by the Tukey test showed that the effect of diet was attributable to differences among the levels of denervation but not to differences within any level of denervation. Moreover, the diet factor explained only 4% of the explained variation (r2)and therefore was excluded from
the model; consequently the number of groups was reduced from six to three (N = 79, SHM = 43, AD = 20, SAD = 16). Next, an outlier box plot analysis (OBPA) for three levels of denervation was applied to these Box-Cox transformed values, so that no SHM or AD experiment and one SAD experiment were eliminated after verifying that there had not been a keying error. The remaining MAP lability values (N = 78) were modeled again by the denervation factor (DEN, three levels) after subjecting them to a Box-Cox transformation (r2 adj. = 0.6942, ANOVA: <0.0001, DEN: P < 0.0001).
These transformed values were then subjected to overlapping graphic analysis in order to eliminate the values that showed overlapping at the edges of each level of denervation on the basis of the following criteria: a) the magnitude of the surgical procedure is distinct if an SHM, an AD or an SAD is performed; b) to perform an incomplete AD or SAD
is more likely than denervating by accident an SHM animal; c) an intact animal may have a given extent of baroreflex
dysfunction (innate or acquired). In this way, six SHM, four AD, and four SAD experiments were eliminated, so that this series, with respect to the MAP lability, was represented by 64 experiments (SHM = 37, AD = 16, SAD = 11). Finally, the MAP lability values of these 64 experiments were subjected to bivariate analysis (Welch ANOVA and Welch two-sample tests) and then remodeled by the denervation factor (three levels) after subjecting them to a Box-Cox transformation (r2 adj. = 0.8362, ANOVA: <0.0001, DEN: P < 0.0001). The residuals fitted a normal distribution and showed homo
-scedasticity, and therefore a Tukey test was applied to these transformed data (Table 3 of the manuscript). The final
Box-Cox transformation of the MAP lability values was: {((SD of MAP-0.4)-1)/-0.038002} and was called the transformed
lability index (TLI).
Baroreflex sensitivity (BRS). To form this series with respect to the SNP-PHE slope (Y2-Y1/X2-X1), data from 79 experiments (see Table B) derived from both study A (N = 37, 21 SHM and 16 SAD) and study B (N = 42, 22 SHM and 20 AD) were modeled by the study factor (two levels: A and
B), denervation factor (three levels: SHM, AD, and SAD), diet factor (two levels: HNa and LNa), and their interactions. To eliminate negative slope values and to perform, when necessary, Box-Cox transformations, the number 3 was subtracted from all slopes. The initial modeling indicated (r2 adj. = 0.8172, ANOVA: <0.0001) that only the effect of
the denervation factor was significant (P < 0.0001), but
not that of the study factor (P = 0.6473), diet factor (P = 0.9827) or of their interactions. Consequently, the number of groups was reduced from six to three (N = 79, SHM = 43, AD = 20, SAD = 16). These SNP-PHE slope values (N = 79) were modeled again for the denervation factor alone (DEN = three levels) after subjecting them to a Box-Cox transformation (r2 adj. = 0.8186, ANOVA: < 0.0001, DEN: P <
0.0001). Next, an OBPA (see analysis) for the three levels of denervation was applied to these transformed slope values,
Table A. MAP lability values in the six groups of rats with SHM (sham denervation), AD (aortic denervation), or SAD (sinoaortic denervation) on high (HNa) and low (LNa) sodium diets.
SHM AD SAD
LNa HNa LNa HNa LNa HNa
N 21 22 10 10 7 9
Mean 2.8 3.4 4.9 5.6 11.3 13.7
SD 0.8 0.9 1.9 1.1 6.4 6.0
SEM 0.16 0.19 0.60 0.34 2.42 1.99 Median 2.6 3.3 4.6 5.5 9.9 11.4 Range 2.8 3.0 6.3 3.1 18.7 18.4
Min 1.8 1.9 2.5 4.4 6.3 5.3
so that two SHM, no AD and two SAD experiments were ruled out after verifying that there were no keying errors. Subsequently, the remaining slope values (N = 75) were modeled again by the denervation factor (three levels) after subjecting them to a Box-Cox transformation (r2 adj. = 0.8583, ANOVA: <0.0001, DEN: P <
0.0001). The transformed slope values of these 75 experiments were then subjected to an overlapping graphic analysis in order to eliminate those values that showed overlapping at the edges of each level of denervation, on the basis of the same criteria
as described above. In this way, no SHM experiments, five AD
experiments and two SAD experiments were eliminated so that
this series, with respect to baroreflex sensitivity, was represented
by 68 experiments (SHM = 41, AD = 15, SAD = 12). With these
68 remaining SNP-PHE slope values, the baroreflex sensitivity
was remodeled for the denervation factor after subjecting them to a Box-Cox transformation (r2 adj. = 0.8935, ANOVA: <0.0001,
DEN: P < 0.0001). The residuals fitted a normal distribution but
showed heteroscedasticity, so that a Welch ANOVA and a Welch
two-sample test were applied to these data (Table 1 of manuscript). The final Box-Cox transformation of the SNP-PHE slope values was {(((3-(ΔHRSNP-ΔHRPHE/ΔMAPSNP-ΔMAPPHE))-0.4)-1)/-0.04597} and was called the transformed general
sensitivity index (TGSI).
Appendix B
The objectives of this experiment were two: a) to evaluate the magni-tude and the time course of PHE ratio and SNP ratio after halting ether an-esthesia and b) to evaluate how much the SNP-PHE slope changes with the time after halting ether anesthesia.
A group of eight intact Wistar rats (N = 8, from Harlan, Mexico) fed a normal sodium diet were subjected to brief ether anesthesia (~10 min), equipped with arterial and venous femoral catheters and evaluated (PHE and SNP tests) at 100 min, 4 h and 6 h after halting ether anesthesia. The results are reported in Table C.
We concluded the following in these Wistar rats from Harlan, Mexico: a) baseline MAP decreased about 7 mmHg over time; b) a statistically
significant slope inversion (PHE slope
> SNP slope) was not observed at 100 min after halting ether anesthesia in spite of the fact that baseline HR was high (~460 bpm). However, there was a tendency of the PHE slope to be greater than the SNP slope. A similar
observation was made at 4 and 6 h after halting ether anesthesia; c) despite baseline HR decreasing with the time after halting ether anesthesia, the tendency of the PHE slope to be greater than the SNP slope never disappeared, and in fact, the differences between them were progressively smaller; d) the SNP ratio (row 8) did not change with the time after halting ether
Table B. SNP-PHE slope values for the six groups of rats with sham denervation (SHM), aortic denervation (AD), or sinoaortic denervation (SAD) on high (HNa) and low (LNa) sodium diets.
SHM AD SAD
LNa HNa LNa HNa LNa HNa
N 21 22 10 10 7 9
Mean -2.7 -2.6 -0.96 -1.1 -0.21 -0.19
SD 0.4 0.7 0.5 0.7 0.14 0.3
SEM 0.08 0.14 0.15 0.22 0.05 0.09 Median -2.8 -2.5 -1.0 -1.0 -0.24 -0.2 Range 1.4 3.2 1.5 2.2 0.5 1.0 Min -3.4 -4.6 -1.8 -2.4 -0.4 -0.6 Max -1.9 -1.4 -0.2 -0.2 0.02 0.3
Table C. Baseline values of heart rate (HR) and mean arterial pressure (MAP) and raw changes in these parameters after three bolus injections of phenylephrine (PHE) and so-dium nitropruside (SNP), used to calculate the PHE ratio, SNP ratio, SNP-PHE slope, transformed general sensitivity index (TGSI), and the average of ratios at three times (100 min, 4 and 6 h) after halting ether anesthesia in a group of eight intact male Wistar rats (from Harlan, México).
Row Variables Time post-anesthesia
100 min 4 h 6 h
1 Baseline HR (bpm) 462 ± 11.8 430 ± 13.6++ 441 ± 11.5+ 2 Baseline MAP (mmHg) 127 ± 2.9 123 ± 1.9 120 ± 1.5+
3 ΔMAPPHE 45 ± 2 47 ± 2 43 ± 3
4 ΔHRPHE -129 ± 5 -120 ± 8 -126 ± 7
5 PHE ratio (bpm/mmHg) -2.90 ± 0.21 -2.54 ± 0.17** -2.90 ± 0.17
6 ΔMAPSNP -25 ± 3 -26 ± 2 -25 ± 2
7 ΔHRSNP 56 ± 8 62 ± 10 62 ± 8
8 SNP ratio (bpm/mmHg) -2.35 ± 0.30 -2.23 ± 0.26 -2.61 ± 0.26 9 SNP-PHE slope (bpm/mmHg) -2.62 ± 0.12 -2.38 ± 0.09*** -2.76 ± 0.17 10 SNP-PHE slope (range) -3.14 to -2.21 -2.54 to -2.08 -3.23 to -2.51 11 TGSI 10.87 ± 0.08 10.71 ± 0.06*** 10.95 ± 0.08 12 SNP ratio + PHE ratio/2 -2.66 ± 0.11 -2.45 ± 0.08* -2.77 ± 0.10
anesthesia, whereas the PHE ratio (row 5), the SNP-PHE slope (row 9), the TGSI (row 11), or the average of ratios (row 12) oscillated, decreasing at 4 h but returning to their 100 min values at 6 h after halting ether anesthesia. We could not document
in these rats either statistically significant inversion of slopes or transition of slopes with time; e) most noteworthy was that even
though SNP-PHE slopes (row 9) oscillated with time after halting ether anesthesia, their values in no experiment (row 10) fell out of the range of SNP-PHE slope for animals with intact arterial baroreceptors established in the present study (see Table 1 of manuscript, After Elimination columns: -3.49 to -1.75), so that, their oscillations with time never put at risk the possibility that SNP-PHE slope evaluates correctly the effectiveness of barodenervation. We could say the same for the TGSI, which is a Box-Cox transformation of SNP-PHE slope.
Appendix C
Series II: Effect of sodium pre-loading afterweaning on SNP-PHE slope
The objective of series II was to evaluate the effect of sodium pre-loading given after weaning on SNP-PHE slope and its Box-Cox transformed value. For descriptive purposes, the series described in Appendix A will be called Series I.
Methods
This series contains data from study B of Series I (N = 42, 22 SHM and 20 AD), which were contrasted with data from an-other independent study C (N = 40, 20 SHM and 20 AD rats) performed by the same expert technician 1.5 years later. In study C, weaned male Wistar rats (70-90 g) were housed in individual cages at the animal care facility and had free access to both a standard solid diet and isotonic saline (0.9%) as drinking water. As in study B, in study C, when the rats reached ~200 g, they were randomly subjected to either SHM or AD. The protocol after barodenervation was identical to that described for Series I, including the random allocation of the animals to HNa or LNa diets (see manuscript).
Results
With respect to the SNP/PHE slope, data from the 82 experiments (see Table D below) derived from both studies B and C were modeled by the study factor (two levels: A and D), denervation factor (two levels: SHM and AD), diet factor (two levels: HNa and LNa), and their interactions after subjecting them to
Box-Cox transformation. In order to eliminate negative slope values and to perform, when necessary, Box-Cox transformations, the number three was subtracted from all slopes. The initial modeling indicated (r2 adj. = 0.6405,
ANOVA: <0.0001) that only the effect of the denervation factor was signifi -cant (P < 0.0001), but not that of the study factor (P = 0.2384), diet factor (P = 0.9165) or of their interactions; consequently, there was a reduction in the number of groups from four to two. These SNP-PHE slope values (N = 82) were modeled again for the denervation factor alone (DEN = two levels) after subjecting them to a Box-Cox transformation (r2 adj. = 0.6336, ANOVA:
<0.0001, DEN: P < 0.0001). Their residuals fitted a normal distribution and
showed homoscedasticity. This analysis indicated that sodium pre-loading after weaning had no effect on SNP-PHE slope values or their Box-Cox
transformed values and therefore that they only reflected the effect of sham
or aortic barodenervation.
In order to define which rats from study C could be considered really sham
(SHM) or aortic denervated (AD) (the effectiveness of barodenervation) the
SNP-PHE slope data from this study were subjected to the final Box-Cox trans -formation of SNP-PHE slope obtained in Series I. Subsequently,
the experiments whose TGSI fell out of the range established within the minimum and maximum TGSI values, as annotated in Table 3 of the manuscript for SHM and AD rats, were eliminated. Thus, three SHM and three AD experiments were eliminated, so that, in study C at the SHM level 17 experiments were retained and at the AD level 17 experiments were retained. The mean, SD, SEM, minimum and maximal values of TGSI for each level of barodenervation are shown in Table E.
As can be seen, the mean TGSI values at each level of
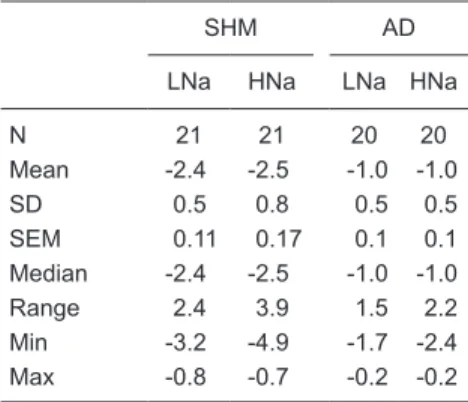
baro-Table D. SNP-PHE slope values for the four groups of rats with sham denervation (SHM) or aortic denervation (AD) on high (HNa) and low (LNa) sodium diets.
SHM AD
LNa HNa LNa HNa
N 21 21 20 20
Mean -2.4 -2.5 -1.0 -1.0
SD 0.5 0.8 0.5 0.5
SEM 0.11 0.17 0.1 0.1
Median -2.4 -2.5 -1.0 -1.0
Range 2.4 3.9 1.5 2.2
Min -3.2 -4.9 -1.7 -2.4 Max -0.8 -0.7 -0.2 -0.2
Table E. Statistical summary of TGSI in the retained rats at each level of barodenervation [sham denervation (SHM) or aortic denervation (AD)] in study C.
Level N Mean SD SEM Minimum Maximum
denervation were very close to those annotated in Table 3 of the manuscript. In this study, the acceptance coefficient at
each level of barodenervation was 85%.
Appendix D
Series III: Effect of intracerebroventricular cannulation on SNP-PHE slope
The objective of Series III was to evaluate the effect of prior intracerebroventricular (icv) cannulation on SNP-PHE slope and its Box-Cox transformed value. For descriptive purposes, the series described in Appendix A will be called Series I.
Methods
This series contains data from study A of Series I (N = 37, 21 SHM and 16 SAD) and data from an additional independent study D (N = 43, 21 SHM and 22 SAD rats) performed by the same expert technician 1.5 years later. In study D, on day 17 of the diet, SHM and SAD rats were anesthetized with ketamine (33.3 mg/kg, ip) and xylazine (6.7 mg/kg, ip). The rats were placed in a stereotaxic apparatus to allow chronic placement of a stainless steel cannula in the right lateral cerebral
ventricle, with the aid of Paxinos and Watson’s Atlas (see Ref. 37). After
placement of the icv cannula, and after the administration of antibiotic and analgesic medication as described in the Methods section of the manuscript, the rats were returned to their cages at the animal care facility and kept on their assigned diet until day 21. After this, the protocol was identical to that described for Series I, including the random allocation of the animals to an HNa or LNa diet (see manuscript).
Results
With respect to the SNP/PHE slope, data from the 80 experiments (see Table F) derived from both studies A and D were modeled by the study fac-tor (two levels: A and D), denervation facfac-tor (two levels: SHM and SAD), diet factor (two levels: HNa and LNa), and their interactions after subjecting them to Box-Cox transformation. In order to eliminate negative slope values and to perform, when necessary, Box-Cox transformations, the number 3 was subtracted from all slopes. The initial modeling indicated (r2 adj. = 0.9267, ANOVA: <0.0001) that only the effect of the denervation factor
was significant (P < 0.0001), but not that of the study factor (P = 0.0767),
diet factor (P = 0.0592) or of their interactions; consequently, there was a reduction in the number of groups from four to two. These SNP-PHE slope values (N = 80) were modeled again for the denervation
factor alone (DEN = two levels) after subjecting them to a Box-Cox transformation (r2 adj. = 0.9163, ANOVA:
<0.0001, DEN: P < 0.0001). Their residuals fitted a normal
distribution and showed homoscedasticity. This analysis indicates that prior icv cannulation has no effect on SNP-PHE slope values or their Box-Cox transformed values
and therefore that they only reflect the effect of sham or
sinoaortic barodenervation.
In order to define which rats from study D could be
considered really sham (SHM) or sinoaortic (SAD) denervated (the effectiveness of barodenervation), the SNP-PHE slope
data from this study were subjected to the final Box-Cox transformation of TGSI obtained in Series I. Subsequently, the
experiments whose TGSI fell out of the range established within the minimum and maximum TGSI values, as annotated in Table 3 of the manuscript for SHM and SAD rats, were eliminated. Thus, four SHM and four SAD experiments were eliminated, so that 17 experiments were retained in study D at the SHM level, whereas 18 experiments were retained at the SAD level. The mean, SD, SEM, minimum and maximal values of TGSI for each level of barodenervation are shown in Table G.
As can be seen, the mean TGSI values at each level of barodenervation were very close to those given in Table 3 of
the manuscript. In this study, the acceptance coefficient was 81 and 72% at the SHM and SAD levels of barodenerva -tion, respectively.
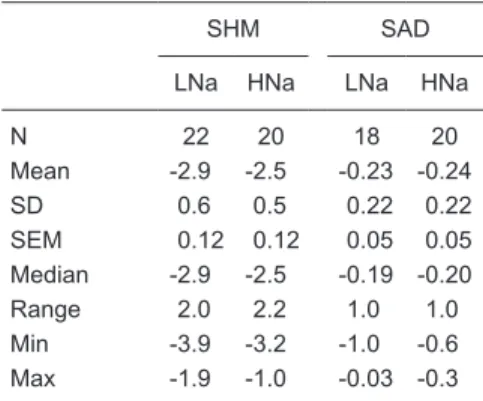
Table F. SNP-PHE slope values for the four groups of rats with sham denervation (SHM) or sinoaortic denervation (SAD) on high (HNa) and low (LNa) sodium diets.
SHM SAD
LNa HNa LNa HNa
N 22 20 18 20
Mean -2.9 -2.5 -0.23 -0.24
SD 0.6 0.5 0.22 0.22
SEM 0.12 0.12 0.05 0.05 Median -2.9 -2.5 -0.19 -0.20
Range 2.0 2.2 1.0 1.0
Min -3.9 -3.2 -1.0 -0.6 Max -1.9 -1.0 -0.03 -0.3
Table G. Statistical summary of TGSI in the retained rats at each level of barodenervation [sham denervation (SHM) or sinoaortic denervation (SAD)] in study D.
Level N Mean SD SEM Minimum Maximum
Appendix E
TGSI implementation
In order to obtain the TGSI and to determine the extent of functional or surgical barodenervation in a given conscious rat, the following steps are necessary:
1) Be certain that the rat is conscious, quiet and equipped with permeable arterial and venous catheters.
2) After a 1-min control period, administer a 100-µL bolus of phenylephrine (PHE, 10 µg/kg, iv) and observe the response over a period of 4 min. After 10 min of recuperation, administer a second and a third bolus with further 10-min recuperation periods in between. Repeat the same protocol but now with 100 µL of sodium nitroprusside (SNP, 5 µg/ kg, iv), leaving a 6-min recuperation interval between three bolus injections. Do not flush the catheter after each bolus, only between drugs. Special care must be taken to ensure that the bolus is administered when the MAP is stable and that the HR response is not out of the tachograph range. If positive, bolus administration should be repeated with 75 µL instead of 100 µL.
3) Determine the steady peak changes of MAP (ΔMAP) and HR (ΔHR) observed with three consecutive bolus injec -tions of PHE and three of SNP.
4) Calculate the average of the above steady peak changes of MAP (ΔMAP) and HR (ΔHR). This yields four values: ΔHRPHE, ΔHRSNP, ΔMAPPHE and ΔMAPSNP.
5) Apply Box-Cox transformation = {(((3-(ΔHRSNP-ΔHRPHE/ΔMAPSNP-ΔMAPPHE))-0.4)-1)/-0.04597} to obtain the
TGSI. (ΔHRSNP-ΔHRPHE/ΔMAPSNP-ΔMAPPHE) is the SNP-PHE slope.