Retarded Fetal Growth Patterns and Early
Neonatal Mortality
in a Mexico City Populatiolll
H. BALCAZAR~ & J. D. HAAS~
444
The sfudy reporfed here classified 9,660 newborn infants delivered af a maternal and child health center in Mexico City by length of gestation, presence or absence of growth retardation, and (in the case of growth-retarded infants) proportionate or disproportionate growth retardati*on in terms of the infants’ weighf and length. It was found that preterm infanfs (delivered before 38 weeks of gestation) had nine times the early neonatal morfality of ferm infants, irrespective of growfh retarda- tion patterns. Also, fhe type of fetal growth retardation involved (proportionate or disproportionate) in those cases where such retardation was present was found to have an impact on early neonatal mortality. That is, preterm and term infants classified as havingproporfionafegrowth retardation respectively exhibited 1.5 and 9.5 times the early neonafal morfalify of preterm and term infants with dispropor- tionate growth retardation. Among other things, fhese findings suggest a need for assessing types of growth retardation as well as etiologic factors when evaluating morfalify risk in newborns.
T
he significance of low birthweight- in terms of poor prognosis for the neonatal period and subsequent growth and development-is well recognized (I). However, low birthweight infants consti- tute a very heterogeneous group includ- ing at least two major subgroups: prema- ture infants and infants small for their gestational age whose intrauterine growth has been retarded. This fact has aroused public health interest in better defining the differential prognosis and‘The work reported here was supported in part by funds from the Scott Paper Company and Cornell University’s Division of Nutritional Sciences and Center for International Studies, through the uni- versity’s Latin American Studies Program. This ar- ticle will also be published in Spanish in the Bolefin de la Oficina Sanitaria Panameticaha, vol. 110. 2Department of Family Resources and Human De-
velopment, Arizona State Universitv, Tempe, Ari- zonk 85287-2502, USA. _ _ aDivision of Nutritional Sciences, Cornell Univer-
sity, Ithaca, New York 14853, USA.
etiology of low birthweight (2, 3). One of the approaches taken thus far has been to relate the different types of low birth- weight to outcomes such as perinatal and neonatal mortality (4-9).
When analyzing the relative contribu- tions of prematurity and intrauterine growth retardation (IUGR) to low birth- weight and neonatal mortality, a distinc- tion should be made between circum- stances prevailing in developed and developing countries. The reason is that prematurity typically makes a relatively greater contribution to low birthweight in developed countries, while in developing countries IUGR or small-for-gestational- age (SGA) infants account for a larger share of those with low birthweight (2).
In evaluating the relationship between low birthweight and mortality, an addi- tional distinction should be drawn be- tween different types of low birthweight, because SGA infants are themselves a
very heterogeneous group whose sub- groups could have different prognoses during the neonatal period. To help as- sess this matter, birthweight, crown-to- heel length, and gestational age informa- tion has been used to subdivide SGA in- fants into separate risk categories based on the type of IUGR involved (3).
Among the most common distinctions made is one between SGA infants with “proportionate” versus “disproportio- nate” growth retardation (proportion- ately SGA infants have experienced com- parable intrauterine growth retardation in both weight and length while dispro- portionately SGA infants have experi- enced greater retardation in weight rela- tive to length-3). This distinction has proved useful for understanding the causes of SGA and also for understand- ing the timing of the insult to the fetus during pregnancy (3). Its significance points up the fact that the implications of these two types of IUGR for neonatal mortality risk need to be evaluated-es- pecially in developing countries, where IUGR is the single major contributor to low birthweight.
Specifically, investigations that evaluate mortality among SGA infants with pro- portionate and disproportionate growth retardation are needed in order to learn more about health implications of the dif- ferent types of low birthweight through population-based studies. Working along those lines, this article provides an analy- sis of various retarded fetal growth pat- terns relative to early neonatal mortality in a Mexico City population.
MATJXIALS
AND METHODS
The information analyzed was col- lected retrospectively at the “Maximino Avila Carnacho” Maternal and Child Health Center in Mexico City. All infants born at the center during 1981, 1982, and 1983 were included in the study.
The information studied was obtained through a record-keeping system devel- oped by the health center’s statistics de- partment. The system required that in- formation reported daily regarding the outcomes of all deliveries be system- atically recorded by members of the sta- tistical department’s staff. Double-check- ing was done periodically to ensure the system’s reliability.
During subsequent evaluation, special emphasis was placed on information about certain specific variables-notably birthweight, gestational age, crown-to- heel length, and early neonatal mortality. Early neonatal mortality was defined as mortality occurring during the first three days of postnatal life. Birthweight was measured by registered nurses at the cen- ter immediately after delivery, using an infant weighing scale that was peri- odically checked and calibrated. Each in- fant was weighed to the nearest 10 grams. Gestational age was calculated from the mother’s menstrual history by the attending physician. Crown-to-heel length was determined with the child in the supine position using a cloth tape measure, the measurement being re- corded to the nearest centimeter.
The ratio of weight to crown-heel length was calculated for descriptive pur- poses according to Rohrer’s ponderal in- dex (weight x 10011engths). This index
estimates an infant’s weight relative to its length and can be compared to reference data giving ponderal index values for dif- ferent gestational ages (10). As can be seen, lower index values apply to infants that are light for their lengths, while higher values apply to those relatively heavy for their lengths.
Multiple deliveries were excluded from the study, as were deliveries for which the data were incomplete. The total num- ber of live births included in the analysis was 9,660.
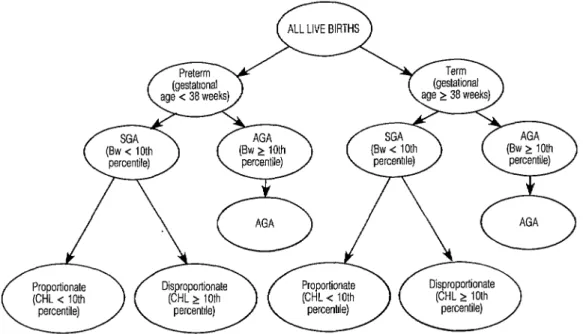
The scheme employed in this study for
Figure 1. The scheme used for classifying newborns in the study sample. SGA = small for gestational age; AGA = adequate for gestational age; Bw = birthweight; CHL = crown-heel length.
classifying newborn infants is shown in neonatal mortality of different groups. Figure 1. Using gestational age data, all Specifically, early neonatal risk ratios and the deliveries were first classified as pre- their 95% confidence intervals were cal- term or term. Following hospital pro- culated for each of the various aforemen- cedures, deliveries occurring before 38 tioned subgroups within the newborn weeks of gestation were considered pre- study population (22) (see Table 4 and term, all others being considered term. Figure 1).
SGA infants, both preterm and term, were defined as those below the tenth percentile by weight with respect to Lub- chenco’s reference data (from a U.S. ref- erence population) (12). These SGA in- fants (both preterm and term) were also classified as proportionately or dispro- portionately growth retarded, depending on whether or not their crown-heel length was below the tenth percentile shown in the same reference data.
RESULTS
The observed distribution of newborns according to gestational age and type of fetal growth retardation is shown in Table 1. Using the hospital criterion of pre- maturity, 11.7% of the newborns were classified as preterm infants and 88.3% as term infants.
Preterm and term infants whose weights were adequate for their gesta- tional ages (AGA infants) were defined as those at or above the tenth percentile by weight with respect to the reference data (II).
Chi-square analysis was used to assess the significance of differences in the early
Based on the growth retardation classi- fication scheme described above, 9.8% (approximately 10%) of the total infant study population was classified as SGA. Of the SGA infants, 12.6% were classi- fied as proportionately growth retarded and 87.4% as disproportionately growth retarded.
Descriptive statistics regarding se-
Table 1. Distribution of newborn infants accord- ing to gestational age and type of fetal growth retardation.
Newborn classification No. % Preterm (gestational age < 38 weeks) 1 ,134 11.7 Term (gestational age 2 38 weeks) 8,526 88.3 Small for gestational age (birthweight
< 10th percentile)a 952 9.8 Proportionate fcfown-heel length
-c 10th percenti/e)a 120 1.2 Disproportionate fcfown-heel
length 2 10th percenti/e)a 832 8.6 Adequate for gestational age (birth-
weight t 10th percentilela 8,708 90.2 Total sample 9,660 100.0 “Cutoff value for Lubchenco’s reference growth data (1 I).
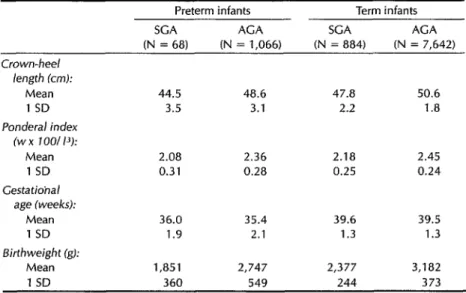
lected fetal growth indicators for term and preterm SGA and AGA neonates are shown in Table 2. This table presents the mean and standard deviation values for birthweight, crown-heel length, pon- deral index, and gestational age in each of these four groups. The values shown are in the direction expected; that is, the mean values are higher for the AGA in- fants than for the SGA ones, and are also higher for the term infants than for the preterm ones.
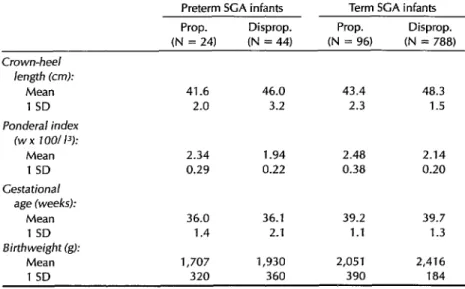
The same descriptive information is presented in Table 3 for proportionately and disproportionately SGA infants. These data are consistent with the nature of the growth retardation categories in- volved. (Relative to disproportionately growth-retarded newborns, it was ex- pected that the proportionately growth- retarded newborns in both term and pre- term groups would have shorter average crown-heel lengths and higher ponderal indexes.)
Table 4 shows early neonatal mortality among different subgroups of the study population. The overall early neonatal mortality for the whole population was 7.9 deaths per thousand live births. Dis- regarding birthweight, the preterm in- fants had higher mortality (37.0 per thou- sand), while the term infants’ mortality was substantially lower (4.1 per thou- sand).
Early neonatal mortality for the infants classified as SGA was 25.2 deaths per thousand live births, as compared to 6.0 per thousand for the infants classified as AGA. An even sharper contrast was found between mortality among preterm
Table 2. Selected growth indicators (mean and 1 standard deviation) found for the study population of term and preterm SGA and AGA infants.
Preterm infants Term infants
SCA AGA SGA ACA
(N = 68) (N = 1,066) (N = 884) (N = 7,642) Crown-heel
length (cm):
Mean 44.5 48.6 47.8 50.6
1 SD 3.5 3.1 2.2 1.8
Ponderal index (w x 1001 I’):
Mean 2.08 2.36 2.18 2.45
1 SD 0.31 0.28 0.25 0.24 Gestatiohal
age (weeks):
Mean 36.0 35.4 39.6 39.5
1 SD 1.9 2.1 1.3 1.3
Birthweight (g):
Mean 1,851 2,747 2,377 3,182
1 SD 360 549 244 373
Table 3. Selected growth indicators (mean and 1 standard deviation) found for SGA infants in the study population with proportionate (prop.) and dispropor- tionate (disprop.) growth.
Preterm SCA infants Term SCA infants Prop. Disprop. Prop. Disprop. (N = 24) (N = 44) (N = 96) (N = 788) Crown-heel
length (crd: Mean 1 SD Ponderai index
(w x IOOI 13): Mean 1 SD Gestational
age (weeks): Mean 1 SD Birthweight (g):
Mean 1 SD
41.6 46.0 43.4 48.3 2.0 3.2 2.3 1.5
2.34 1.94 2.48 2.14 0.29 0.22 0.38 0.20
36.0 36.1 39.2 39.7 1.4 2.1 1.1 1.3
1,707 1,930 2,051 2,416 320 360 390 184
SGA infants and other groups, the pre- term SGA mortality being 161.7 deaths per thousand live births, as compared to 14.7 for the term SGA infants, 29.0 for the preterm AGA infants, and 2.8 for the term AGA infants. These differences are statistically significant (p < 0.05).
In terms of the risk ratios shown in Ta- ble 4, it can be seen that the preterm and term SGA infants, respectively, experi-
enced 58 and 5 times the relative risk of early neonatal death that was experi- enced by the term AGA infants. The fact that the lower limit of the 95% confidence interval for each group was greater than one, especially in the case of the preterm SGA infants, indicates statistically greater mortality for these two groups than for the term AGA infants. Similarly, the fact that the 95% confidence intervals
Table 4. Early neonatal mortality (deaths during the first three days per 1,000 live births) among infants in different groups of the study population.
Early
No. of neonatal Confidence Newborn classification newborns mortality Risk ratioa intervalb Preterm AGA infants 1,066 29.0 10.3 6.6-l 6.0 Preterm SGA infants 68 161.7 57.7 38.7-85.9
Proportionate 24 208.3 74.3 45.1-122.2 Disproportionate 44 136.3 48.6 28.9-87.7 Term AGA infants 7,642 2.8 1
Term SGA infants 884 14.7 5.2 2.7-9.6 Proportionate 96 72.9 26.0 14.6-46.1 Disproportionate 788 7.6 2.7 1.1-6.5
Total mortality 7.9
Total live births 9,660
aRisk ratio = mortality of a specific newborn classification group relative to mortality of the term ACA FYOUP (2.8 early neona- tal deaths per thousand live births).
“Upperand lower limits of the risk ratios’ 95% confidence intervals.
of the risk ratios for the preterm and term SGA infants did not overlap indicates statistically greater mortality among the preterm SGA infants than among their term SGA counterparts.
Regarding proportionate versus dis- proportionate growth retardation as pre- viously defined, early neonatal mortality for the disproportionately SGA infants
(irrespective of gestational age at birth) was 14.4 deaths per thousand live births, while that for proportionately SGA in- fants was 100.0 per thousand. When ges- tational age is considered (see Table 4), it may be seen that term proportionately SGA infants experienced significantly higher early neonatal mortality than their term disproportionately SGA counter- parts (72.9 versus 7.6 deaths per thou- sand live births, respectively), and that this mortality was also higher among the preterm proportionately SGA infants than among the preterm dispropor- tionately SGA infants, though this differ- ence was not statistically significant. Overall, early neonatal mortality among the preterm proportionately SGA infants was higher (208.3 deaths per thousand live births) than among any other study group examined.
On the other hand, disproportionately SGA term infants experienced the lowest mortality (7.6 deaths per thousand live births) of all the infant groups with intra- uterine growth retardation (the SGA groups). In terms of risk ratios, the 2.7 figure shown for this group in Table 4 compares favorably with the risk ratios for proportionately SGA term infants (26.0), disproportionately SGA preterm infants (48.6), and proportionately SGA preterm infants (74.3).
In examining the risk ratio 95% confi- dence intervals shown in Table 4, one finds some overlap between those for proportionately and disproportionately SGA preterm infants; but there is no overlap in those for proportionately and
disproportionately SGA term infants, again demonstrating significantly lower risk for the disproportionately SGA term group. Overall, it is worth noting that the risk ratios’ 95% confidence intervals are lower for disproportionately SGA infants than for proportionately SGA infants in both the term and preterm categories. It should also be observed that all lower values of the 95% confidence intervals for the four SGA groups are greater than one, indicating statistically greater mor- tality among these groups than among the term AGA infants.
DISCUSSION
In interpreting these results, several characteristics of the study should be considered, notably: (1) use of the crite- rion of early neonatal mortality (death in the first three days of life); (2) the defini- tion used for prematurity (delivery at 37 weeks or less of gestational age); and (3) adoption of Lubchenco’s growth refer- ence data for purposes of classifying infants as small for gestational age (using the tenth birthweight percentile of Lub- chenco’s data) and as proportionately or disproportionately growth-retarded (using the tenth crown-heel length percentile of Lubchenco’s data).
Early neonatal mortality (defined as mortality in the first three days of postna- tal life) involved a three-day time period that coincided conveniently with the shortest time any of the living newborns stayed at the center before being sent home. Obviously, this mortality applies only to the first three days rather than to the entire neonatal period (the first 28 days). Adoption of this criterion is very practical, because mortality data on in- fant deaths occurring outside of hospitals in developing countries are seldom re- corded. Nevertheless, it is possible that some infants may have been kept alive through the first three days by medical
intervention and then died later; thus, in this sense the group’s risk of early death could have been understated.
The definition of prematurity used in this study was delivery at less than 38 weeks of gestation, the same definition used at the Maximino Avila Camacho Health Center. This classification in- cluded more newborns in the preterm group than did the conventional defini- tion of delivery at less than 37 weeks. Overall, 1,134 newborns were placed in the preterm group using the health cen- ter criterion, while only 692 would have been included if the conventional (37 week) definition had been used.
One result of this was to lower appar- ent mortality within the premature group-from 56.3 deaths per 1,000 live births if the conventional criterion had been applied to 37.0 using the hospital criterion actually employed. The reason is that although 442 “extra” newborns were added to the preterm group, only three of them died within three days of delivery. However, the relatively low early neonatal mortality within this group of 442 (6.8 deaths per 1,000 live births) was quite similar to the early neo- natal mortality experienced by the 8,526 infants delivered at term according to the health center (38 week) definition, and so it had negligible apparent impact upon mortality within this latter group. (Classi- fication of the study infants as SGA or AGA was unaffected by the definition of prematurity employed.)
The study used a two-stage classifica- tion scheme to classify infants first as AGA or SGA, and then to classify the latter as proportionately or dispropor- tionately SGA. Among other things, this approach depended upon information being available on each study infant’s gestational age at birth.
Using the definition of SGA employed in the study, the results demonstrated lower early neonatal mortality among the
term SGA infants (14.7 deaths per thou- sand live births) than among all the pre- term infants (37.0 deaths per thousand live births). This finding is consistent with results of the few studies done on this subject in developed countries (5, 6, 13-15).
More striking, early neonatal mortality among the SGA infants classified as pro- portionately growth-retarded was found to be seven times higher than mortality among the disproportionately SGA in- fants. This difference may well be associ- ated with the severity of the growth re- tardation found in proportionately SGA infants. In turn, the more severe growth retardation of the proportionately SGA infants is probably ascribable to different causes that also compromise survival. This severity is reflected in the substan- tially lower weights and shorter crown- heel lengths observed in the propor- tionately SGA group relative to the dis- proportionately SGA group. (The data in Table 3 show that the proportionately
SGA infants had lower mean birth- weights and lower crown-heel lengths in both preterm and term categories than did their disproportionately SGA coun- terparts .)
Table 3 indicates that the differences in birthweight and crown-heel length within these preterm and term SGA groups do not merely reflect differences in gestational age. However, it is possible that the marked difference in mortality observed between proportionately and disproportionately SGA infants is con- founded by the difference in birthweight observed in the two groups. Conse- quently, the results presented should be interpreted with caution.
Even though it would seem that the two-stage classification scheme of growth retardation used in this study was effec- tive for the population to which it was applied, additional research is needed on the independent effects of birthweight
and growth patterns on neonatal mortal- ity in developing countries. Furthermore, the fetal growth classification schemes used in this study, especially with regard to the role of disproportionate versus proportionate growth retardation in ex- plaining different rates of neonatal mor- tality, require further investigation. For example, a study conducted by Haas et al. (26), which was done in the same Mexican population as the present study,4 found differences in the preva- lence of proportionately versus dispro- portionately SGA infants and in the early neonatal mortality experienced by these groups. These differences appear at first sight to contradict the results of the pres- ent study.
However, the study by Haas et al. used different criteria for determining pre- maturity, growth retardation, and pro- portionate versus disproportionate growth retardation. Infants were classi- fied as preterm if their gestational age was less than 37 weeks at delivery; and they were classified as SGA using a cut- off birthweight of 2,900 grams, which is equivalent to the tenth percentile at 40 weeks of gestation for a composite of sev- eral U.S. and European reference popu- lations. The tenth percentile of Rohrer’s ponderal index, according to the refer- ence population of Lubchenco et al. (JO), was used as the secondary indicator to distinguish between disproportionate and proportionate growth retardation.
The differences observed between these studies regarding early neonatal mortality and the percentages of infants in the term, preterm, AGA, SGA, and proportionately versus disproportionate- ly SGA groups probably reflect differ- ences in the classification schemes em-
ployed, combined with differences in the errors incurred in applying these schemes. Among other things, this sug- gests that more studies are needed to evaluate the effect of measurement errors upon results obtained with both of these schemes. In addition, it is important to do research directed at determining what fetal growth standards are most appro- priate to use and what cutoff values should be employed in defining patterns of intrauterine growth retardation.
CONCLUSIONS
The results of the work reported here help to underscore a need existing in vir- tually all developing countries-the need to more thoroughly assess use of com- bined information on gestational age, birthweight, and crown-heel length at birth in order to better define patterns of intrauterine growth retardation. In addi- tion, when seeking to apply classification schemes such as ours, attempts should be made to include maternal, demo- graphic, medical, and social risk factors in order to identify the etiology of the growth retardation problems observed. In this same vein, when defining the eti- ology of growth retardation problems, ef- forts should be made to document the causes of death of all the infant fatalities involved and the type of growth retarda- tion affecting each infant classified as SGA. This sort of analysis of causes of death among these different groups, be- sides indicating the etiologic factors asso- ciated with the different types of growth retardation, can shed new light on the kinds of interventions needed to reduce the risk of early death among growth- retarded newborns.
Acknowledgments. We wish to thank
The same study population of newborns delivered Dr. Calderon and the statistical depart- at the “Maximino Avila Camacho” Maternal and ment of the “Maximino Avila Camacho” Child Health Center. Maternal and Child Health Center in
Mexico City for their valuable assistance in data collection.
REFERENCES
1.
2.
3.
4.
5.
6.
7.
Villar J, Smeriglio V Martorell R, et al. Heterogeneous growth and mental devel- opment of intrauterine growth-retarded infants during the first 3 years of life. Pediatrics. 1984;74:783-91.
Villar J, Belizan J. The relative contribu- tion of prematurity and fetal growth retar- dation to low birthweight in developing and developed societies. Am J Obsfef Gy- necol. 1982;143:793-798.
Villar J, Belizln J. The timing factor in the
pathophysiology of the intrauterine
growth retardation syndrome. Obsfet Gy- necol Sure. 1982;37:499-506.
Goldenberg R, Nelson K, Hale C, et al. Survival of infants with low birthweight and early gestational age, 1979 to 1981. Am J Obstet Gynecol. 1984;149:508-11. Rush RW, Segall ML. The effect of pre- term delivery on perinatal mortality. Br / Obstet Gynaecol. 1978;85:806-11.
Arias F, Tomich I? Etiology and outcome of low birthweight and preterm infants. Obsfef Gynecol. 1982;60:277-81.
Lee K, Paneth N, Gartner L, et al. The very low-birthweight rate: principal pre- dictor of neonatal mortality in indus- trialized populations. J Pediatr. 1980;97: 759-64.
8.
9.
10.
11.
12.
13.
14.
15.
16.
Susser M, Marolla FA, Fleiss J. Birth- weight, fetal age, and perinatal mortality. Am J Epidemiol. 1972;96:197-204.
Williams RL, Creasy RK, Cunningham
GG, et al. Fetal growth and perinatal via- bility in California. Obstet Gynecol. 1982; 59:624-32.
Lubchenco L, Hansman C, Boyd E. Intra- uterine growth in length and head cir- cumference as estimated from live births at gestational ages from 26 to 42 weeks. Pediatrics. 1966;37(2):403-08.
Lubchenco L, Hansman C, Dressler M, et al. Intrauterine growth as estimated from liveborn birth-weight data at 24 to 42 weeks of gestation. J Pediatr. 1963;32:793- 800.
Kleinbaum D, Kupper L, Morgenstern H. Epidemiologic research: principles and quantitative methods. New York: Lifetime Learning Publications; 1982.
Miller H. Fetal growth and neonatal mor- tality. Pediatrics. 1972;49(3):392-99. Battaglia F. Intrauterine growth retarda-
tion. Am J Obstet Gynecol. 1970;
106(7):1103-14.
Lubchenco L, Searls D, Brazie J. Neonatal mortality rate: relationship to birthweight and gestational age. J Pediatr. 1972; 813814-22.
Haas J, Balcazar H, Caulfield L. Variation in early neonatal mortality for different types of fetal growth retardation. Am J Phys Anfhrop. 1987;73(4):467-73.