REVISTA
PAULISTA
DE
PEDIATRIA
www.rpped.com.br
ORIGINAL
ARTICLE
Secular
trends
in
infant
mortality
by
age-group
and
avoidable
components
in
the
State
of
São
Paulo,
1996---2012
Kelsy
Catherina
Nema
Areco
∗,
Tulio
Konstantyner,
José
Augusto
de
Aguiar
Carrazedo
Taddei
DepartamentodePediatria,EscolaPaulistadeMedicina,UniversidadeFederaldeSãoPaulo(EPM-Unifesp),SãoPaulo,SP,Brazil
Received5October2015;accepted11January2016 Availableonline24June2016
KEYWORDS Infantmortality; Healthcare(public health);
Ecologicalstudies; Timeseriesstudies
Abstract
Objective: TodescribetrendsandcompositionofinfantmortalityrateintheStateofSãoPaulo, from1996to2012.
Methods: Anecologicalstudy wasconducted,basedonofficialsecondarydata ofbirthsand infantdeathsofresidentsinSãoPaulo,from1996to2012.Theinfantmortalityratewas cal-culatedbythedirectmethodandwasanalyzedbygraphsandpolynomialregressionmodels foragegroups(earlyneonatal,lateneonatalandpost-neonatal)andforgroupsofavoidable causesofdeath.
Results: The mortality rateinthe State ofSãoPaulo tended tofall, rangingfrom 22.5 to 11.5perthousandlivebirths.Halfoftheinfantdeathsoccurredintheearlyneonatalgroup. Theproportionofavoidableinfantdeathsvariedfrom76.0to68.7%.Thedeathswhichwere avoidablebyadequateattentiontowomenduringpregnancyandchildbirthandnewborncare accountedfor54%ofinfantdeathsthroughouttheperiod.
Conclusions: Themortalityratelevelsarestillfarfromthoseindevelopedcountries,which highlightthe needtoprioritizeaccess and qualityofhealthcare servicesduring pregnancy, childbirthandnewborncare,especiallyinthefirstweekoflife,aimingatachievingstandards ofinfantmortalitysimilartothoseofdevelopedsocieties.
©2016SociedadedePediatriadeS˜aoPaulo.PublishedbyElsevierEditoraLtda.Thisisanopen accessarticleundertheCCBYlicense(http://creativecommons.org/licenses/by/4.0/).
∗Correspondingauthor.
E-mail:[email protected](K.C.Areco). http://dx.doi.org/10.1016/j.rppede.2016.03.009
PALAVRAS-CHAVE Mortalidadeinfantil; Atenc¸ãoàsaúde; Estudosecológicos; Estudosdeséries temporais
Tendênciaseculardamortalidadeinfantil,componentesetárioseevitabilidade noEstadodeSãoPaulo---1996a2012
Resumo
Objetivo: Conheceratendênciaeacomposic¸ãodataxademortalidadeinfantilnoEstadode SãoPaulode1996a2012.
Métodos: Estudo ecológico, baseadoem dados secundários oficiaisdenascimentos eóbitos infantisderesidentesnoEstadodeSãoPaulo,de1996a2012.A taxademortalidade infan-til,calculadapelométododireto,foianalisadapormeiodegráficosemodelosderegressão polinomialparaosgruposetários(neonatalprecoce,tardioepós-neonatal)eparagruposde causasevitáveisdeóbito.
Resultados: A taxademortalidadeinfantil noEstadodeSãoPauloapresentou tendênciade queda, varioude 22,5a11,5pormilnascidos vivos.Metadedosóbitosinfantisocorreuno grupoetárioneonatalprecoce.Aproporc¸ãodeóbitosinfantisevitáveisvarioude76,0%a68,7%. Ascausasreduzíveisporadequadaatenc¸ãoàmulhernagestac¸ãoepartoeaorecém-nascido representaram54%dosóbitosinfantisemtodooperíodo.
Conclusões: Osníveis dataxa demortalidade infantil aindaestãodistantes dosobservados empaísesdesenvolvidos,oqueevidenciaanecessidadedepriorizaroacessoeaqualidade dosservic¸os assistenciaisduranteagravidez,o partoeoperíodo neonatal, principalmente naprimeira semanade vida, para atingir padrões demortalidade infantil próximos aosde sociedadesdesenvolvidas.
©2016SociedadedePediatriadeS˜aoPaulo.PublicadoporElsevierEditoraLtda.Este ´eum artigoOpenAccesssobumalicenc¸aCCBY(http://creativecommons.org/licenses/by/4.0/).
Introduction
Infantmortalityrate(IMR)reflectsthelivingandhealth con-ditions of populations,estimates the risk ofdeath among childrenunderoneyearold,andexpressestheinequitiesin differentpartsoftheworld, ascanbeseen inAfricaand Europe,whose IMR in 2013 were 60 and 11 per 1000 live births(‰LB),respectively.1---4
Reducingchildmortalityisoneofthegoalsofthe‘‘eight MillenniumDevelopmentGoals(MDGs)’’establishedbythe UnitedNations (UN)and agreed byBrazil, along with190 nationsin2000.TheBraziliangoal(IMR15.7‰LBby2015)
hasalreadybeenmetin2011(IMR15.3‰LB).3,5However,
duetoitsterritorialextentthecountryhasalargevariability inIMRanddifficultyinproducingaccurateestimatesofthis indicator.6,7ThehighestIMRareintheNorthandNortheast
andthelowestintheSouthandSoutheast.5,7Forexample,
in2008---2010, the IMRcorrected by activesearch ofvital statisticswas11.2‰LBinSantaCatarinaand28.7‰LBin
Amapá.7
São Paulo State, the country’s main socioeconomic region,with18.2%ofBrazilianinfantdeaths,hadanIMRof 11.6‰LBin2011andranksthirdamongstates.When com-paredtotheLatinAmericacountries,theStateofSãoPaulo onlyhasrateshigherthanthoseofCuba andChile,which showedIMRbelow10‰LB.Althoughwithintheagreed
tar-get, the IMR of São Paulo is far fromthose of developed countries,whicharenothigherthan5‰ LB,showingthat
thereisstillconsiderableroomforimprovement.3,5,8,9
InBrazil,inthe1980s,themaincausesthatcontributed tothe reductionof infant mortalityin Brazil belonged to thegroupofpreventablediseasesthroughpropersanitation,
and half of the deaths occurred in the post-neonatal period.9,10Themajorityofinfantdeathsoccurinthe
neona-tal period and are associated with both the quality and accesstohealthservicesthatprovideprenatal,childbirth, andnewborncare.1---3,11 Despitethischange inthescenario
of infantdeaths over time,the preventable conditionsas determinantsofinfantmortalitypredominate.
In1977,theanalysisofpreventabledeathswasproposed asahealthcarequalityindicator,anddefinedasthosethat shouldnotoccurifhealthcenterswereeffective.2,12 From
thisconcept,researchersindifferentcountrieshave devel-oped preventabilitycriteria toidentify thesepreventable deaths. The first Brazilian list for classification of avoid-ablecauses of infantdeaths wasproposedin 2000by the Fundac¸ãoSistemaEstadualdeAnálisedeDadosdoGoverno do Estado de São Paulo (SEADE --- a state system of data analysis),accordingtowhichtheavoidabledeathsarethose thatcanbeprevented,regardlessoftheavailabilityoflocal resources,technologies,existingproceduresortreatments. In 2007, the current Brazilian list applicable to children underfiveyearsoldwasdeveloped,basedonexisting classi-fications,conceptsofpreventabledeathsrelatedtoactions of health servicesand technologyavailable in theUnified HealthSystem(‘‘SistemaÚnicodeSaúde’’---SUS).1,2,13
Method
Anecologicalstudybasedonsecondarydataofbirthsand deaths, collected by the Ministry of Health (MH) through theLiveBirthInformationSystem(‘‘SistemadeInformac¸ão sobreNascidosVivos’’---SINASC)andMortality(‘‘Sistemade Informac¸ões deMortalidade’’ ---SIM),whichis availablein structureddigitalformat.14
Weincludedallbirthevents(livebirths)andinfant mor-tality (under one year old), referring to the children of mothersliving in SãoPaulo, occurredfrom01/01/1996 to 12/31/2012.Thesedeathswereclassifiedaccordingto life-time (age group), preventability, and group of avoidable causes.
IMR, expressed in number of deaths per thousand live births(‰LB),wascalculatedbythedirectmethod,15year
byyear, for categoriesof dimensions instudy (age,death preventability,andgroupofpreventablecauses).
Regarding age, deaths were grouped into three cate-gories:earlyneonatal(0---6days),lateneonatal(7---27days), andpost-neonatal(28---364days).16
Deaths were classified according to the preventability fromthe basic cause ofdeath, accordingto theBrazilian listofcauses ofpreventable deathsinchildren underfive yearsold.2,17
IMR trend was assessed using graphs and polynomial regression models,adjusted for each category ofinterest (general, age group, and group/subgroup of causes). IMR wasthe dependent variable(Y) andthe studyyears were theonlyindependentvariable(X).Theyear1996was con-sideredasthe‘‘yearzero’’andasignificancelevelof˛=0.05 wasconsideredforalltestsperformed.First,asignificance testwasperformedforlinearmodel,withaninvestigation ofthecoefficientofdetermination(R2)andtheviolationof
adherence assumptions for dependent variable (Y) and residualstothenormaldistribution,homoscedasticity,and absence of serial correlation residuals. This process was repeatedwiththestatisticalpackageSTATA/IC12.1, increas-ingthe polynomialorder (2nd,3rd,4th, 5thorder) up to a model without assumption violation. The coefficient of determination(R2) of each model wasusedasa measure offittingadequacy,consideringthoseclosesttotheunitas thebestfitted.18,19
Totalandmeanvariations werecalculatedinIMR units (‰LB)andrespectivepercentages(%)forbothobservedand
estimatedvalues.Thepercentagechangeswerepresented tothenearest0.1(1decimalplace),butwerecalculatedto sixdecimalplaces.
Themeannumberofdeathscorrespondingtothe varia-tionof 0.1‰LB inIMRwascalculatedbasedonthemean
numberoflivebirths.
ThisstudywasapprovedbytheInstitutionalReviewBoard ofthe Federal Universityof SãoPaulo, under theOpinion number664.976.
Results
From1996to2012,10,827,106livebirthsand168,187infant deaths (under one year old) were recorded, children of motherslivingintheStateofSãoPaulo,and99.8%ofdeaths occurredwithinthestateitself(Fig.1).
Theinfantmortalityraterangedfrom22.5to11.5deaths perthousandlivebirths(‰LB),withapercentagedecrease
of 48.7% and average estimated reduction of 0.65‰ LB
annually.Onaverage, theone-tenth(0.1)variationinIMR correspondedtotheeffectmagnitudeof63.7infantdeaths per thousand live births. Considering the average annual
22.5 21.6
19.8
17.9 17.3
16.5
15.3 15.2 14.5
13.5 13.4 13.1
12.6 12.5
11.9 11.6 11.5 11.7 11.5
10.4 9.5
8.9
8.2 7.8
7.4 7.1
6.6 6.5 6.2 6.1 6.1
5.7 5.7 5.7
3.1 3.1 3.0 2.8 2.8 3.0 2.8 2.8 2.8 2.7 2.5 2.6 2.5 2.5 2.4
2.2 2.2 7.7
7.0 6.5
5.6 5.6 5.3
4.7 4.9 4.6 4.3 4.3 4.2
4.0 3.8 3.8 3.7 3.6
0 5 10 15 20 25
1996 699 013
15 710 1997 701 947
15 159 1998 693 413
13 756 1999 714 428
12 796 2000 687 779
11 922 2001 632 483
10437 2002 623 302
9534 2003 610 555
9273 2004 618 080
8959 2005 618 880
8353 2006 603 368
8078 2007 595 408
7774 2008 601 795
7585 2009 598 473
7482 2010 601 352
7163 2011 610 222
7088 2012 616 608
7118
Infant mortality rate Early neonatal mortality rate (0-6 days) Late neonatal mortality rate (7-27 days) Post-neonatal mortality rate (28-364 days) ‰ LB deaths
Live births Infant deaths
numberoflivebirthsduringthestudyperiod(1996---2012), whichwas636,888,theannualestimateddropof0.65‰LB inIMR correspondedtothe meanannualreduction of414 deaths(Fig.1andTable1).
TheearlyneonatalIMRrangedfrom11.7‰to5.7‰LB,
down51.3%;lateneonatalrangedfrom3.1‰ to2.2‰ LB,
down28.2%;andpost-neonatalrangedfrom7.7‰to3.6‰
LB,down52.9%.Regardingthetotalnumberofdeaths ana-lyzed,earlyneonatalaccountedfor50.5%,lateneonatalfor
17.4%, and post-neonatal for 32.1% of infantdeaths. The contribution of early neonataldeaths toIMR ranged from 52%(11.7‰---22.5‰LB)in1996to49.6%(5.7‰---11.5‰LB)
in2012(Fig.1).
Inallagegroups,theobservedandestimatedvaluesshow thatIMRtendedtodropinthisperiod,withannualreduction estimated at 0.39‰ LB for early neonatal; 0.22‰ LB for
post-neonatal,and0.05‰LBforlateneonataldeaths(Fig.1
andTable1).
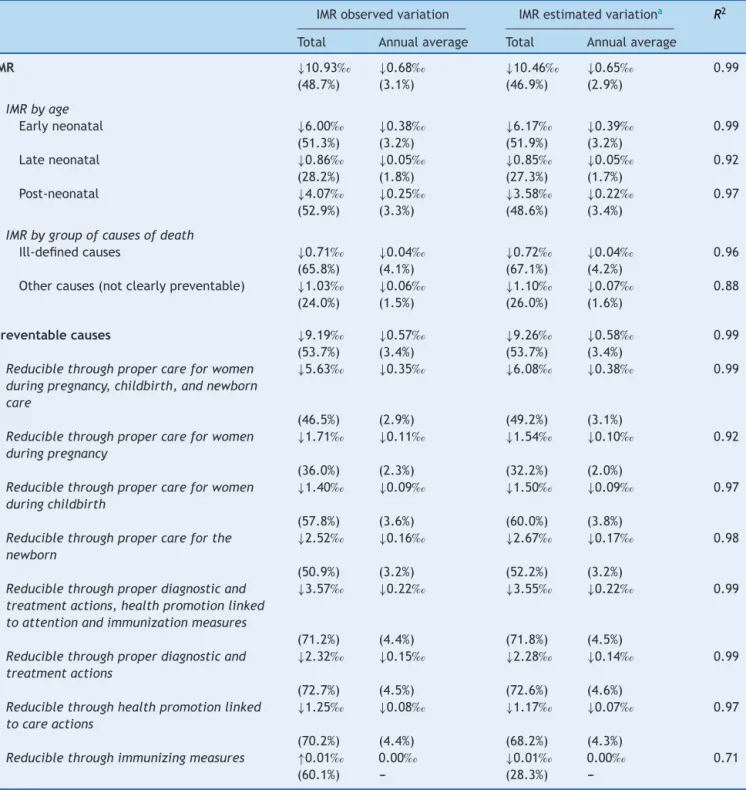
Table1 IMRtrendanalysisaccordingtoageandgroupofcausesofdeath.StateofSãoPaulo,1996---2012.
IMRobservedvariation IMRestimatedvariationa R2
Total Annualaverage Total Annualaverage
IMR ↓10.93‰ ↓0.68‰ ↓10.46‰ ↓0.65‰ 0.99
(48.7%) (3.1%) (46.9%) (2.9%)
IMRbyage
Earlyneonatal ↓6.00‰ ↓0.38‰ ↓6.17‰ ↓0.39‰ 0.99 (51.3%) (3.2%) (51.9%) (3.2%)
Lateneonatal ↓0.86‰ ↓0.05‰ ↓0.85‰ ↓0.05‰ 0.92
(28.2%) (1.8%) (27.3%) (1.7%)
Post-neonatal ↓4.07‰ ↓0.25‰ ↓3.58‰ ↓0.22‰ 0.97
(52.9%) (3.3%) (48.6%) (3.4%)
IMRbygroupofcausesofdeath
Ill-definedcauses ↓0.71‰ ↓0.04‰ ↓0.72‰ ↓0.04‰ 0.96
(65.8%) (4.1%) (67.1%) (4.2%)
Othercauses(notclearlypreventable) ↓1.03‰ ↓0.06‰ ↓1.10‰ ↓0.07‰ 0.88
(24.0%) (1.5%) (26.0%) (1.6%)
Preventablecauses ↓9.19‰ ↓0.57‰ ↓9.26‰ ↓0.58‰ 0.99
(53.7%) (3.4%) (53.7%) (3.4%)
Reduciblethroughpropercareforwomen duringpregnancy,childbirth,andnewborn care
↓5.63‰ ↓0.35‰ ↓6.08‰ ↓0.38‰ 0.99
(46.5%) (2.9%) (49.2%) (3.1%)
Reduciblethroughpropercareforwomen duringpregnancy
↓1.71‰ ↓0.11‰ ↓1.54‰ ↓0.10‰ 0.92
(36.0%) (2.3%) (32.2%) (2.0%)
Reduciblethroughpropercareforwomen duringchildbirth
↓1.40‰ ↓0.09‰ ↓1.50‰ ↓0.09‰ 0.97
(57.8%) (3.6%) (60.0%) (3.8%)
Reduciblethroughpropercareforthe newborn
↓2.52‰ ↓0.16‰ ↓2.67‰ ↓0.17‰ 0.98
(50.9%) (3.2%) (52.2%) (3.2%)
Reduciblethroughproperdiagnosticand treatmentactions,healthpromotionlinked toattentionandimmunizationmeasures
↓3.57‰ ↓0.22‰ ↓3.55‰ ↓0.22‰ 0.99
(71.2%) (4.4%) (71.8%) (4.5%)
Reduciblethroughproperdiagnosticand treatmentactions
↓2.32‰ ↓0.15‰ ↓2.28‰ ↓0.14‰ 0.99
(72.7%) (4.5%) (72.6%) (4.6%)
Reduciblethroughhealthpromotionlinked tocareactions
↓1.25‰ ↓0.08‰ ↓1.17‰ ↓0.07‰ 0.97
(70.2%) (4.4%) (68.2%) (4.3%)
Reduciblethroughimmunizingmeasures ↑0.01‰ 0.00‰ ↓0.01‰ 0.00‰ 0.71
(60.1%) --- (28.3%)
‰ LB deaths
0 5 10 15 20 25
22.5 21.6
19.8
17.9 17.3
16.5
15.3 15.2 14.5
13.5 13.4 13.1
12.6 12.5
11.9 11.6 11.5
7.9 8 8.2 8.6 8.5 9.1 9.2 9.1 9.7 10.2 10.6 11.5 12.4 13 14.9 16.3 17.1
4.3
1.1
1998 1997 1996
Infant mortality rate from preventable causes Infant mortality rate
Infant mortality rate from causes not clearly preventable
Infant mortality rate from ill-defined causes
2012 2011 2010 2009 2008 2007 2006 2005 2004 2003 2002 2001 2000 1999
0.9 1 0.9 0.9 0.9 0.8 0.8 0.7 0.7 0.6 0.5 0.6 0.5 0.5 0.4 0.4 4.3 4 4 4 4.1 3.9 4.2 4.1 3.7
3.6 3.5 3.5 3.4 3.3 3.3 3.2
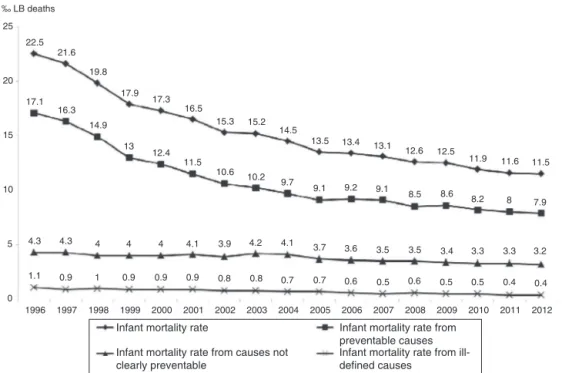
Figure2 Infantmortalityrateaccordingtodeathpreventability.StateofSãoPaulo,1996---2012.
Regarding death preventability,the observed IMR from preventablecausesrangedfrom17.1‰LBto7.9‰LB,down
53.7%;IMRfromcausesnotclearlypreventablerangedfrom 4.3‰ LB to3.2‰ LB, down 24%;and IMRfromill-defined causesrangedfrom1.1‰LBto0.4‰LB,down65.8%.Deaths
from preventable causes accounted for the largest share of infantdeaths throughout the period,ranging from76% (1996)to69% (2012).In thethreegroups analyzed, there wasannualreductionestimatedat0.04‰LBforill-defined
causes, 0.07‰ LB for causesnot clearlypreventable, and
0.58‰LBforpreventablecauses(Fig.2andTable1).
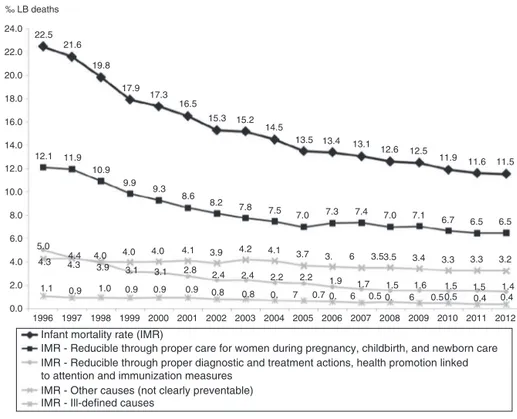
Thecausesofdeath‘‘Reduciblethroughpropercarefor women during pregnancy, childbirth, and newborn care’’ droppedby46.5%,rangingfrom12.1‰LBto6.5‰LB,with
estimatedannualreductionof0.38‰LB.Infantdeathsfrom
thesecausesaccountedfor54.3%ofthetotalintheperiod. Thedownwardtrendwasalsoobservedinsubgroups,with reductions estimated at 0.10‰ LB for causes related to
women duringpregnancy, 0.09‰ LB for causes relatedto
womenduringchildbirth, and0.17‰ LBforcausesrelated tonewborncare(Fig.3andTable1).
The IMR reduction observed in all causes ‘‘Reducible through proper diagnostic and treatment actions, health promotionlinkedtoattentionandimmunizationmeasures’’ was71.2%,rangingfrom5‰LBin1996to1.4‰LBin2012,
with annual estimated reduction of 0.22‰ LB. The
aver-age annual reduction wasestimated at 0.14‰ LB for the
causes‘‘Reduciblethroughproperdiagnosticandtreatment actions’’and0.07‰ LBforthecauses‘‘Reduciblethrough healthpromotionactionslinkedtoattentionactions’’(Fig.3 andTable1).
The IMR for causes ‘‘Reducible through immunization measures’’ had an observed average of 0.02‰ LB andan
observed andestimated averageannual variationcloseto zero(0.00‰LB).
Discussion
Between1996 and2012, theIMRin SãoPaulo droppedby approximately50% andshowedadownwardtrend, signifi-cantlymorepronouncedinthefirsthalfofthisperiod,with evasionofonly0.2%ofdeaths.From1997to2006,theSão Paulo IMR reduced by 38%, a greater reduction than that forBrazil(35.2%).1ThisreductioninnationalIMRseemsto
resultfromimprovementinhealthservices,asthe perfor-manceof other socialindicators at thattimewerenot as good.1
Withthechallengeofachievingthenationaland inter-nationally agreed goals for the proposed IMR levels for 2015,itbecamenecessarytomonitorthisindicatorin dif-ferent administrative levels to assess the impact of the decentralized,but nationallyarticulated,health actions.6
Consequently, there was an increased demand for more accurateestimates of IMR, which depend ongood cover-ageofvitalrecordsandregularityinsendinginformationto SINASCandSIMsystems.6,7,15
This study estimated the annual IMR for the State of SãoPaulo usingthedirectmethod,without needforusing otherproceduresorcorrectionfactorforthewholeperiod becausevitalinformationwasconsidered completeinthis state,accordingtotheInteragencyNetworkofHealth Infor-mation(‘‘RedeInteragencialdeInformac¸õesparaaSaúde’’ ---RIPSA)criteria,aswellasinRiodeJaneiro,RioGrandedo Sul,andMatoGrossodoSul.5,6,15
The age composition of infant deaths assessed in the StateofSãoPaulowassimilartothatinBrazil,with preva-lenceofneonatalgroup.1,3,20In2011,theSãoPauloneonatal
IMRwaslower thanthat of Brazil (11.1‰ LB) and similar
tothatoftheSoutheastregion(8.0‰ LB).3Neonatal
‰ LB deaths 24.0 22.5 21.6 19.8 17.9 17.3 16.5 15.3 15.2 14.5
13.5 13.4 13.1
12.5 12.6
11.9 11.6 11.5
6.5 6.5 6.7 7.1 7.0 7.4 7.3 7.0 7.5 7.8 8.2 8.6 9.3 9.9 10.9 11.9 12.1 5.0 4.3 1.1 1997 1996
Infant mortality rate (IMR)
IMR - Reducible through proper care for women during pregnancy, childbirth, and newborn care IMR - Reducible through proper diagnostic and treatment actions, health promotion linked to attention and immunization measures
IMR - Other causes (not clearly preventable) IMR - Ill-defined causes
2012 2011 2010 2009 2008 2007 2006 2005 2004 2003 2002 2001 2000 1999 1998 0.9 4.3 4.0
4.4 4.0 4.0 3.9 3.1 3.1
4.1 3.9 4.2 4.1 3.7
2.2 1.9 0.5 6 0. 1.7 3.5 6
3. 3.5 3.4 3.3 3.3 3.2
1.4 0.4 1.5 1.6 0.5 6
0. 0.5 0.4
1.5 1.5
2.4 2.2 2.8 2.4
0.8 0.8 0. 7 0.7 0.9 0.9 0.9 1.0 22.0 20.0 18.0 16.0 14.0 12.0 10.0 8.0 6.0 4.0 2.0 0.0
Figure3 Infantmortalityratebygroupofcauses.StateofSãoPaulo,1996---2012.
care.3,21,22 Many neonataldeaths can beavoided, evenin
prematurewithverylowbirthweight.22
Accounting for about half of infant deaths, the early neonatal group also stood out with the highest average annualreductioninmortalityrateduringthe17years stud-ied. Therefore, variations in mortality in this age group havegreatimpactonchildmortality.Despitethedownward trend,theearlyneonatalmortalityratein2012(5.7‰LB)
wasthreetimesthatobservedin2010inall28countriesof theEuropeanUnion.23
Among the preventable causes of neonataldeaths, we highlight perinatal asphyxia. It represented 27.1% of São Pauloneonataldeathsin1996and17.4%in2012.This reduc-tion has been attributed to the organization of perinatal careinthevariouslevelsofaction,includingthoseaimedat pregnantwomen, childbirth, andnewborn.Note worthily, theneonatalresuscitationprogram establishedin 1996by the Brazilian Society of Pediatrics, which aims to reduce preventablechild deathsand theconsequentneurological sequelaeofperinatalasphyxia,andtheregionalized strate-gies,suchasthe programMãePaulistanadoMunicípio de SãoPaulo(‘‘MothersfromthecityofSãoPaulo’’).24---26
From1996to2012,theproportionofpreventableinfant deaths ranged from 76% to 69% in São Paulo. In Brazil, this proportion ranged from 71.4% in 1997 to 69.4% in 2006.1 Although the time intervals and the quality of
information6,7,17 on the cause of death will not allow us
thedirectcomparisonofvalues,thesedatashowthatsince 1996,mostinfantdeathswereavoidable,bothinSãoPaulo andthroughoutBrazil.
Thegroupofcauses‘‘Reduciblethroughpropercarefor womenduring pregnancy, childbirth, and newborncare’’’ accountedformorethanhalfofinfantdeathsanalyzed.The
IMRreductioninthisgroupmaybeassociatedwithincreased accesstohealthservicesandincreasedhealthcarequality providedtopregnantwomenandnewborns.21
The stabilityat low levelsof mortalityin thegroup of preventablecausesthroughimmunizingmeasuresreflected the highrates of theNational Immunization Program vac-cination coverage.27 The average vaccination coverage in
children under one year old in the State of São Paulo, between 2000 and 2012, was greater than 97%, including meningococcalconjugateCintroducedin2011.Thehuman rotavirus vaccine and 10-valent pneumococcal conjugate vaccine,introducedin2006and2010,respectively,havethe lowercoverage,reachingover86%in2011.28
Theperiodunderstudy,withIMRcalculatedyearbyyear, wasenoughtoperformtheinferentialanalysisofthis indi-catortrendinallcategoriesevaluated.Althoughthetrend could be observed by visual inspection of the population values, we choseto follow therecommended methodfor trendanalysisintimeseries,which consistedofthe anal-ysis adjusted by polynomial model for each category. By usingthemodel-estimatedvalues,weavoidedthatthe pos-sible fluctuations in values, occurring at randombecause theyaredependentonthetotalnumberofreporteddeaths and births, interfere in the time series trend analysis.18
The coefficients of determination (R2) close to the unit, aswellastheobservedvaluesclosetotheestimated val-ues,indicatedgoodqualityadjustmentdata.However,the downwardtrendshouldnotberigidlyextrapolatedtofuture periods, because conceptually, the lower the rate of any biologicalevent,thelessthechancesofreducingit.
death.15 It is therefore the most importantdiagnostic for
epidemiologicalpurposes,in whichmost studiesofcauses of death in Brazil are based. The higher the proportion of deaths from ill-defined causes, the worse the quality of information on the underlying cause of death. In the presentstudy,wefoundalowproportionofdeathsfrom ill-definedcauses,ranging from4.8%to3.2%,which enabled thisanalysis.17,29
The regionaldifferenceswithintheStateofSãoPaulo, bothintheaccesstohealthservicesandtechnologies avail-able,werenotconsideredinthisstudy.Itwasassumedthat thecausesofchild deathwouldbeequallypreventablein 675 municipalities ofthe state, the usedlistassumes the existenceofSUSinallregionswiththesameavailabilityof resourcesandhealthcaretechnologies.2
ByclassifyinginfantdeathstostudythetrendofIMRfrom preventablecauses,weconsiderthatthedifferenthistorical momentsdonotdifferintechnologyandhealthpractices. Inthisstudy,theIMRofpreventabledeathsinthe17years analyzedmaybeoverestimatedintheyearsbeforeits cre-ation(2007)andunderestimatedinsubsequentyears,itis assumed that more causes of death become preventable withtheprogressiveimprovementinthetechnologiesused inthehealthsystem.2,13
The listadopted in thisstudy considersaspreventable causesof deaththemorbiditiesrelatedtogestationalage extremes (short or long) and birth weight (low or high), which arebirth conditions commonly associated withrisk ofdeath.2,22
Theanalyzeddeathsrefertotheusersofthepublic(SUS) andsupplementaryhealthsystemoftheStateofSãoPaulo, butitwasnotpossibletoquantifythecontributionofeach systemininfantmortality,asthisinformationisnotincluded intheSIM.Onecanhaveanideaofthesupplementaryhealth servicesparticipationinSUSservicesfromthecoveragerate oftheseservices,whichrangedfrom38.2%in2000to45.3% in2014.Undertheassumptionthatthesamecausesof pre-ventabledeathsintheSUSwouldalsobepreventableinthe supplementaryhealthsystem,itshouldbeconsideredthat theanalysisofIMRfrompreventablecauses(bySUS inter-ventions)inthisstudycontributestotheevaluationofthe Stateof SãoPaulo health system performanceasa whole andhighlightsthekindofhealthcarethatdeservepriority inordertoreduceinfantmortality,both intheSUSandin thesupplementaryhealthsystem.1,2,30
Inthiscontext,weconcludethattheinfantmortalityrate intheStateofSãoPauloremainedindeclinebetween1996 and2012andhadasmaincomponentsearlyneonataldeaths andpreventablecauses,particularlythoserelatedto preg-nancy,childbirth,andneonatalcare.However,theratesfor theendofthestudyperiodarestillfarfromthoseseenin developedcountries.Theseevidencesindicatean improve-ment in thehealth system, but also theneed toimprove andexpandhealthcareservicestopromotehealthand pre-vent deaths in the first year of life, in order to achieve standardsormortalityprofilesclosetothoseofdeveloped societies.
Funding
Thisstudydidnotreceivefunding.
Conflicts
of
interest
Theauthorsdeclarenoconflictsofinterest.
References
1.MaltaDC,DuarteEC,EscalanteJJ,AlmeidaMF,SardinhaLM, Macário EM, et al. Avoidable causes of infant mortality in Brazil, 1997---2006: contributions to performance evaluation of the Unified National Health System. Cad Saude Publica. 2010;26:481---91.
2.Malta DC,Duarte EC,Almeida MF, DiasMA,Morais Neto OL, MouraL,etal.Listofavoidablecausesofdeathsdueto inter-ventionsoftheBrazilianhealthsystem.EpidemiolServSaude. 2007;16:233---44.
3.LanskyS,FricheAA,SilvaAA,CamposD,BittencourtSD, Car-valhoML,etal.PesquisanascernoBrasil:perfildamortalidade neonatal eavaliac¸ãoda assistência à gestante e ao recém-nascido.CadSaudePublica.2014;30Suppl.1:S192---207. 4.WorldHealthOrganization[homepageontheInternet].Infant
and neonatal mortality. Available from: http://www.who. int/gho/childhealth/mortality/en/[cited03.12.15].
5.Brazil---MinistériodaSaúde---DATASUS[homepageonthe Inter-net].Númerodeóbitosinfantis(menoresde1ano)por1.000 nascidos vivos (Brasil,2000-2011) [cited30.11.15]. Available from:http://tabnet.datasus.gov.br/cgi/idb2012/c01b.htm 6.Frias PG,SzwarcwaldCL,LiraPC. Estimac¸ãodamortalidade
infantilnocontextodedescentralizac¸ãodosistemaúnicode saúde(SUS).RevBrasSaudeMaterInfant.2011;11:463---70. 7.Frias PG, Szwarcwald CL, Souza PR Jr, Almeida WS, Lira
PI. Correc¸ão de informac¸ões vitais: estimac¸ão da mortali-dadeinfantil,Brasil,2000-2009.RevSaudePublica. 2013;47: 1048---58.
8.The World Bank [homepage on the Internet]. Mortal-ity rate, infant (per 1,000 live births). Available from: http://data.worldbank.org/indicator/SP.DYN.IMRT.IN [cited 03.12.15].
9.OrtizLP,OushiroDA.PerfildamortalidadeneonatalnoEstado deSãoPaulo.SaoPauloPerspec.2008;22:19---29.
10.OrtizLP.Contrastesregionaisdamortalidadeinfantil.SaoPaulo Perspec.1991;5:107---15.
11.RochaR,OliveiraC,SilvaDK,BonfimC.Mortalidadeneonatale evitabilidade:umaanálisedoperfilepidemiológico.RevEnferm Uerj.2011;19:114---20.
12.LaurentiR,MelloJorgeMH,GotliebSL.Estatísticasde mortal-idadeeseususos. RevEletrdeCom InfInov Saude.2013;7. Available from:http://www.reciis.icict.fiocruz.br/index.php/ reciis/article/view/500[cited03.12.15].
13.MaltaDC,DuarteEC.Causasdemortesevitáveisporac¸ões efe-tivasdosservic¸osdesaúde: umarevisãodaliteratura.Cienc SaudeColet.2007;12:765---76.
14.Brazil --- Ministério da Saúde --- DATASUS. Servic¸os. Available from: http://www2.datasus.gov.br/DATASUS/index.php?area= 0901&item=1[cited30.07.15].
15.AlmeidaWS,SzwarcwaldCL.Mortalidadeinfantilnosmunicípios brasileiros:umapropostade métododeestimac¸ão. RevBras SaudeMaterInfant.2014;14:331---42.
16.Freitas BA, Gonc¸alves MR, Ribeiro RC. Mortalidade infantil, segundo critériosdeevitabilidadeecomponentes---Vic¸osa ---MG,1998-2010.PediatrMod.2012;48:237---45.
17.LaurentiR,Mello-Jorge MH,Gotlieb SL.Mortalidadesegundo causas: considerac¸ões sobre a fidedignidade dos dados. Rev PanamSaludPublica.2008;23:349---56.
19.StataCorp. Stata statistical software: Release 12. College Station,TX:StataCorpLP;2011.
20.Brazil---MinistériodaSaúde---DATASUS[homepageonthe Inter-net].Informac¸õesdeSaúde---estatísticasvitais.Availablefrom: http://www2.datasus.gov.br/DATASUS/index.php?area=0205 [cited30.07.15].
21.NascimentoLF,AlmeidaMC,GomesCM.Causasevitáveise mor-talidadeneonatalnasmicrorregiõesdoEstadodeSãoPaulo.Rev BrasGinecolObstet.2014;36:303---9.
22.AlmeidaMF,GuinsburgR,MartinezFE,ProcianoyRS,LeoneCR, Marba ST, et al. Fatores perinatais associados ao óbito pre-coceem prematuros nascidosnoscentrosdaRede Brasileira dePesquisasNeonatais.JPediatr(RioJ).2008;84:300---7. 23.Base de Dados Portugal Contemporâneo --- PORDATA
[home-page on the Internet]. Neonatal mortality rates and late foetalmortalityrate inEurope.Availablefrom:http://www. pordata.pt/en/Europe/Neonatal+mortality+rates+and+late +foetal+mortality+rate-1258[cited30.07.15].
24.Almeida MF, Guinsburg R. Reanimac¸ão neonatal em sala de parto:documentocientíficodoprogramadereanimac¸ão neona-taldasociedadebrasileiradepediatria.RiodeJaneiro:SBP; 2013.
25.SantosPC,SilvaZP,ChiaravallotiNeto F,Almeida MF.Spatial analysisoflivebirthclustersinUnifiedHealthSystem(SUS)and
privatehospitalsinthemunicipalityofSãoPaulo,Brazil.Cienc SaudeColet.2014;19:235---44.
26.deAlmeidaMF,MoreiraLM,VazDosSantosRM,KawakamiMD, AnchietaLM,GuinsburgR.Earlyneonataldeathswithperinatal asphyxiainverylowbirthweightBrazilianinfants.JPerinatol. 2015;35:954---7.
27.Domingues CM, Teixeira AM. Coberturas vacinais e doenc¸as imunopreveníveisno Brasil noperíodo 1982-2012:avanc¸os e desafiosdoProgramaNacionaldeImunizac¸ões.EpidemiolServ Saude.2013;22:9---27.
28.Centro de vigilância epidemiológica ProfAlexandre Vranjac. SecretariadeEstadodaSaúdedeSãoPaulo.Imunizac¸ão---Série Histórica ---Doses aplicadasecobertura vacinalem menores de1ano---EstadodeSãoPaulo.Availablefrom:http://www. cve.saude.sp.gov.br/htm/imuni/imushmenor1.htm [cited 30.07.15].
29.MelloJorgeMH,LaurentiR,Gotlieb SL.Análisedaqualidade dasestatísticasvitaisbrasileiras:aexperiênciadeimplantac¸ão doSIMedoSINASC.CiencSaudeColet.2007;12:643---54. 30.Brazil --- Agência Nacional de Saúde Suplementar. Dados