ISSN 0104-6632 Printed in Brazil
www.abeq.org.br/bjche
Vol. 27, No. 02, pp. 327 - 338, April - June, 2010
Brazilian Journal
of Chemical
Engineering
THE EFFECT OF HYDROPHOBIC MODIFICATION
OF ZEOLITES ON CO
2
ABSORPTION
IN DIFFERENT SOLVENTS
Lu Sumin
1*, Ma Youguang
2, Shen Shuhua
2and Zhu Chunying
21
Department of Material and Chemical, Tianjin Polytechnic University, Phone: 86-22-60575446, Tianjin 300160, People’s Republic of China.
*
E-mail: [email protected] 2
School of Chemical Engineering and Technology, State Key Laboratory of Chemical Engineering, Phone: 86-22-27404772, Tianjin University, Tianjin 300072, People’s Republic of China.
E-mail: [email protected] ; [email protected] ; [email protected]
(Submitted: July 24, 2009 ; Revised: December 29, 2009 ; Accepted: March 20, 2010)
Abstract - The hydrophobicity of zeolite was achieved by a method of hydrothermal synthesis combined with acid treatment for the enhancement of CO2 absorption. The influence of zeolite before and after modification
on the absorption of CO2 in three kinds of solvents (water, cyclohexane and soy bean oil) was investigated
and many different effects were observed. In aqueous solution, modified zeolite showed a very remarkable enhancement with a maximum enhancement factor of 2.2 for a ratio of SiO2 and Al2O3 equal to 86. However,
no measurable enhancement effect was found in cyclohexane solution by adding modified zeolite, although unmodified zeolite showed a weak increase in the absorption rate. In soybean oil, almost no change in CO2
absorption was obtained for both unmodified and modified zeolites. These results indicate that the particles with an enhancement effect for CO2 absorption rate need to have two properties, hydrophobicity and a high
adsorption capacity for the solute. For predicting the enhancement factor of CO2 absorption by solid particles,
a three-dimensional heterogeneous microcosmic mass transfer model was developed, in which the influence of several parameters and the interaction between particles were mainly considered. The results predicted by the present model show good conformity to experimental data, indicating that the model is rational and applicable for the enhancement process of CO2 absorption by modified zeolite particles.
Keywords: Modified zeolite; Absorption enhancement; Microcosmic model; Adsorbed particles.
INTRODUCTION
As the main contributor to the greenhouse effect, the recovery and effective utilization of CO2 has
received increasing attention. The absorption technique is most commonly employed for the removal of CO2 emitted from industrial waste gas.
However, due to the very low solubility of CO2, the
liquid-side mass transfer usually becomes the dominant factor. Thus, it is essential to increase the mass transfer rate of CO2 absorption into absorbents.
Recent research results have shown that the gas absorption rate can be significantly improved in the presence of some fine adsorptive solid particles
(Kaya and Schumpe, 2005, Demmink et al., 1998, Dagaonkar et al., 2003, Vinke et al., 1993, Ruthiya et al., 2003). The enhancement role of solid particles was first independently proposed by Kars et al (1979) and Alper et al (1980), who investigated the absorption of propane in water and O2 in sucrose
solution, respectively. They found that the gas absorption rate could be increased dramatically in the presence of activated carbon particles.
1988b): (a) hydrophobicity, with which the particles can adhere to the gas-liquid interface to form an adsorptive layer, and (b) high adsorption capacity, that is, the particle should have efficient competitive adsorption ability for the gas solute. Vinke et al (1993) investigated the absorption enhancement of H2 with different supported catalysts and found that
Pd/C catalysts can caused a considerable enhancement of the gas absorption rate of H2, while
Pd/Al2O3, which also has good adsorbing capacity,
did not display any effect on H2 absorption. Vinke et
al (1993) studied experimentally the adhesion of the particles to gas bubbles and showed that carbon-supported catalyst particles adhered to gas bubbles to form an adsorption layer, while no adhesion was observed for the Pd/Al2O3 catalyst. The absorption of
C2H2 in aqueous solution of iron chelates of HEDTA
was carried out by Demmink et al (1998). From the results, the reaction of C2H2 and iron chelates of
HEDTA can be auto-catalyzed by the sulfur particles produced by the reaction itself, which are hydrophobic and consequently enhance the gas
absorption of C2H2. Dagaonkar et al (2003)
investigated the enhancement effect of TiO2 particles
on CO2 absorption and concluded that the
concentration of TiO2 at the gas-liquid interface was
different from that in the bulk, the concentration at the gas-liquid interface being much higher.
The solid particle commonly used in the study of absorption enhancement is activated carbon, which has to be pretreated before use due to the strong adsorption of organic molecules and, accordingly, its application is limited. Highly siliceous zeolites with
low Al2O3 content are known to have highly
hydrophobic surfaces (Tsai et al., 2006). Its good thermal and chemical stability, unique pore structures and easy regeneration make it a promising adsorbent that can be widely used in many fields, such as catalysis, gas separation, various chemical reactions, etc. (Takeuchi et al., 2007, Gokulakrishnan et al., 2007, Baek et al., 2004). However, studies of the application of hydrophobic zeolite on gas absorption enhancement are seldom found in the literature. In the work of Lu et al (2009), hydrophobic modification of zeolite was carried out by framework element modification and a good hydrophobicity was obtained. In this paper, further research on the effect of zeolites, before and after modification, on CO2 absorption in
three kinds of solvents (water, cyclohexane and soybean oil) was performed. A three dimensional non-steady state heterogeneous microscopic model was developed to analyze the experimental results. The influence of some parameters on gas absorption and the interactions among solid particles are discussed.
EXPERIMENTAL SECTION
Modification of Zeolite
A method of hydrothermal synthesis combined with acid treatment was employed. A ZSM-5 zeolite with a SiO2/Al2O3 ratio of 25 was chosen as the raw
material (supplied by Tianjin Chemical Reagent Limited Company). Raw zeolite was treated with steam at 550°C in a fixed-bed reactor to dealuminate from the structural skeleton and then the aluminum residues in the micropores were dissolved with HCl. Thus, the silica-alumina ratio in the skeleton was changed, and hence the hydrophilicity of zeolites (Lu et al., 2009, Chen, 1976, Takeuchi et al., 2007, Cheng and Reinhard, 2006).
The hydrophilicity of zeolites after modification was determined by using a JY-82 contact angle instrument. After pressing the solid powder into disks, the contact angle of water on modified zeolite was measured.
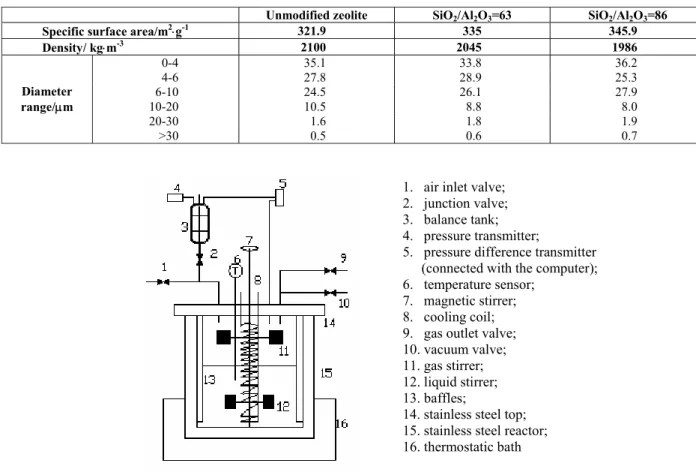
The silica-alumina ratios of zeolite were measured from the X-ray energy spectrum (EDS) on a GENESIS instrument from EDAX corp. of the USA. The specific surface area was determined using a Gemini V 2380 instrument from Micromeritics Instrument Corp.. The particle size distribution was analyzed with a LA-300 laser particle size analyzer. The properties and particle size distribution of zeolite particles are listed in Table 1.
Gas Absorption Experiment
The absorption experiments were carried out in a thermostatic vessel with an inner diameter of 0.073m, and height of 0.21m. (Fig. 1) Four symmetrical baffles were mounted to prevent the formation of horizontal vortex. Two stirrers were employed to mix gas phase and liquid phase, respectively. A cooling coil in the vessel is connected to the thermostatic bath to maintain a constant reaction temperature (298±0.1K). The absorption processes begin with an initial pressure of 0.1MPa. Vessel 3 is a reference vessel, and a pressure difference transducer (±10Pa) is connected between vessel 3 and reactor 15. The transducer signal was transmitted to the computer and recorded on-line. From the value of the recorded pressure difference, the absorption rate can be calculated. Each experiment was repeated at least three times.
Chosen CO2 (purity>99.5%) as the object of
Table 1: Particle size distribution of Zeolites
Unmodified zeolite SiO2/Al2O3=63 SiO2/Al2O3=86
Specific surface area/m2⋅g-1 321.9 335 345.9
Density/ kg⋅m-3 2100 2045 1986
0-4 35.1 33.8 36.2 4-6 27.8 28.9 25.3 6-10 24.5 26.1 27.9
10-20 10.5 8.8 8.0
20-30 1.6 1.8 1.9
Diameter range/μm
>30 0.5 0.6 0.7
1. air inlet valve; 2. junction valve; 3. balance tank; 4. pressure transmitter;
5. pressure difference transmitter (connected with the computer);
6. temperature sensor; 7. magnetic stirrer; 8. cooling coil; 9. gas outlet valve; 10. vacuum valve; 11. gas stirrer; 12. liquid stirrer; 13. baffles;
14. stainless steel top; 15. stainless steel reactor; 16. thermostatic bath
Figure 1: Experimental set-up for gas absorption. From Lu et al., Chinese Journal of Chemical Engineering, 17(1) 36-41 (2009), reproduced with permission from Elsevier.
THEORETICAL MODEL
Hydrophobic solid particles tend to adhere to the gas-liquid interface. According to Brilman et al (1998), only those particles located close to the gas-liquid interface determine mass transfer. Thus, in this work, the particles close to the gas-liquid interface are mainly considered. It is assumed that the coverage of the gas-liquid interface can be described by a Langmuir-type adhesion isotherm (Demmink et al., 1998, Vinke et al., 1993):
s s max
s s
k m 1 k m α = α
+ (1)
With this, the solid concentration at the gas-liquid interface can be obtained, and the enhancement factor can be calculated.
Based on the Higbie penetration model (Higbie,
1935), a liquid element containing solid particles is chosen at the gas-liquid interface (Fig. 2). It is assumed that the position of solid particles within the package remains unchanged during the residence time (tc) at the gas-liquid interface. The particles are
taken as spherical and are randomly distributed in the liquid element. The diffusing solute may or may not encounter the particles in the mass transfer process. In the continuous phase, the balance of the solute can be expressed as:
2 2 2
Ad Ad Ad Ad
A 2 2 2 A
C C C C
D r
t
x y z
⎛∂ +∂ +∂ ⎞=∂ +
⎜ ⎟
⎜ ∂ ∂ ∂ ⎟ ∂
⎝ ⎠ (2)
where rA is the chemical reaction rate, mol⋅m-3⋅s-1.
The absorption of CO2 in the solvents selected can
x
y
z
δ
δ δ
x
y
z
δ
δ δ
Figure 2: Graphical representation of the model.
According to Higbie penetration theory, when a transient equilibrium is reached between gas-liquid phase, the initial and boundary conditions of Eq. (2) are given by
t=0, ∀x, y, z CAd=0
t>0, x=0, CAd=CA0
x= δ(or x→ ∞), CAd=0
y=0and y= δ(or y→ ∞), CAd 0 y
∂ =
∂
z=0and z= δ(or z→ ∞), CAd 0 z
∂ =
∂ (3)
The balance for the solute accumulation within or on a single particle can be expressed as:
(
)
3 2
p p p p Ad AS
q
d k d C C
6 t
π ρ ∂ = π −
∂ (4)
where CAS is the equilibrium concentration of the
solute on the particle, kp is the film mass transfer
coefficient around the particle, and q is the adsorbed amount of the solute on the particles. It is assumed that the adsorption of the solute on the particles can be described by a Langmuir type adsorption isotherm (Lu et al., 2007):
d AS m
d AS
k C
q q
1 k C =
+ (5)
Taking into account the direction perpendicular to the gas-liquid interface as the main direction of mass
transfer, the specific absorption rate at a certain location is defined as
Ad
A A
C (x, y, z, t) R (x, y, z, t) D
x ∂ = −
∂ (6)
And the specific enhancement factor is given by
A
A0
R (x, y, z, t) E(x, y, z, t)
R (x, y, z, t)
= (7)
where RA0 is the absorption rate in the solution free
from solid particles. The time-dependent total enhancement factor can be written as
1
E E(x, y, z)dxdydz
V
=
∫∫∫
(8)The above equations were solved numerically by gPROMs modeling software (Process System Enterprise Ltd.). A centered finite difference method was used, in which the integral domains were discretised over a uniform grid of 20 intervals, and a second order of approximation was chosen.
RESULTS AND DISCUSSION
Experimental Observations
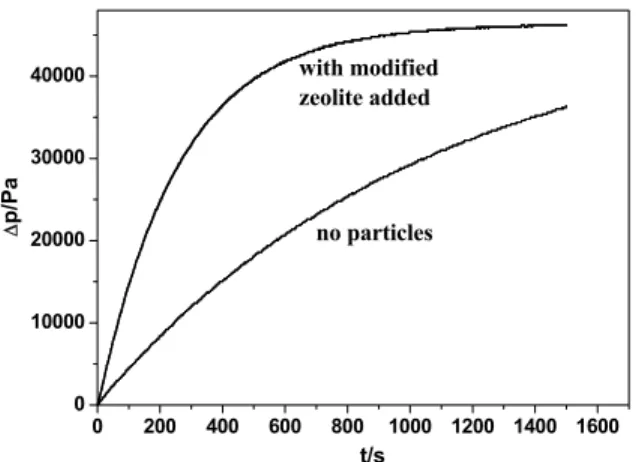
A typical variation curve of pressure difference with time is shown in Fig. 3. The slope of the curve at a given time is proportional to the absorption rate at that point of time. The experimental enhancement factor is defined as the ratio of the initial absorption rate with and without solid particles added, and the initial absorption rate can be calculated according to the slope of the Δp~t curve obtained at t=0.
From the experimental results, a contact angle of 65° for zeolite with SiO2/Al2O3=63 and 73° for
SiO2/Al2O3=86 was obtained. In contrast, when a
silicon to aluminum ratio, the greater the enhancement factors. The maximum enhancement factor for SiO2/Al2O3 =86 at the stirring speed of 2r/s
can reach 2.2. Another notable phenomenon is that, when the solid concentration reached a certain value, the enhancement factors for various cases no longer increased, instead, a gradual decline appeared.
In addition, the stirring speed also plays an important role in the absorption of CO2. From Fig. 4,
for modified zeolites, the higher the stirring speed, the lower the enhancement factors.
At low solid concentrations (<1.2kg/m3), in the slurries of zeolite (both modified and unmodified) in soybean oil and modified zeolite in cyclohexane, gas absorption did not show significant change. However, in the slurry of unmodified zeolite in cyclohexane, a weak enhancement of gas absorption by unmodified zeolite can be observed. In this work, to reduce experimental error, each experiment was
repeated at least three times, and an average was applied. Upon increasing the solid loading, a consistent slow decreasing trend of the absorption rate for all the cases could be observed.
According to Beenacker et al (1993), particles can enhance gas absorption for the following reasons: (1) Particles in the mass transfer zone adsorb the dissolved gas solute; (2) Particles in the mass transfer zone catalyze a chemical reaction involving the transferred gas component; (3) Used as reactants, particles in the mass transfer zone react with the transferred gas phase component. The absorption of CO2 in water is a
physical absorption, so to enhance the gas absorption, the solid particles must have good adsorbability to the gas solute. Resembling to the principle of “like dissolves like” in the dissolving process, there is also a rule of “like adsorbs like” for the adsorption process in the liquid phase, that is, the solute with similar properties to the adsorbent is more easily adsorbed.
0 200 400 600 800 1000 1200 1400 1600 0
10000 20000 30000 40000
no particles
Δ
p/P
a
t/s with modified zeolite added
Figure 3: Pressure difference of CO2 with batch time with and without particles added.
0.0 0.5 1.0 1.5 2.0 2.5 3.0 3.5 4.0 4.5 1.0
1.2 1.4 1.6 1.8 2.0 2.2
E
ms / kg.m-3
unmodified 2r/s, SiO2/Al2O3=63 4r/s, SiO2/Al2O3=63 2r/s,SiO2/Al2O3=86 4r/s,SiO2/Al2O3=86
0 2 4 6 8 10 12
0.9 1.0 1.1 1.2
E
ms/kg.m-3 unmodified zeolite in cyclohexane
unmodified zeolite in bean oil
modified zeolite in bean oil
modified zeolite in cyclohexane
Figure 4: Effect of unmodified and modified zeolites on the enhancement factors in aqueous solution.
Being polar adsorbents, the polar groups on the surface of unmodified zeolite particles can interact strongly with polar solvent molecules of water and soybean oil and, hence, the particles hardly adsorb the dissolved CO2 molecules any more. In contrast,
modified zeolites with a strong hydrophobicity have large non-polar zones on their surface. The weak interaction between non-polar groups of modified zeolite and polar solvent molecules results in a strong adsorbing effect for CO2 in water.
As a non-polar solvent, cyclohexane molecules may have a strong interaction with the non-polar groups on the surface of modified zeolite particles. Most surface active sites of modified zeolite were covered by cyclohexane molecules, leading to the
loss of adsorption capacity for CO2. However,
unmodified zeolite particles have only a weak interaction force with cyclohexane molecules, and thus can adsorb CO2 molecules and the enhancement
of gas absorption of CO2 in cyclohexane can be
observed. On the other hand, in soybean oil no
significant enhancement of CO2 absorption by
modified zeolite was found. This can be explained by the fact that modified zeolite may also have a strong adsorption to soybean oil due to its weaker polarity than water and hence reduce greatly the adsorption function to CO2.
To describe the effect of solid particles on gas absorption, many theoretical models were developed. According to the distribution characteristics of the dispersed phase, these models can be categorized as “homogeneous” and “heterogeneous” models, and “stationary” and “non-stationary” models based on the time dependence of all parameters. The advantage of homogeneous models is their numerical simplicity and less computer time compared with other models. However, neglecting the interaction between particles and the effect of time, the homogeneous model may lead to a wrong conclusion for some complex situations. The 1-D unsteady state and heterogeneous models were successively presented by Nagy (1995), Brilman et al (1998), Demmink et al (1998) and Shen et al (2007). A representative model is the SPRIA model presented by Demmink et al (1998) based on the surface renewal theory, which was applied to interpret the absorption enhancement of acetylene into aqueous solutions of iron chelates of HEDTA caused by the freshly precipitated sulfur particles. The firstly
3-D models were developed by Holstvoogd et al (1988) and Karve et al (1990). However, as steady state models, it is difficult to obtain a reasonable interpretation of the time dependence of the absorption process. Brilman et al (1999) innovatively presented a 3-D heterogeneous and non-steady state model based on their 1-D model. Subsequently, mass transfer enhancement was studied using 3-D models from different viewpoints by Zhang (2006) and Cai (2003) respectively.
A challenge in investigating the effect of solid particles on gas absorption is the strong interactions between the particles in suspensions. The higher the solid concentration, the stronger the influence of the interactions becomes. The effect of solid particles on mass transfer is a comprehensive result from the combined action of many particles. Thus, it is necessary to investigate the effect of a single particle and its interactions microscopically in order to understand the enhancement mechanism thoroughly and deeply. In view of this, we developed a 3-D microscopic mass transfer model.
Theoretical Simulations
Table 2 lists the values of the physical-chemical parameters used for the simulation, which are created according to the experimental results of zeolite with SiO2/Al2O3=86 in water. Typical simulation results
are presented in Figs. 6-9. The effect of different parameters and the particle-particle interaction are discussed.
Putting an adsorptive solid particle into the solution, the specific absorption rate around the particle will be improved due to the strong adsorption of the particle. This specific enhancement is dependent on many parameters such as the distance of the particle to the gas-liquid interface, the residence time and particle adsorptive capacity, etc. Fig. 6 shows the single-particle simulation results.
The effect of liquid-solid partition coefficient is given in Fig. 6 (a), and is defined as
p m
A0
amount of adsorbed gas per q unit volume of solid particles m
amount of absorbed gas per C
unit volume of liquid
ρ
= = (9)
Table 2: Experimental and estimated parameter values in the model presented (stirring speed: 2r⋅s-1)
qm
kmol/kg
kd
m3/kmol ks αmax
DA
m2/s
CA0
kmol/m3
SiO2/Al2O3=63 0.045 73 32 0.15
SiO2/Al2O3=86 0.068 102 41 0.18 1.95×10
0 20 40 60 80 100 120 140 160 180 1
2 3 4 5 6 7 8
E
y /μm
⎯ m=50
⋅⋅⋅⋅⋅ m=30
−− m=5
−⋅− m=2
−⋅⋅− m=1.2 t/tc=0.5
x/δ=0.1
0 20 40 60 80 100 120 140 160 180 0.8
1.0 1.2 1.4 1.6 1.8 2.0 2.2 2.4 2.6 2.8 3.0 3.2
E
y/μm
⎯ t/tc=0.05
−− t/tc=0.02
−⋅− t/tc=0.1
⋅⋅⋅⋅⋅ t/tc=0.2
m=1.5 x/δ=0.1
(a) The effect of liquid-solid partition (b) The effect of the contact time
0 20 40 60 80 100 120 140 160 180 0.5
1.0 1.5 2.0 2.5 3.0 3.5 4.0 4.5 5.0 5.5 6.0 6.5
E
y/μm
⎯ t/tc=0.3
−− t/tc=0.2
⋅⋅⋅⋅⋅ t/tc=0.1
−⋅− t/tc=0.05
m=30
x/δ=0.1
0 20 40 60 80 100 120 140 160 180 1.0
1.5 2.0 2.5 3.0 3.5
E
y/μm
⎯ x/δ =0.1
−− x/δ =0.3
⋅⋅⋅⋅⋅ x/δ =0.5 t/tc=0.05 m=30
(c) The effect of the contact time (d) The distance of the particle to the interface
Figure 6: The effect of various parameters on gas absorption enhancement.
The value of m represents the gas-adsorbing capacity of the particles, and the larger the value of m, the greater the particle capacity is. From Fig. 6(a), the enhancement factor decreases gradually with an increase of m, which may be explained by the saturation of the particles. When the particle is saturated during the gas-liquid contact time, it does not further enhance the mass transfer. In Fig. 6(a), the enhancement factor is almost 1 at t/tc=0.5 when
m=1.2. However, when particles show a large adsorptive capacity, they can remain unsaturated during the contact time at the interface. In this case, the effect of particle capacity will be reduced. From Fig. 6(a), the two curves of m=50 and m=30 are almost coincident at t/tc=0.5.
The adsorbing saturation can be further illustrated through the influence of the contact time on the enhancement factor, which is presented in Fig. 6(b) and Fig.6(c). For particles with low adsorptive capacity, before the particles get saturated, the specific enhancement factor increases with time. As time propagates, however, the particle gets saturated
and the specific enhancement factor decreases gradually. From Fig. 6(b), when t/tc=0.2, the specific
enhancement factor E(x,y,z,t) for particles with m=1.5 is almost equal to 1. On the other hand, if the particle capacity is large enough (Fig. 6(c)), the enhancement factor will always increase with the residence time.
In addition, the distance of the particle from the gas-liquid interface plays an important role in the mass transfer enhancement. As shown in Fig. 6(d), the particles farther from the interface exhibit a weaker influence on the enhancement factor. This can be explained by the lower concentration of the solute at a far distance from the interface, and when x/δ=0.5, the specific enhancement factor is lower than 1.5.
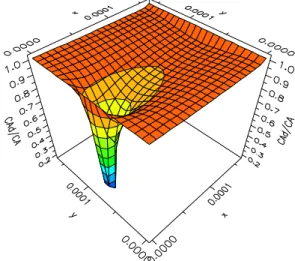
To investigate the effect of the particles on the concentration field more intuitively, a 3-D variation of the ratio of the concentration of the solute in slurry, CAd, and in blank solution, CA, on the surface
of z/δ=0.5 at t/tc=0.2 is shown in Fig. 7. It is clearly
the 7μm particle and the influence of the particle propagates a far distance along the x direction. This phenomenon indicates that the particle will have a large effect on particles nearby. The larger the particles, the stronger the influence will be.
Figure 7: 3-D variation of CAd/CA on the surface of
z/δ=0.5 at t/tc=0.2 for a particle of dp=7μm.
However, if the effect of the diameter is to be evaluated, liquid-solid interfacial area and adsorption saturation must be taken into account simultaneously. On the one hand, small particles induce large liquid-solid contact area but, on the other hand, these particles are easily saturated. Thus, it can be deduced that there will be an optimum size that is a function of adsorption capacity and liquid turbulence intensity.
Two-particle simulation results for several particle configurations are shown in Figs. 8a-c. The particle-particle interaction can be clearly observed in these figures. From Fig. 8a, the particle located directly behind the first one contributes marginally to the mass transfer enhancement due to the strong shielding action caused by the first particle. The effect of the second particle was almost covered up by the first particle. Moreover, due to the very low solute concentration behind the first particle, the enhancement factor at some places is even less than 1. In Fig.8(b), when the inter-particle distance (Ld) is 16μm, the peaks of the
specific enhancement factor for the two particles overlap almost completely at the surface of x/δ=0.1. As the distance increases, the inter-particle interactions gradually decrease. When the inter-particle distance reaches 50 μm (Fig. 8c), the two enhancement factor peaks may be considered to be separated completely, and two individual peaks are formed.
Based on these results, it can be deduced that, in suspensions, only at a very low solid concentration can the inter-particle interactions be neglected. For
hydrophobic solid particles, however, the solid concentration at the gas-liquid interface is much higher than that in the bulk. The interactions must be taken into account at the gas-liquid interface even when the solid concentration in the bulk is very low. A simple superposition of the effect of single particles on gas absorption is not accurate, and may lead to errors.
A multi-particle simulation (9 particles in all) is shown in Fig. 8 (d). The inter-particle interactions can be clearly observed. Despite the same particle diameter, the enhancement factor peak of the middle particle in the front row is obviously smaller than that at both sides. And even though the posterior particles are not located exactly behind the front particles, they are still subjected to a strong shielding effect from the front particles. The influence of the posterior particles on gas absorption was covered up by the particles in the front row.
Due to the overlap of the interaction zone of the particles and the shielding effect, the actual enhancement factor (E) is lower than that without considering inter-particle interactions (En). The
variation of the enhancement factor at different interface coverage is simulated in Fig. 9. From the result, the enhancement factor without interaction is much higher than that with interaction, and, with an increase of interface coverage, a monotone increase of
En was observed. However, due to the strong
interaction of particles, the real enhancement factor does not increase monotonically. According to Fig. 9, the enhancement factor begins to decrease gradually when the interface coverage is up to 0.12, which is consistent with the experimental results (Fig. 4).
In an absorption experiment, with the loading of the solid particle, the coverage of particle at the gas-liquid interface increases due to the hydrophobicity. The strong adsorption of the particles to the solute enhances the absorption rate. However, further increasing the interfacial coverage, the distance between particles will decrease, and the strong inter-particle interaction will hinder the increase of the enhancement factor. Thus, even though the solid concentration in the bulk is low (the effect of slurry viscosity can be neglected), a decrease of enhancement factor will also appear.
(a) Variation of the enhancement factor on the surface of z/δ=0.5 (Ld=20μm, dp=7μm)
(b) Variation of the enhancement factor on the surface of x/δ=0.1 (Ld=16μm, dp=7μm)
(c) Variation of the enhancement factor on the surface of x/δ=0.1 (Ld=16μm, dp=7μm)
(d) Variation of the enhancement factor on the surface of z/δ=0.5
Figure 8: Multi-particle simulation of the enhancement factor.
0.00 0.02 0.04 0.06 0.08 0.10 0.12 0.14 0.16 0.18 5
10 15 20 25
E E
n
E
α
Experimental Verification
Due to the random distribution of particles at the gas-liquid interface, it is impossible to evaluate every possible particle configuration. To simplify the numerical calculation, a uniform distribution of particles at the interface was assumed (Fig. 2). Thus, the number of particles in the balanced element can be calculated according to the measured particle size distribution and the concentration at the gas-liquid interface (Mehra, 1996). The absorption rate calculated in the liquid element can represent the overall absorption rate in the slurry.
In order to evaluate the effect of the particles by the model presented here, the parameters qm, kd, ks,
αmax and kp need to be previously defined. The
adsorption equilibrium constant kd and maximum
adsorption amount qm of solid particles are
determined experimentally: q is obtained by measuring the difference of the absorption amount of the solute in the slurry and in a blank solution, and then kd and qm are calculated by fitting the curves of
the experimental CA and q at different initial
pressures. The liquid-to-particle mass transfer coefficient kp is calculated from Sh=2 (Holstvoogd
and van Swaaij, 1990). The adhesion constants of the particles, ks and αmax refer to the results of Shen et al
(2007). The parameter values of modified zeolite in aqueous solution are given in Table 2.
0.0 0.5 1.0 1.5 2.0 2.5 3.0 3.5 4.0 4.5 1.0
1.2 1.4 1.6 1.8 2.0 2.2 2.4 2.6 2.8 3.0
E
ms/kg.m-3
SiO
2/Al2O3=63
SiO
2/Al2O3=86
⎯3-D model
−−3-D model without interaction
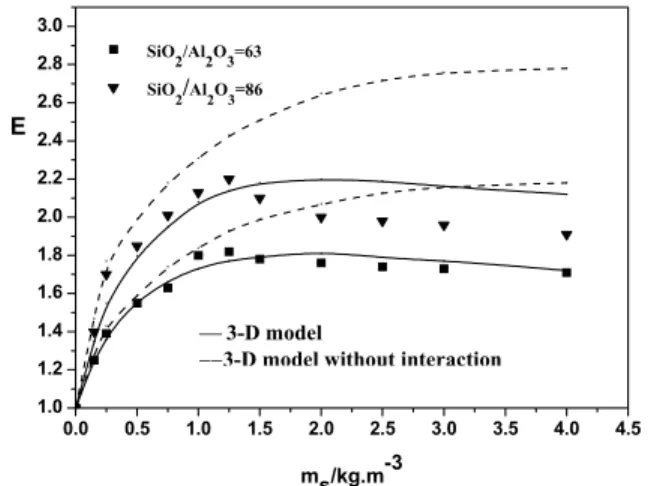
Figure 10: Comparison between the theoretical values and experimental data for CO2 absorption
enhancement by zeolite particles.
Figure 10 shows a comparison of the prediction from the model proposed here with the experimental results. From the results, significant enhancement of the gas absorption rate was obtained for modified zeolites, and the higher the silicon to aluminum ratio, the greater the enhancement factors due to the
increasing hydrophobicity. Having taken into consideration the particle-particle interaction, the calculation results based on the microcosmic model presented here agree well with the experimental data. However, the predictions from the model without the inter-particle interaction are much higher than the experimental results.
CONCLUSIONS
Zeolite was modified by framework element modification and the absorption enhancement of CO2
by unmodified and modified zeolite particles in different solvents (water, cyclohexane and soybean oil) was investigated. A 3-D microscopic mass transfer model was developed to interpret the experimental phenomena.
(1) After modification, zeolite can significantly
promote CO2 absorption in aqueous solution,
indicating that modified zeolite can be an alternative to activated carbon.
(2) Differences in the experimental results obtained in the three kinds of solvents show that the solid particles with good enhancement for gas absorption need not only high adsorptive capability but also a certain hydrophobicity.
(3) When calculating the enhancement factor theoretically, the inter-particle interaction must be taken into consideration.
(4) The results calculated by the present model agree well with the experimental data, indicating that the model is reasonable and applicable for theoretical prediction of the absorption enhancement.
NOMENCLATURE
CA solute concentration in the
liquid free from solid particles
mol⋅m-3
CA0 solute concentration at the
gas-liquid interface
mol⋅m-3
CAd solute concentration in the
slurry
mol⋅m-3
CAS equilibrium concentration of
the solute on the particle
mol⋅m-3
dp particle diameter m
DA diffusion coefficient m2⋅s-1
E enhancement factor dimensionless
En enhancement factor without
interaction
dimensionless
kd adsorption coefficient of the
solute in Eq. (6)
kp liquid-side mass transfer
coefficient
m⋅s-1
ks particle adhesion coefficient m3⋅kg-1
Ld the distance between two
particles
m
m liquid-solid partition
coefficient
dimensionless
ms particle concentration in the
slurry
kg⋅m-3
q adsorbed amount of the
solute on solid per unit mass of particle
mol⋅kg-1
qm maximum amount of
adsorbed solute
mol⋅kg-1
r radius m
rA chemical reaction rate mol⋅m-3⋅s-1
RA absorption rate mol⋅m-2⋅s-1
RA0 absorption rate in the liquid
free from particles
mol⋅m-2⋅s-1
V volume of the balance zone m3
t time s
tc residence time s
x ,y, z distance in x, y, z direction respectively
m
Greek Letters
α interfacial coverage dimensionless
αmax maximum interfacial
coverage
dimensionless
δ penetration depth m
ρp particle density kg⋅m-3
ACKNOWLEDGEMENTS
This work was supported by the National Natural Science Foundation of China (Grant No. 20176036).
REFERENCES
Alper, E., Wichtendahl, N., Deckwer, W. D., Gas absorption mechanism in catalytic slurry reactors. Chem. Eng. Sci., 35, No. 1-2, 217 (1980b). Baek, S. W., Kim, J. R., Ihm, S. K., Design of dual
functional adsorbent/catalyst system for the control of VOC’s by using metal-loaded hydrophobic Y-zeolites. Catalysis Today, 93-95, 575 (2004).
Beenackers, A. A. C. M., van Swaaij, W. P. M., Mass transfer in gas-liquid slurry reactors. Chem. Eng. Sci., 48, No. 18, 3109 (1993).
Brilman, D. W. F., Goldschmidt, M. J. V., Versteeg, G. F, van Swaaij, W. P. M., Heterogeneous mass transfer models for gas absorption in multiphase systems. Chem. Eng. Sci., 55, No. 15, 2793 (2000). Brilman, D. W. F., van Swaaij, W. P. M., Versteeg, G.
F., A one-dimensional instationary heterogeneous mass transfer model for gas absorption in multiphase system, Chem. Eng. Proc., 37, No. 6, 471 (1998).
Chen, N. Y., Hydrophobic properties of zeolites. The Journal of Physical Chemistry, 80, No. 1, 60 (1976). Cheng, H., Reinhard, M., Sorption of
trichloroethylene in hydrophobic micro pores of dealuminated Y zeolites and natural minerals. Environ. Sci. Technol., 40, No. 24, 7694 (2006). Dagaonkar, M. V., Heeres, H. J., Beenackers, A. A.
C. M., Pangarkar, V. G., The application of fine
TiO2 particles for enhanced gas absorption.
Chem. Eng. J., 92, No. 1-3, 151 (2003).
Demmink, J. F., Mehra, A., Beenackers, A. A. C. M., Gas absorption in the presence of particles showing interfacial affinity: case of fine sulfur precipitates. Chem. Eng. Sci., 53, No. 16, 2885 (1998).
Gokulakrishnan, N., Pandurangan, A., Sinha, P. K., Esterification of acetic acid with propanol isomers under autogeneous pressure: A catalytic activity study of Al-MCM-41 molecular sieves. Journal of Molecular Catalysis A: Chemical, 263, No.1-2, 55 (2007).
Higbie R., The rate of absorption of a pure gas into a still liquid during short periods of exposure. Transactions of the American Institute of Chemical Engineers, 31, No. 2, 365 (1935). Holstvoogd, R. D., van Swaaij, W. P. M., The
influence of adsorption capacity on enhanced gas absorption in activated carbon slurries. Chem Eng Sci, 45, No. 1, 151 (1990).
Holstvoogd, R. D., van Swaaij, W. P. M., van Dierendonck, L. L., The absorption of gases in aqueous activated carbon slurries enhanced by adsorbing or catalytic particles. Chem. Eng. Sci., 43, No. 8, 2181 (1988).
Kars, R. L., Best, R. J., Drinkonburg, A. A. A., The absorption of propane in slurries of active carbon in water. Chem. Eng. J., 17, No. 2, 201 (1979). Karve, S., Juvekar, V. A., Gas absorption into
slurries containing fine catalyst particles. Chem. Eng. Sci., 45, No. 3, 587 (1990).
Kaya, A. and Schumpe, A., Surfactant adsorption rather than “shuttle effect”? Chem. Eng. Sci., 60, No. 22, 6504 (2005).
zeolite on CO2 absorption enhancement. Chin. J.
Chem. Eng., 17, No. 1, 36 (2009).
Lu, S. M., Ma, Y. G., Zhu, C. Y., Shen, S. H., The
enhancement of CO2 chemical absorption by
K2CO3 aqueous solution in the presence of
activated carbon particles. Chin. J. Chem. Eng., 15, No. 6, 842 (2007).
Mehra, A., Gas absorption in reactive slurries: particles dissolution near gas-liquid interface. Chem Eng Sci, 51, No. 3, 461 (1996).
Nagy, E., Three-phase mass transfer: one-dimensional heterogeneous model. Chem. Eng. Sci., 50, No. 5, 827 (1995).
Ruthiya, K. C., Kuster, B. F. M., Schouten, J. C., Gas-liquid mass transfer enhancement in a surface aeration stirred slurry reactors. Can. J. Chem. Eng., 81, No. 5, 632 (2003).
Shen, S. H., Ma. Y. G., Zhu, C. Y., Lu, S. M., Absorption enhancement of carbon dioxide in aqueous activated carbon slurries. Journal of Chemical Industry and Engineering, (China), 58, No. 4, 835 (2007).
Takeuchi, M., Kimura, T., Hidaka, M., Rakhmawaty, D., Anpo, M., Photocatalytic oxidation of
acetaldehyde with oxygen on TiO2/ZSM-5
photocatalysts: Effect of hydrophobicity of zeolites. Journal of Catalysis, 246, No. 2, 235 (2007). Tsai, W. T., Hsu, H. C., Su, T. Y., Lin, K. Y., Lin, C.
M., Adsorption characteristics of bisphenol-A in aqueous solutions onto hydrophobic zeolite. Journal of Colloid and Interface Science, 299, No. 2, 513 (2006).
Vinke, H., Hamersma, P. J., Fortuin, J. M. H., Enhancement of the gas-absorption rate in agitated slurry reactors by gas-adsorbing particles adhering to gas bubbles. Chem. Eng. Sci., 48, No 12, 2197 (1993).
Wang, F. C., Study on Gas-Liquid Mass Transfer Enhancement by fine Particles in Slurry. Ph.D. Thesis, Tianjin University, Tianjin, China (2003). Wimmers, O. J., Fortuin, J. M. N., The use of
adhesion of catalyst particles to gas bubbles to achieve enhancement of gas absorption in slurry reactors - I. Investigation of particle-to bubble adhesion using the bubble pick-up method. Chem. Eng. Sci., 43, No. 2, 303 (1988).
Wimmers, O. J., Fortuin, J. M. H., The use of adhesion of catalyst particles to gas bubbles to achieve enhancement of gas absorption in slurry reactors - II. Determination of the enhancement in a bubble-containing slurry reactor. Chem. Eng. Sci., 43, No. 2, 313 (1988).