ABSTRACT
ORIGINAL AR
Lucia Helena de Azevedo
Cristina Stephan
Luciano Melo Pompei
Sérgio Peixoto
tool for women over 50 years old
Department of Gynecology and Obstetrics, Faculdade de Medicina do
ABC, São Bernardo do Campo, São Paulo, Brazil
CONTEXT AND OBJECTIVE: Osteoporosis is the greatest cause of quality-of-life reductions, morbidity and mortality among postmenopausal women, with growing incidence as populations age. Clinical tools like Osteorisk provide an easy-access and low-cost alternative method that helps physicians to reduce the need for dual-energy X-ray absorptiometry (DXA), the expensive gold standard examination for diagnosing osteopo-rosis. The aim here was to study the accuracy of Osteorisk using heel ultrasonography for bone mineral density (BMD).
DESIGN AND SETTING:Cross-sectional study, at Faculdade de Medicina do ABC.
METHODS: A structured questionnaire was applied to 615 postmenopausal women, with anthropometric measurements, Osteorisk calcu-lations and quantitative ultrasound on the heel using Sonost 2000 equipment.
RESULTS: 461 women were included, with mean age 60 ± 9 years, weight 67.6 ± 12.9 kg and body mass index (BMI) 28.8 ± 5.0 kg/m2. Their Osteorisk classifications were: 61.0% low-risk, 28.4% medium-risk and 10.6% high-risk. Quantitative ultrasound showed 81.3% low-risk, 10.0% medium-risk and 8.7% high-risk regard-ing osteoporosis. Statistically significant results were observed (p < 0.001) when Osteorisk was correlated with age, years since menopause and BMI. Correlating these same variables with quantitative ultrasound, statistically significant results were observed for age (p < 0.001), years since menopause (p < 0.001) and BMI (p < 0.006). The sensitivity, specificity, negative predictive value and positive predictive value for Osteorisk were 64%, 6.7%, 89% and 30.6%, respectively.
CONCLUSION: Osteorisk is a valid tool for screening for women at low risk of osteoporosis, making it possible for these women not to have to undergo densitometry.
KEY WORDS:Osteoporosis. Bone mineral den-sity. Screening. Ultrasonography. Risk factors. INTRODUCTION
Osteoporosis is a syndrome character-ized by low bone mass and deterioration of the bone microarchitecture, which results in greater fragility of the skeleton and increased risk of fractures.1 It is the most common
bone metabolism disease, affecting around 200 million people around the world, and it is the greatest cause of diminished qual-ity of life, morbidqual-ity and mortalqual-ity among postmenopausal women.1-3
Estrogen deficiency is responsible for 30 to 50% of the bone loss observed dur-ing women’s lives.3 In Brazil, it has been
estimated that 10 million individuals are affected by osteoporosis4 and that, because
of the greater ages attained by the population, the number of hip fractures among men and women between 50 and 60 years old will increase by 400% by 2050, in comparison with the prevalence in 1950.4 This signifies a
major public health problem with enormous financial cost relating to caring for this mor-bid condition.5-10 It has become important to
achieve early identification of individuals at greater risk of this disease, in order to imple-ment preventive measures.5-10
Osteoporosis diagnoses are made from bone mineral density (BMD) measurements. BMD measurements by means of dual X-ray absorptiometry (DXA), also known as bone densitometry, are considered to be the gold standard test for diagnosing this disease.8 Such
measurements provide high precision in evalu-ating the mineral density of the axial skeleton and enable precise decisions in relation to the treatment and follow-up for the disease. How-ever, DXA is not widely available within public healthcare, thereby making evaluations on all postmenopausal women logistically impos-sible and prohibitively expensive.2,8,11-14
To minimize such difficulties, new methods for measuring BMD have been developed and made available on the market.
These methods include peripheral DXA for forearm and heel measurements, peripheral quantitative computed tomography (QCT) for wrist and tibia studies, radiographic absorptiometry for fingers, and quantitative ultrasound or ultrasonometry (QUS) for heels and other areas.15
The availability of technology for evalu-ating bone mass by using peripheral sites in the skeleton has improved test accessibility because the technology is portable, faster, easier to perform and less costly. And most importantly, these methods can be used for calculating fracture risks both in peripheral and in central sites, with similar performance to central BMD measurements, except for calculations on the risk of hip fractures, which may be more precise with bone densitometry of the hip bone. The BMD of the peripheral skeleton, including the distal radius, phalanx and heel, correlates reason-ably well with the density of the axial skeleton (hip and spinal column).8,12
To have all postmenopausal women undergo these examinations with the aim of screening them for osteoporosis is impos-sible and not recommendable, considering that many women do not present any risk of osteoporosis and will not develop the disease.5,11,13 On the other hand, Siris et al.8
studied 200,160 American women over the age of 50 years who had undergone different peripheral BMD measurement methods and found that half of them did not know that they presented decreased BMD, while 7% presented osteoporosis. This finding is very important, because individuals diagnosed with osteoporosis have 2.74 times greater chance of presenting bone fractures within one year, and those with osteopenia have 1.73 times greater chance.6,8,9
have still not been defined, since the guidelines are insufficiently precise for selecting such women.5 One alternative would be to establish
a way of evaluating clinical risk factors that would identify women with greater likelihood of benefiting from such examinations. If these evaluations correctly differentiated the women who presented bone mass loss or osteoporosis from those with normal densitometry results, the need for bone densitometry examinations could be reduced.11-13,16
In the recent literature, there is a proven method for identifying osteoporosis risks that is easy to use and has low cost, called the “Osteorisk” risk assessment tool.17 Osteorisk
has been validated in Asia, Europe, the United States and Latin America, undergoing adjust-ments in accordance with each population studied.4 According to Sen et al., the sensitivity
of this method reaches 94% and the specific-ity, 45%.4 Osteorisk is based on a series of
statistical calculations and, using age and body weight variables allocated in a defined table, it allows the risk of osteoporosis to be classified as high, moderate or low. On the basis of these results, doctors can identify patients who are at greater risk of low bone mass and request examinations of higher complexity, and even begin therapy if it is impossible to undertake such examinations.4,5,11-13
The aim of Osteorisk is not to diagnose osteoporosis or osteopenia, but to identify women with a greater likelihood of developing low BMD, so that they can be advised to un-dergo bone densitometry examination. In this manner, the effectiveness of detecting patients with osteoporosis and osteopenia is increased and the wastage of unnecessary examinations is avoided.4,5,11-13,16
OBJECTIVE
In the present study, the objective was to compare BMD measurements obtained by means of quantitative ultrasound on the heel and by means of the Osteorisk method, among a population of postmenopausal women. Our aim was to confirm the ap-plicability of the Osteorisk index to our population, and thus to use it in daily medical practice within our service.
METHODS
Location and
population studied
This study was granted prior approval by the Research Ethics Committee of Faculdade de Medicina do ABC, and was conducted in the municipality of São Bernardo do Campo,
in the Greater São Paulo region, which is in southeastern Brazil. São Bernardo do Campo is a predominantly urban municipality with a population of approximately 700,000 inhab-itants.18 The study was carried out between
September and November 2005.
Inclusion and
exclusion criteria
For inclusion in the study, the women had to be over 50 years old and had to have been postmenopausal for at least six months, with or without climacteric symptoms. They had to have had no utilization within the last six months of medications such as estrogen, progestogen, androgen, aromatase inhibitor, bisphosphonates, calcium, corticoids, estrogen modulators, parathormone, fluorine, anticon-vulsants or lithium, or high doses of antacids. Women aged less than 50 years were excluded, as were those who presented se-vere bone pains, bone implants or histories of fractures, bone metabolism dysfunction, bone metastases, thyroid abnormalities or liver diseases.
Interview
The patients were called in to undergo ul-trasonometry on the heel by invitation issued by community health agents working for the city authorities of São Bernardo do Campo. A structured questionnaire was applied to the individuals who took up the invitation, and it was filled out on their behalf by doctors or medical students. Anthropometric mea-surements were also made. All the partici-pants were given explanations regarding the examination, and they signed a statement of free and informed consent. By the end of this recruitment period, 615 patients had been interviewed in the study, but 461 women were included in this study.
Detailed descriptions were obtained of any previous diseases among these patients, such as thyroid abnormalities, parathyroid abnormalities, diabetes mellitus, systemic arterial hypertension, rheumatoid arthritis, liver disease and intestinal malabsorption syn-dromes (neoplasias or gastrointestinal surgery causing reduced absorption). Likewise, details were obtained regarding previous or present use of corticosteroids, thyroid hormones and hormonal therapy.
Information was collected from each indi-vidual regarding personal or family histories of bone fractures and osteoporosis, socioeconomic level, habits such as smoking and alcohol use, profession, schooling level and physical activity. The interview also included obtaining
informa-tion regarding age, menarche, menopause and obstetric and surgical histories.
Anthropometric
measurements
Weight and height were measured using an anthropometric balance, with the patients in orthostatic position, wearing light clothes and without shoes. The body mass index was calculated by means of dividing the weight in ki-lograms by the square of the height in meters.
Osteorisk
Osteorisk is an index developed by Sen et al.4 to categorize the risk of osteoporosis
as low, medium or high. It was constructed from a study carried out in six centers in Latin America. After multivariate regression analysis of eight osteoporosis risk factors, a model us-ing only age and body weight was obtained. Based on this model, Osteorisk is calculated as 0.2 x [(body weight in kg) – (age in years)]. In the low-risk category, the Osteorisk index is greater than 1, while in the high-risk category it is less than –2 and in the medium-risk cat-egory it is greater than –2 and less than 1. The results are represented graphically to simplify their clinical use (not shown).4
Measurement of bone mass
Bone mass was measured from the sound velocity (meters per second), by means of ultrasonometry on the heel, using the Sonost 2000 equipment (United States, 2000). This portable apparatus uses gel as the conduction medium and is capable of measuring sound velocities in bones.
The measurement was done on the right heel for all patients. The examinations were performed by a single trained professional. The apparatus was calibrated daily.
The T-score for each individual was calcu-lated using the peak value for sound velocities for a given population of young adults, with standard deviation, by means of the following equation:19 T-score = sound velocity
(indi-vidual) – sound velocity (peak value for young adults)/standard deviation (peak value for young adults). The peak value for the sound velocities for young adults were calculated from an estimated peak bone mass, which was de-fined as the mean for the maximum bone mass attained by young healthy adults, matched for race and sex. The individual under examination was classified in the following manner:
Low risk: T-score higher than –1.5. Medium risk: T-score between –1.5 and –1.99.
To evaluate the sensitivity, specificity, positive predictive value (PPV) and nega-tive predicnega-tive value (NPV), the medium and high-risk results were grouped and considered together.
Statistical analysis
The data were summarized as means ± standard deviations in the case of quantitative variables, and as numbers and percentages for qualitative variables.
The concordance between the ultra-sonometry and Osteorisk results was evaluated by means of calculating Kappa statistics ac-companied by their respective 95% confidence intervals (95% CI).
The chi-squared test was utilized for evaluating associations between qualitative variables, and analysis of variance (ANOVA) for comparing the means of quantitative variables according to the Osteorisk or ultrasonometry categories. The Brown-For-sythe correction was used in cases in which the equality of variance test was rejected.20
For all the statistical analyses, a signifi-cance level of 5% (α = 0.05) was adopted. In other words, results that presented p-values less than 0.05 (p < 0.05) were considered to be significant.
The population sample size was calcu-lated by assuming an osteoporosis prevalence of 14.7%,21 from which a sample of 374
women was found to be necessary for a preci-sion of 0.035.
RESULTS
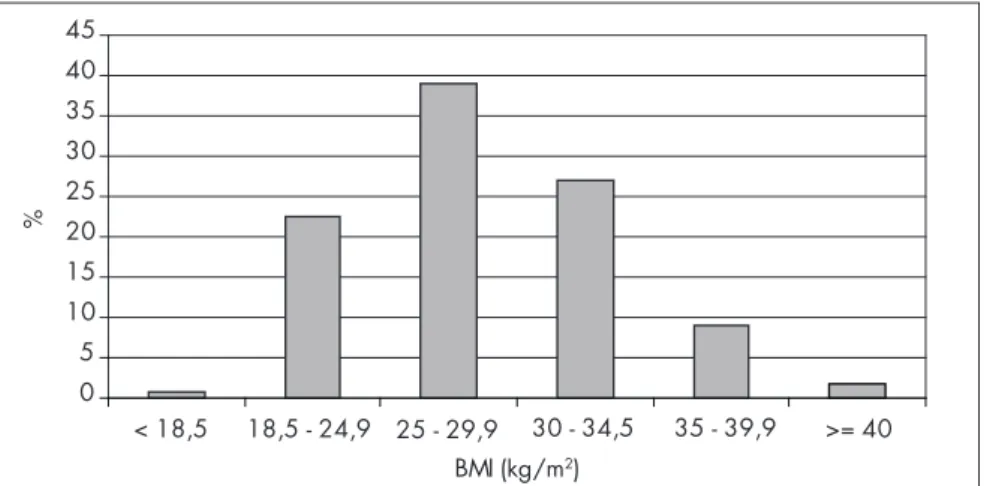
The number of women interviewed was 615. Of these, 154 did not fulfill the inclusion criteria or were within the exclusion criteria. Thus, the final sample was composed of 461 women. Their mean age (± standard deviation) was 60 ± 9 year (minimum = 45 and maximum = 90 years). Their mean weight was 67.6 ± 12.9 kg (minimum = 36 and maximum = 116 kg). Their body mass index (BMI) ranged from 15.8 to 53 kg/m2 and the mean BMI was
28.8 ± 5.0 kg/m2.
Figure 1 presents the distribution of the 461 women who took part in the study, according to their BMI classification. It can be seen that 180 (39%) of them were clas-sified as overweight (BMI between 25 and 29.9 kg/m2) and only three women (0.7%)
were underweight (BMI < 18.5).
The Osteorisk classification showed that 61% of the patients presented low risk, 28.4% medium risk and 10.6% high risk of osteoporosis, while ultrasonometry classified
0 5 10 15 20 25 30 35 40 45
< 18,5 18,5 - 24,9 25 - 29,9 30 - 34,5 35 - 39,9 >= 40 BMI (kg/m2)
%
Figure 1. Patient distribution according to body mass index (BMI) classification.
Table 1. Patient distribution according to quantitative ultrasound classification
Quantitative ultrasound classification n (%)
Low risk 375 (81.3%)
Medium risk 46 (10.0%)
High risk 40 (8.7%)
Total 461 (100.0%)
Table 2. Patient distribution according to Osteorisk classification
Osteorisk n (%)
Low risk 281 (61%)
Medium risk 131 (28.4%)
High risk 49 (10.6%)
Total 461 (100%)
Table 3. Patient distribution according to results obtained from Osteorisk and quantitative
ultrasound on the heel
Quantitative ultrasound
Osteorisk Low risk Medium risk High risk Total (Osteorisk)
Low risk 250 (54.2%) 20 (4.3%) 11 (2.4%) 281 (61.0%)
Medium risk 95 (20.6%) 21 (4.6%) 15 (3.3%) 131 (28.4%)
High risk 30 (6.5%) 5 (1.1%) 14 (3.0%) 49 (10.6%)
Total (quantitative ultrasound) 375 (81.3%) 46 (10.0%) 40 (8.7%) 461 (100.0%) 81.3% as low risk, 10% as medium risk and
8.7% as high risk (Tables 1 and 2).
Considering the ultrasonometry and Os-teorisk results together, it was seen that 54.2% of the patients were classified as low risk, 4.6% as medium risk and 3.0% as high risk by both Osteorisk and ultrasonometry (Table 3).
Analysis of Osteorisk in relation to age, BMI and
years since menopause.
For Osteorisk, statistically significant results were found in relation to analyses of age, BMI and years since menopause (Table 4). With regard to age, the high-risk
pa-Table 4. Age, body mass index and years since menopause (mean ± standard deviation)
according to Osteorisk
Osteorisk
p-value* Low risk
(n = 281)
Medium risk (n = 131)
High risk (n = 49)
Age (years) 56.2 ± 6.3 62.6 ± 8.4 74.4 ± 8.5 < 0.001
Body mass index (kg/m2) 30.9 ± 4.7 25.9 ± 3.4 24.0 ± 3.3 < 0.001
Years since menopause 8.4 ± 7.3 14.1 ± 9.4 26.1 ± 9.8 < 0.001
tients presented a mean age that was statistically greater than the ages presented by medium and low-risk patients. The medium-risk patients presented a greater mean age than that of the low-risk patients. For BMI, the high-risk patients presented a BMI that was statistically lower than the BMIs of the medium and low-risk patients. Regarding the number of years since the menopause, the high-risk patients presented a statistically greater number of years than did the medium and low-risk patients (Table 4).
Analysis of ultrasonometry
in relation to age, BMI and years since menopause
It can be seen from Table 5 that the ul-trasonometry showed significant differences with regard to the variables of age (p < 0.001), BMI (p = 0.006) and years since menopause (p < 0.001). Thus, patients with osteoporosis presented on average a statistically greater age than did the patients with osteopenia or a normal examination. The BMI statistically dif-ferentiated the normal patients from those with osteopenia and osteoporosis, although it was not capable of differentiating between the patients in the latter two groups. The number of years since menopause was statistically greater among the women with osteoporosis than among those with osteopenia and normal results.
Sensitivity, specificity, positive predictive value and
negative predictive value for Osteorisk
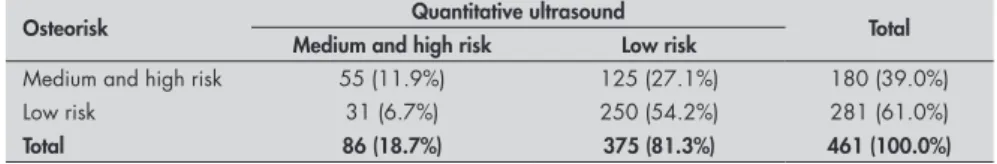
It can be seen from Tables 6 and 7 that Osteorisk had sensitivity of 64% for iden-tifying the women who were at low risk and specificity of 66.7% for identifying the women who were at medium and high risk of osteoporosis, taking ultrasonometry as the diagnostic reference. This produced a negative predictive value of 89% and a positive predic-tive value of 30.6%.
DISCUSSION
Early identification of patients who are at risk of osteoporosis is of great importance following the menopause. Preventive action by doctors signifies decreased morbidity-mortal-ity due to this disease and decreased public health cost.
Bone densitometry is recognized as the principal tool for diagnosing osteoporosis. The literature demonstrates that when this examination is available for osteoporosis prevention, this has an effect on the number of future fractures.6-9 Kern et al.22 showed
that when bone densitometry was used as a screening method for osteoporosis, there were 36% fewer fractures over a six-year period than when other medical care was utilized.
How-ever, indiscriminate screening of all patients by this method is impossible in Brazil because of its high cost and low availability, particularly for the social classes with lower income.
Today, there are methods like ultrasonom-etry on the heel that can be used for evaluating the risk of fracture, both at peripheral and at central sites, with performance resembling measurements of central BMD. The excep-tion to this is calculaexcep-tions of the risk of hip fractures, which are more precise with bone densitometry on the hip. The BMD of the peripheral skeleton, including the distal ra-dius, phalanx and heel, correlates reasonably well with the density of the axial skeleton (hip and spinal column, and the costs of obtaining these data are more accessible.2,8,23,24
In this light, we undertook a comparison between Osteorisk and ultrasonometry on the heel, among women living in São Bernardo do Campo, to evaluate the effectiveness of Osteorisk as a screening method for identify-ing the patients who were more susceptible to osteoporosis. We evaluated our population in relation to age, BMI and number of years since the menopause. In both the Osteorisk and the ultrasonometry analyses, all these variables presented statistical significance.
BMI has an inverse relationship with osteoporosis, and this was confirmed in our sample, both for Osteorisk and for ultra-sonometry. In both analyses, we observed that the low-risk patients had BMI that was statistically significantly greater than among those at high risk.
Age has a direct relationship with osteo-porosis, and this was confirmed in our study: low-risk patients as assessed by Osteorisk presented a mean age of 18.2 years lower than did the high-risk patients; and for ultrasonom-etry on the heel, 11.9 years. In relation to the number of years since the menopause too, our data were concordant with the literature, establishing a directly proportional relation-ship between the number of years since the menopause and osteoporosis. Low-risk pa-tients as assessed by Osteorisk presented 17.7 years less since the menopause than did those at high risk, and for ultrasonometry this value was 10.9 years.
If Osteorisk were to be proven satisfac-tory, it could be utilized as an alternative to screening by means of bone densitometry. According to Sen et al.,4 Osteorisk presented
sensitivity greater than 90% for identifying patients who were at risk of osteoporosis. We applied Osteorisk to the population studied and compared it with the results from quan-titative ultrasonometry on the heel, while
Table 5. Age, body mass index and years since menopause (mean ± standard
devia-tion) according to quantitative ultrasound
Quantitative ultrasound
p-value* Low risk
(n = 375)
Medium risk (n = 46)
High risk (n = 40)
Age (years) 58.7 ± 8.3 61.4 ± 8.8 70.6 ± 10.2 < 0.001
Body mass index (kg/m2) 29.1 ± 4.9 27.3 ± 4.5 26.9 ± 6.0 0.006
Years since menopause 10.5 ± 9.1 15.2 ± 10.1 21.4 ± 11.6 < 0.001
*Analysis of variance (ANOVA) using Brown-Forsythe correction.
Table 6. Correlation between Osteorisk and qualitative ultrasound, considering low
risk versus medium and high risk
Osteorisk Quantitative ultrasound Total
Medium and high risk Low risk
Medium and high risk 55 (11.9%) 125 (27.1%) 180 (39.0%)
Low risk 31 (6.7%) 250 (54.2%) 281 (61.0%)
Total 86 (18.7%) 375 (81.3%) 461 (100.0%)
Table 7. Sensitivity, specificity, positive predictive value and negative predictive value
for Osteorisk
Value 95% confidence interval
Sensitivity 64% [53.4%; 73.3%]
Specificity 66.7% [61.7%; 71.2%]
Negative predictive value 89.0% [84.8%; 92.1%]
maintaining the definitions of the World Health Organization.25 for osteoporosis,
os-teopenia and normal bone mass. These were established by measuring bone mass using bone densitometry and comparing this with a young population (T-score).2,19
One important matter that is still con-troversial is the precision of using peripheral measurements for evaluating bone mass, in comparison with the central measurements that are used by WHO.2,14,22,23 It has been observed
that, in using peripheral measurements (among which ultrasonometry on the heel), there is a lower percentage of osteoporosis identification than when BMD measurements on the axial skeleton are used.2,6,22,23 There are references in
the literature that defend and utilize a higher cutoff point of –1.8 standard deviations for identifying the risk of osteoporosis, when the BMD is evaluated by ultrasonometry. Through this, the percentage of osteoporosis identifica-tion would be very similar to what is found by conventional densitometry.2,6,22,23 On the basis
of this analysis, we chose in our study to take the women who were at high risk of osteoporosis to be those whose ultrasonometry values were lower than a T-score of –2.0, medium risk to be between –1.5 and –1.99 and low risk to be a T-score higher than –1.5. From this classifi-cation, ultrasonometry detected that 8.7% of the women were at high risk of osteoporosis. It should be emphasized that this value was close to the prevalence of osteoporosis identified in the literature by using bone densitometry, which ranges from 7 to 8%.2,22,23
We considered it to be of interest to evalu-ate the validation of the Osteorisk method
by identifying the risk of osteoporosis in comparison with ultrasonometry. The values obtained demonstrated sensitivity of 64% and specificity of 66.7% for identifying patients at medium and high risk of osteoporosis. The positive predictive value, which indicates the likelihood that medium and high-risk patients as assessed by Osteorisk are really medium and high-risk using ultrasonometry, was 30.6%. The negative predictive value, which indi-cates the likelihood that low-risk patients as assessed by Osteorisk are really low-risk using ultrasonometry, was 89%.
Assessing the results, we noted that Oste-orisk presented a false negative rate of 36%, in comparison with ultrasonometry. This represents a limitation to the use of this clinical tool, be-cause such patients would fail to be diagnosed, since they would be erroneously considered to be at low risk. It would be of interest to have greater sensitivity in order to use Osteorisk with assurance. Nonetheless, it must not be neglected that Osteorisk also presented a high negative predictive value and would correctly select 64% of the patients who were identified by means of dual X-ray absorptiometry (DXA).
We are aware that our conclusions leave room for criticism. In our defense, we must first cite the fact that our study population included individuals of black race and thus differed from the population evaluated by the authors of the Osteorisk method, which did not include such individuals.4 It is known
that ethnic origin has a relationship with osteoporosis, which is more prevalent among Caucasians and less so among Africans.4,8,14 We
can also cite the fact that 77% of the women
in our population had a BMI of more than 25 kg/m2. This is highly relevant for the
sample, since one of the variables for Osteorisk is precisely the weight.
We are also aware that ultrasonometry on the heel is not a gold standard for evalu-ating BMD and that its real effectiveness in identifying osteoporosis is not totally defined.2,8,14,16,22,23 Studies have highlighted
its usefulness for identifying patients who are at risk of fractures, but even this idea is not fully grounded. In the national osteoporosis risk assessment (NORA) study, peripheral measurements on patients who presented fractures after 12 months of follow-up showed that only 18% of these patients would have received treatment for fractures if the cutoff criterion had been T-score ≤ 2.5, and 22.6% using the criterion of the National Osteopo-rosis Foundation (NOF).8 Perhaps alteration
of the evaluation cutoff point for peripheral measurements, as already described, would be a viable solution that would increase the effec-tiveness of these measurements for identifying osteoporosis and risks of fractures. Studies in Latin America, and especially in Brazil, comparing Osteorisk and ultrasonometry on the heel with bone densitometry would be of great importance for validating these diagnostic methods.
CONCLUSION
1. Lin JT, Lane JM. Osteoporosis: a review. Clin Orthop Relat Res. 2004;(425):126-34.
2. Vu TT, Nguyen CK, Nguyen TL, et al. Determining theDetermining the prevalence of osteoporosis and related factors using quantita-tive ultrasound in Vietnamese adult women. Am J Epidemiol. 2005;161(9):824-30.
3. Fernandes CE, Wehba S, Melo NR. Osteoporose pós-menopáu-sica. In: Oliveira HC, Lemgruber I, editors. Tratado de Gineco-logia Febrasgo. Rio de Janeiro: Revinter; 2001. p. 679-93. 4. Sen SS, Rives VP, Messina OD, et al. A risk assessment toolA risk assessment tool
(OsteoRisk) for identifying Latin American women with osteoporosis. J Gen Intern Med. 2005;20(3):245-50. 5. Cadarette SM, Jaglal SB, Kreiger N, McIsaac WJ, Darlington
GA, Tu JV. Development and validation of the Osteoporosis Risk Assessment Instrument to facilitate selection of women for bone densitometry. CMAJ. 2000;162(9):1289-94. 6. Miller PD, Barlas S, Brenneman SK, et al. An approach toAn approach to
identifying osteopenic women at increased short-term risk of fracture. Arch Intern Med. 2004;164(10):1113-20. 7. Lacroix AZ, Buist DS, Brenneman SK, Abbott TA 3rd.
Evalua-tion of three populaEvalua-tion-based strategies for fracture prevenEvalua-tion: results of the osteoporosis population-based risk assessment (OPRA) trial. Med Care. 2005;43(3):293-302.
8. Siris ES, Miller PD, Barrett-Connor E, et al. Identification and fracture outcomes of undiagnosed low bone mineral density in postmenopausal women: results from the National Osteoporosis Risk Assessment. JAMA. 2001;286(22):2815-22. 9. Siris ES, Chen YT, Abbott TA, et al. Bone mineral densityBone mineral density
thresholds for pharmacological intervention to prevent fractures. Arch Intern Med. 2004;164(10):1108-12.
10. Buist DS, LaCroix AZ, Manfredonia D, Abbott T. Iden-tifying postmenopausal women at high risk of fracture in populations: a comparison of three strategies. J Am Geriatr Soc. 2002;50(6):1031-8.
11. Wehren LE, Siris ES. Beyond bone mineral density: can existing clinical risk assessment instruments identify women at increased risk of osteoporosis? J Intern Med. 2004;256(5):375-80. 12. Richy F, Deceulaer F, Ethgen O, Bruyère O, Reginster JY.
Development and validation of the ORACLE score to predict risk of osteoporosis. Mayo Clin Proc. 2004;79(11):1402-8. 13. Salaffi F, Silveri F, Stancati A, Grassi W. Development and
valida-tion of the osteoporosis prescreening risk assessment (OPERA) tool to facilitate identification of women likely to have low bone density. Clin Rheumatol. 2005;24(3):203-11.
14. Rothenberg RJ, Boyd JL, Holcomb JP. Quantitative ultrasound of the calcaneus as a screening tool to detect osteoporosis: different reference ranges for caucasian women, african-american women, and caucasian men. J Clin Densitom. 2004;7(1):101-10. 15. Blake GM, Fogelman I. Clinical use of instruments that
measure peripheral bone mass. Parathyroids and bone and mineral metabolism. Curr Opin Endocrinol Diabetes Obes. 2002;9(6):502-11. Available from: http://www.co-endocrinol-ogy.com/pt/re/coendo/abstract.00060793-200212000-00010. htm;jsessionid=H0GK9n2dJG5nznPpgK4J31tTdqQRxlNnn KZ9FZCzHvw2bySKCq4j!1821113646!181195629!8091!-1. Accessed in 2007 (Nov 9).
16. Geusens P, Hochberg MC, van der Voort DJ, et al. Performance of risk indices for identifying low bone density in postmeno-pausal women. Mayo Clinic Proc. 2002;77(7):629-37. 17. Koh LK, Sendrine WB, Torralba TP, et al. A simple tool to iden-A simple tool to
iden-tify asian women at increased risk of osteoporosis. Osteoporos Int. 2001;12(8):699-705.
18. Brasil. Ministério do Planejamento , Orçamento e Gestão. Instituto Brasileiro de Geografia e Estatística. População residente, por sexo e população cedida, segundo o código e o município — São Paulo. Available from: http://www1.ibge. gov.br/home/estatistica/populacao/contagem/spcont97.shtm. Accessed in 2008 (Jan 7).
19. Cheng S, Fan B, Wang L, et al. Factors affecting broadband ultrasound attenuation results of the calcaneus using a gel-coupled quantitative ultrasound scanning system. Osteoporos Int. 1999;10(6):495-504.
20. Altman DG. Comparing Groups – Continous and Categorical Data In: Altman DG, ed. Practical statistics for medical research. London: Chapman & Hall/CRC; 1991. p. 179-223. 21. Costa-Paiva L, Horovitz AP, Santos AO, Fonsechi-Carvasan GA,
Pinto-Neto AM. Prevalência de osteoporose em mulheres na pós-menopausa e associação com fatores clínicos e reprodutivos. {Prevalence of osteoporosis in postmenopausal women and association with clinical and reproductive factors]. Rev Bras Ginecol Obstet. 2003;25(7):507-12.
22. Kern LM, Powe NR, Levine MA, et al. Association betweenAssociation between screening for osteoporosis and the incidence of hip fracture. Ann Intern Med. 2005;142(3):173-81.
23. Frost ML, Blake GM, Fogelman I. Can the WHO criteria for diagnosing osteoporosis be applied to calcaneal quantitative ultrasound? Osteoporos Int. 2000;11(4):321-30. 24. Frost ML, Blake GM, Fogelman I. Contact quantitative
ul-trasound: an evaluation of precision, fracture discrimination, age-related bone loss and applicability of the WHO criteria. Osteoporos Int. 1999;10(6):441-9.
25. Assessment of fracture risk and its application to screening for postmenopausal osteoporosis. Report of a WHO Study Group. World Health Organ Tech Rep Ser. 1994;843:1-129.
Sources of funding:None
Conflicts of interest: Assistance was received in the form of the Sonost 2000 ultrasonometry equipment, which was supplied by the Lilly Laboratory
Date of first submission:February 27, 2007 Last received:January 7, 2008 Accepted:January 7, 2008
REFERENCES
AUTHOR INFORMATION
Marcelo Luis Steiner, MD. Postgraduate student in Health Sciences, Faculdade de Medicina do ABC, São Bernardo do Campo, São Paulo, Brazil.
César Eduardo Fernandes, MD, MSc, PhD. Head of the En-docrine Gynecology and Climacteric Sector, Department of Gynecology and Obstetrics, Faculdade de Medicina do ABC, São Bernardo do Campo, São Paulo, Brazil. Rodolfo Strufaldi, MD.Assistant lecturer, Department of
Gy-necology and Obstetrics, Faculdade de Medicina do ABC, São Bernardo do Campo, São Paulo, Brazil.
Lucia Helena de Azevedo, MD, MSc, PhD.Attending physi-cian, Endocrine Gynecology and Climacteric Sector, Department of Gynecology and Obstetrics, da Faculdade de Medicina do ABC.
Cristina Stephan, MD, MSc.Attending physician, Endocrine Gynecology and Climacteric Sector, Department of Gyne-cology and Obstetrics, Faculdade de Medicina do ABC, São Bernardo do Campo, São Paulo, Brazil.
Luciano Melo Pompei, MD, MSc, PhD.Attending physician, Endocrine Gynecology and Climacteric Sector, Department of Gynecology and Obstetrics, Faculdade de Medicina do ABC, São Bernardo do Campo, São Paulo, Brazil. Sérgio Peixoto, MD, MSc, PhD. Titular professor, Department of
Gynecology and Obstetrics, Faculdade Medicina do ABC, São Bernardo do Campo, São Paulo, Brazil.
Address for correspondence: Marcelo Luis Steiner
Rua Dr. Miranda de Azevedo, 1.059 São Paulo (SP) — Brasil — CEP 05027-000 Tel. (+55 11) 3871-2058 — Fax. (+55 11) 3825-9315 — Cel. (+55 11) 9295-6348
E-mail: [email protected]
Copyright © 2008, Associação Paulista de Medicina
RESUMO
Estudo da acurácia do “Osterisk”: uma nova ferramenta clínica para o rastreamento da osteoporose em mulheres acima de 50 anos
CONTEXTO E OBJETIVO: Osteoporose é a principal causa de redução de qualidade de vida, morbidade e mortalidade entre as mulheres no climatério, com aumento na incidência conforme o envelhecimento da população. Ferramentas clínicas como Ostorisk fornecem uma alternativa de acesso fácil e de baixo custo que ajudam o clínico a melhorar a eficácia da solicitação da densitometria óssea, exame padrão ouro, porém caro para o diagnóstico de osteoporose. O objetivo deste artigo foi estudar a acurácia do Ostorisk tendo a ultrassonometria de calcâneo como método de avaliação da densidade mineral óssea. TIPO DE ESTUDO E LOCAL: Estudo transversal, na Faculdade de Medicina do ABC.
MÉTODO: Um questionário estruturado foi aplicado em 615 mulheres menopausadas, com medidas antropométricas, cálculo do Osteorisk e realização de ultrassonometria quantitativa do calcâneo com o aparelho Sonost 2000.