Relationship between body
mass index and
self-perception among university
students
ABSTRACT
OBJECTIVE: To assess the relationship between body mass index and
self-perception of body image.
METHODS: A study was carried out in a sample comprising 106 female and male
university students aged 18 years or more in Ribeirão Preto, Southeastern Brazil, in 2003. The Contour Drawing Rating Scale and Visual Analogue Scale were used to evaluate body image perception; the former was applied using two different psychometric methods. A body image questionnaire was used to assess the subjective component of body image. Subjects were classified according to body mass index. Statistical analyses were performed through variance analysis and Newman-Keuls
post-hoc test.
RESULTS: Most normal weight or overweight women (87%) overestimated their
body size while obese women and all men (73%), regardless of their BMI, underestimated their body size. The differences of body image perception between men and women were statistically significant as well as the overall dissatisfaction with their perceived body size, revealed by a desired lower body mass index. Overweight women were more concerned and uncomfortable with their own body.
CONCLUSIONS: Both men and women had a distorted self-perception of body
image, underestimating or overestimating it. The study results suggest dissatisfaction of subjects with their body image as they desire to have leaner bodies.
KEYW O RD S: Body image. Self-concept. Body contitution. Body mass index. Adult.
Idalina Shiraishi Kakeshita Sebastião de Sousa Almeida
Departamento de Psicologia e Educação. Faculdade de Filosofia, Ciências e Letras de Ribeirão Preto. Universidade de São Paulo. Ribeirão Preto, SP, Brasil
Correspondence:
Sebastião de Sousa Almeida
Laboratório de Nutrição e Comportamento Departamento de Psicologia e Educação Av. dos Bandeirantes, 3900
14040-901 Ribeirão Preto, SP, Brasil E-mail: [email protected]
INTRODUCTION
The relationship between eating disorders and body image self-perception is well documented in the lit-erature.17,19 However, Leonhard & Barry16 notes that studies on body image distortion and dissatisfaction have mostly focused on subjects with specific eating disorders (bulimia, anorexia nervosa and morbid obesity). It has recently been described a similar body image distortion in normal weight individuals with-out any specific eating disorders.
Body image is an important element of the intricate mechanism of one’s own identity. Gardner11 defines it as “the mental picture we have of our body’s measures, contours and shape; and our feelings related to these characteristics and to our body parts”. The subjective component of body image refers to one’s satisfaction with their own body size or specific body parts.
Sociocultural theories on body image disorders fo-cus on influences of a body social and culturally established as ideal, expectations and experiences, as well as the etiology and prevalence of body im-age disorders. Thus, it is important to highlight the negative impact of mass media. Research has evi-denced a conflict between the ideal beauty set by modern societies and the general somatotype and the burden created by such model.14 The sociocul-tural environment seems to be an important vari-able in the development of distortions and subjec-tive body image disorders.
Nutritional status reflects the level at which physi-ological nutrient requirements are reached. Routine evaluation of nutritional status should be carried out in primary care settings for it allows to prevent sev-eral conditions besides being an important indicator of the need for education activities and interventions.8 The body mass index (BMI), or Quetelet index [body weight (kg)/height2 (m)], is the most common meas-ure used in population-based studies for primarily categorizing nutritional status.4 Likewise, research assessing body image self-perception has used BMI as an indicator of nutritional status associated with determinants of body weight-related behaviors.10,15
As environmental and socio-cultural changes seen in the last decades have an important role in increasing obesity rates,3,20 it is crucial to know the determinants of nutritional status, i.e., the symbolic universe and subjective elements pervading people’s life style and eating behaviors. Identifying and measuring the mag-nitude of body image self-perception distortions would be relevant for the clinical evaluation of those indi-viduals at risk of developing obesity.
In that regard, the contour drawings scale is a highly effective instrument for assessing people’s level of dissatisfaction with their body weight and body size while evaluating the perceptual component of body image.12,13,17 It is a helpful instrument for exploring ideal body image and objective image, particularly among overweight and obese individuals or those struggling to maintain their weight and control their eating behaviors.
For preventing and reducing excess weight, the effi-ciency and efficacy of strategies to be designed and applied in the clinical practice and for disseminating information to the general population rely on one’s realistic perception and self-awareness of their own body based on a real body size. This can be a valu-able instrument in outpatient settings as an additional tool for clinically evaluating those seeking profes-sional help due to body weight concerns.
However, most studies published have focused on the relationship between body image and BMI in sub-jects diagnosed as having eating disorders,1,2,5,16,18 mental disorders24 or even those engaged in physical activities.9 Besides, most Brazilian studies on body image have used contour drawing scales developed and validated elsewhere for assessing individuals with different biotypes from Brazilian ones.2,9
The present study aimed at evaluating the relation-ship between BMI and body image self-perception in both female and male university students.
M ETH O D S
Given the standard psychophysical method widely validated for the evaluation of perception, the results were quite consistent among subjects allowing to study a relatively small sample. Statistical estimates based on the prevalence of normal weight, overweight and obese adults in the Brazilian population yielded a sample size of at least 100 subjects. To ensure the inclusion of subjects from all socioeconomic strata there were selected one public and one private uni-versity in Ribeirão Preto, Southern Brazil. Data was first collected from 116 university students (51 males and 65 females) aged over 18 years, following an even distribution of at least five subjects in each of the nine BMI intervals corresponding to each drawing of the rating scale.
While the inclusion criterion was 18.5 kg/m2 <BMI <40.0 kg/m2, the study contour drawing rating scale showed BMIs ranging between 17.5 and 37.5 kg/m2. This allowed to assess body image distortion, since the literature shows that people tend to report a lower BMI than their actual one. Therefore, even those sub-jects with BMI of 18.5 kg/m2 could select contour drawings corresponding to BMI lower that their ac-tual one.
After excluding the 10 cases mentioned above, the study sample comprised 106 subjects, 49 males and 57 females, based on the distribution of prevalence of normal weight, overweight and obese individuals among Brazilian adults.
Data collection was carried out in classrooms pro-vided by the universities and comprised the applica-tion of contour drawing tests using three different psychometric methods, weight and height measures and self-administration of a questionnaire on body image (Body Shape Questionnaire, BSQ). All data were collected in 2003 by one investigator, trained in the use of the study instruments.
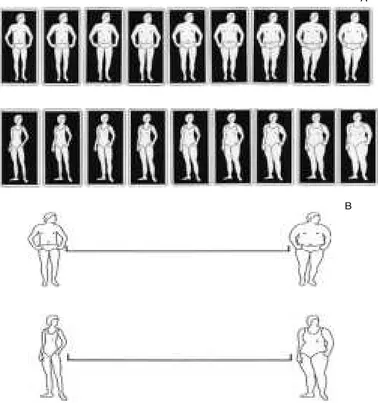
The contour drawing scale comprises a set of nine contour drawings of each gender presented in sepa-rate cards showing escalating measures, from leaner to wider drawings, and mean BMI ranging
between 17.5 and 37.5 kg/m2. This scale was especially conceived for this study using computer graphics based on real human mod-els of corresponding BMIs that had their pic-ture taken by a professional photographer. Gardner’s et al12 (1998) methodological rec-ommendations on contour drawing compo-sition were followed (Figure A).
The first psychometric method (“choice”) applied consisted in asking subjects to pick one card, from a set of cards displayed in as-cending order, which would better describe their own body contour at that time. Then subjects were asked to point out the card with their desired body contour.
The second method applied (“absolute threshold”) was constant stimuli23 when cards were displayed in five random series, and the same sequence was preset and similar to all subjects. They were asked to “select the drawing corresponding to their current con-tour” and “select a drawing that would corre-spond to their desired contour”.
The third method applied (visual analogue scale, VAS) comprises a visual analogue scale with two con-tour drawings and was developed by taking the up-per and lower limit drawings (one for each gender) from the nine contour drawing scale, linked by a 12-cm continuous line, as proposed and validated by Gardner11 and Gardner et al12 (Figure B). Subjects were asked to make a vertical mark on the scale point that would feel most closely to their body size. As BMIs of both drawings displayed were known, the BMI of the subject’s mark on the continuous line could be estimated.
Weight was measured using an electronic calibrated scale (Kratos-Cas, Brazil) and subjects were weighed wearing light clothes, barefoot and carrying no heavy objects. Height was measured using a portable an-thropometer (Kratos-Cas, Brazil) set against the wall, ensuring their accurate posture before reading the fixed marker.
Subjects were then asked to carefully read and answer the BSQ. The BSQ was developed by Cooper et al6 and translated into Portuguese by Cordás,7 and evaluates people’s concerns about their body shape, self-depre-ciation of one’s appearance and feeling of being “fat”. The BSQ was also validated by Di Pietro* (2001) in a population of Brazilian university students. The BSQ
Figure - Contour drawing scale (A) and visual analogue scale (B).
A
B
is a self-administered questionnaire with 34 questions. Each question has 6 possible answers: 1) Never, 2) Rarely, 3) Sometimes, 4) Often, 5) Very often and 6) Always. Body image distortion can be mild (70 to 90), moderate (90 to 110), or severe (>110).
BMI categories for both female and male subjects were based on actual weight and height data collected as well as the World Health Organization (WHO) pa-rameters,25 as follows: Class 1 - Subjects with BMI between 18.5 and 24.9 kg/m2 were categorized as normal weight; Class 2 - Subjects with BMI between 25 and 29.9 kg/m2 were categorized as overweight; and Class 3 - Subjects with BMI >30 kg/m2 were cat-egorized as obese.
Test-retest reliability of contour drawing scale meas-ures was conducted in 73 female and male adult sub-jects from different socioeconomic strata and educa-tional backgrounds. Subjects were asked to select a contour drawing in a first step (test) and then, in a second step, they were asked to do the same again, one month later (retest).
Statistical analysis was carried out using SPSS 12.0 software. Data measures were described as median and 95% confidence intervals (95% CI). Cronbach’s alpha was used for estimating test-retest reliability. Kolmogorov-Smirnov (Lilliefors) goodness-of-fit test showed 0.084 with 106 degrees of freedom at p>0.05, indicating normal distribution. Based on these re-sults, the study data were then analyzed using one factorial variance analysis (ANOVA) (BMI classes) for each method used and a two factorial ANOVA (BMI class and gender) for BSQ data and differences be-tween current and actual BMI and bebe-tween current and desired BMI. Hence, not only the main effects of class and gender but also interactions between class and gender were obtained. When applicable, the Newman-Keuls post-hoc test was used for multiple comparisons. A 5% significance level was set.
The study was approved by the Research Ethics Com-mittee of Ribeirão Preto School of Philosophy, So-cial Sciences and Languages, University of São Paulo, and subjects were previously communicated.
RESU LTS
The test-retest reliability results showed high corre-lation between test and retest performed a month later, Cronbach’s alpha was 0.93 and the correlation coef-ficient was 0.87(95% CI: 0.79-0.91).
Table shows the overall results by gender. All meas-ures of perception scales are in kg/m2. Subjects were
grouped regardless of age as statistical analysis showed no effect of their age.
Among women, the results of the selection of a draw-ing corresponddraw-ing to their current contour were sta-tistically significant for BMI class in the choice method (CM) [F(2.54)=38.76; p<0.001], VAS [F(2.54=10.63; p<0.001] and absolute threshold (AT) [F(2.54)=24.99; p<0.001] method. The post-hoc analysis showed that, regardless of the method used, women in Class 1 had lower means compared to those in Class 2 and 3, and those in Class 2 had lower means compared to those in Class 3 (p<0.05), suggesting a relationship between actual BMI and their percep-tion of current BMI (Table).
The deviation between desired BMI (target) and ac-tual BMI showed significant effect of BMI class in CM [F(2.54)=51.44; p<0.001] and AT [F(2.54)=57.57; p<0.001]. The post-hoc analysis showed that, in both CM and AT, women’s dissatisfaction with their body image proportionally increased as their BMI class increased (Table). Thus women’s dissatisfaction in Class 1 is lower than that of those women in Class 2 and 3 (p<0.05).
The deviation between current BMI and actual BMI (Table) in women showed statistically significant ef-fects of BMI class in CM [F(2.54)=15.16; p<0.01], VAS [F(2.54)=10.63; p<0.01] and AT [F(2.54)=17.84; p<0.01]. In CM, the post-hoc analysis showed greater deviation in Class 1 compared to Class 2 and 3 (p<0.05). In VAS, the post-hoc analysis showed a smaller deviation in Class 3 compared to Class 1 and 2 (p<0.05). Lastly, in AT, the post-hoc analysis re-vealed greater deviation in Class 1 compared to Class 2 and 3 (p<0.05). These results showed that both nor-mal weight (Class 1) and overweight women (Class 2) overestimated their body size, contrasting with obese women (Class 3) who underestimated their body size.
Among men, the effect of BMI class for current body image self-perception was also significant in CM [F(2.46)=58.32; p<0.001]; VAS [F(2.46)=45.07; p<0.001] and AT [F(2.46)=36.69; p<0.001]. The post-hoc analysis showed that, regardless the method used, men in Class 1 had lower means compared to those in Class 2 and 3 (p<0.05), suggesting an asso-ciation between actual BMI and perception of cur-rent BMI (Table).
with their body image (or body image distortion) pro-portionally increased as BMI classes increased. Simi-lar to that seen among women, dissatisfaction in Class 1 was lower than in Classes 2 and 3 (p<0.05).
The deviation between actual BMI and current BMI showed statistically significant effect of BMI class in AT only [F(2.46)=7.29; p<0.01]. The post-hoc analysis indicated a signif icant effect in Class 3 compared to Class 1 and 2, i.e., differentiating obese men only (Table).
The two factorial ANOVA (class and gender) showed significant effect of class [F(2.100)=98.27; p<0.001] and gender [F(1.100)=25.34; p<0.001] as well as an interaction between class and gender [F(2.100)=4.34; p<0.01] for current perception of body image in CM. The post-hoc analysis showed that both in Class 1 and Class 2 women chose contour drawings with BMI significantly higher than men (p<0.05) but this gen-der difference was not seen in Class 3 (Table).
The two factorial ANOVA (class and gender) showed significant effect of class [F(2.100)=9.11; p<0.01] and gender [F(1.100)=34.67; p<0.001] as well as an
inter-action between class and gender [F(2.100)=3.27; p<0.01] for the difference between current percep-tion of body image and actual BMI in CM. The post-hoc analysis showed that both in Class 1 and Class 2 the deviations were signif icantly higher among women when compared to men (p<0.05). This gender difference was not seen in Class 3 (Table).
In regard to dissatisfaction with one’s body image, expressed as the deviation between the desired BMI (target) and current BMI in CM, ANOVA showed sig-nificant effect of class [F(2.100)=57.63; p<0.001] and gender [F(1.100)=6.44; p<0.01] as well as an interac-tion between class and gender [F(2.100)=5.07; p<0.01]. The post-hoc analysis showed a significant deviation between women and men in Class 1 (p<0.05) and no difference in Classes 2 and 3 (Table).
The results of the questionnaire on body image showed significant effects of gender [F(1.100)=23.79; p<0.001] and class [F(2.100)=7.75; p<0.001] but no interaction between these two factors (Table). The post-hoc analysis showed that women had higher scores compared to men (p<0.05) and among men only these scores increased as BMI class increased
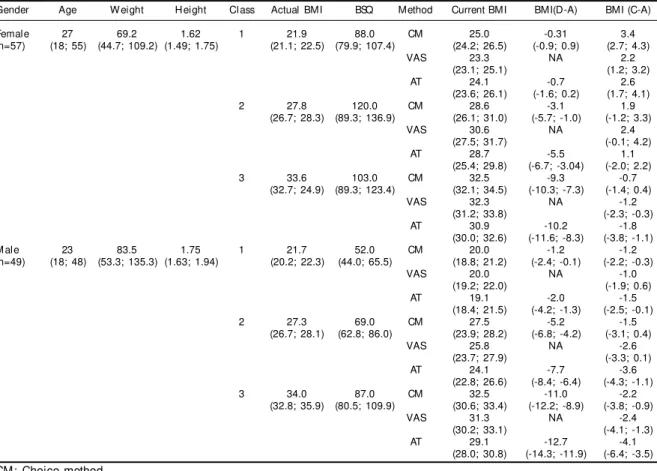
Table - Sample description by medians and 95% confidence interval (95% CI) of age, weight, height, BMI class, actual BMI, BSQ scores and BMIs for each method used. Ribeirão Preto, Brazil, 2003.
Gender Age Weight Height Class Actual BMI BSQ Method Current BMI BMI(D-A) BMI (C-A)
Female 27 69.2 1.62 1 21.9 88.0 CM 25.0 -0.31 3.4
(n=57) (18; 55) (44.7; 109.2) (1.49; 1.75) (21.1; 22.5) (79.9; 107.4) (24.2; 26.5) (-0.9; 0.9) (2.7; 4.3)
VAS 23.3 NA 2.2
(23.1; 25.1) (1.2; 3.2)
AT 24.1 -0.7 2.6
(23.6; 26.1) (-1.6; 0.2) (1.7; 4.1)
2 27.8 120.0 CM 28.6 -3.1 1.9
(26.7; 28.3) (89.3; 136.9) (26.1; 31.0) (-5.7; -1.0) (-1.2; 3.3)
VAS 30.6 NA 2.4
(27.5; 31.7) (-0.1; 4.2)
AT 28.7 -5.5 1.1
(25.4; 29.8) (-6.7; -3.04) (-2.0; 2.2)
3 33.6 103.0 CM 32.5 -9.3 -0.7
(32.7; 24.9) (89.3; 123.4) (32.1; 34.5) (-10.3; -7.3) (-1.4; 0.4)
VAS 32.3 NA -1.2
(31.2; 33.8) (-2.3; -0.3)
AT 30.9 -10.2 -1.8
(30.0; 32.6) (-11.6; -8.3) (-3.8; -1.1)
Male 23 83.5 1.75 1 21.7 52.0 CM 20.0 -1.2 -1.2
(n=49) (18; 48) (53.3; 135.3) (1.63; 1.94) (20.2; 22.3) (44.0; 65.5) (18.8; 21.2) (-2.4; -0.1) (-2.2; -0.3)
VAS 20.0 NA -1.0
(19.2; 22.0) (-1.9; 0.6)
AT 19.1 -2.0 -1.5
(18.4; 21.5) (-4.2; -1.3) (-2.5; -0.1)
2 27.3 69.0 CM 27.5 -5.2 -1.5
(26.7; 28.1) (62.8; 86.0) (23.9; 28.2) (-6.8; -4.2) (-3.1; 0.4)
VAS 25.8 NA -2.6
(23.7; 27.9) (-3.3; 0.1)
AT 24.1 -7.7 -3.6
(22.8; 26.6) (-8.4; -6.4) (-4.3; -1.1)
3 34.0 87.0 CM 32.5 -11.0 -2.2
(32.8; 35.9) (80.5; 109.9) (30.6; 33.4) (-12.2; -8.9) (-3.8; -0.9)
VAS 31.3 NA -2.4
(30.2; 33.1) (-4.1; -1.3)
AT 29.1 -12.7 -4.1
(28.0; 30.8) (-14.3; -11.9) (-6.4; -3.5)
CM: Choice method VAS: Visual analogue scale AT: Absolute threshold method
(p<0.05). Among men, scores of Class 1 were lower than those in Class 2 and 3 (p<0.05) and scores in Class 2 were lower than scores in Class 3 (p<0.05).
D ISCU SSIO N
Both contour drawing scale and visual analogue scale were previously validated in the literature.13 The study results also showed high test-retest reliability for con-tour drawings indicating that measures remained un-changed in the retest a month later, which corrobo-rates other literature findings.13 Based on that, the present study confirmed the instrument’s internal validity since the controlled methodology resulted in quite consistent, and therefore reliable and trust-worthy data. This was additionally evidenced by high correlation between test-retest measures. Thus, the contour drawing scale developed is valid for quanti-tative studies on body image self-perception in both female and male adults. While the study results were based on a particular sample (Brazilian university adults), the adapted version had preserved the origi-nal scale’s features developed for other countries’ populations, cultures, ages, and socioeconomic sta-tus. Preserving the instrument’s original features al-lows for reasonably safe generalizations of findings in other samples, which provides the instrument ex-ternal validity.
Madrigal et al17 (2000) point out the relationship be-tween body weight and body image self-perception is well-documented in the literature,19 which was cor-roborated in the present study. Normal weight and overweight women tended to overestimate their weight but as BMI increased this relationship was inverted and in that case obese women tended to un-derestimate their weight. These findings could also explain the fact that among men overall actual BMI mean was above the desired one (normal weight) as men tend to underestimate their body size, regardless of their BMI. Moreover, these same authors17,19 sug-gest a possible reason for underestimating could be a denial of their own nutritional status.
These findings indicate men pay less attention to the required management of their nutritional status, which would make it difficult to establish prevention ac-tions against chronic degenerative diseases associ-ated to excess weight. Among women, overestimat-ing could reflect environmental factors associated to the development of eating disorders such as anorexia nervosa and bulimia. But other studies found disa-greeing findings and reported overestimation of body size by obese people in general.21,22
The fact that those drawings reported as desired were
largely within lower ranges of BMI compared to those reported as current BMI is suggestive of body image dissatisfaction, showing that both men and women praise thinness ideals. The appreciation of thinness in modern societies, of bodies so lank unattainable for most people, creates a condition of everlasting dissat-isfaction. This dissatisfaction could be an important environmental factor contributing to the characteris-tic stress of modern life, a condition also strongly asso-ciated with the current morbimortality.3,14,20
The fact that even women having an adequate weight-to-height ratio desire to have lower weight is of con-cern. This body image distortion is indeed originated by the mass media that privilege beauty models that have weight-to-height ratios close, or even parallel, to those of people suffering from eating disorders such as anorexia nervosa and bulimia. These beauty models disseminated through the media affect people’s behav-ior and determine eating behavbehav-iors among female ado-lescents. These effects need to be further explored for better understanding environmental factors that pre-dispose the onset of eating disorders.
On the other hand, overweight women are likely to be subject to greater psychological distress when com-pared to normal weight or even obese women as evi-denced in the body image questionnaire. The signifi-cantly higher mean scores among overweight women may indicate greater body concern and discomfort.6 In the same way, they are emotionally more vulner-able, since one’s emotional condition could affect the construction and constant reconstruction of one’s own image. They could be considered a borderline group more susceptible to intervention and advice for improving their nutritional status.
REFEREN CES
1. Almeida GAN, Loureiro SR, Santos JE. A imagem corporal de mulheres morbidamente obesas avaliada através do desenho da figura humana. Psicol Reflex Crít. 2002;15(2):283-92.
2. Almeida GAN, Santos JE, Pasian SR, Loureiro SR. Percepção de tamanho e forma corporal de mulhe-res: estudo exploratório. Psicol Est. 2005;10(1):27-35. 3. Andrade A, Bosi MLM. Mídia e subjetividade:
impacto no comportamento alimentar feminino. Rev Nutr. 2003;16(1):117-25.
4. Anjos LA. Índice de massa corporal (massa corporal.estatura-2) como indicador do estado
nutricional de adultos: revisão da literatura. Rev Saúde Pública. 1992;26(6):431-6.
5. Conti MA, Frutuoso MFP, Gambardella AMD. Excesso de peso e insatisfação corporal em adolescentes. Rev Nutr. 2005;18(4):491-7.
6. Cooper PJ, Taylor MJ, Cooper Z, Fairburn CG. The development and validation of the Body Shape Questionnaire. Int J Eat Disord. 1987;6(4):485-94. 7. Cordás TA, Neves JEP das. Escalas de avaliação de
transtornos alimentares. Rev Psiquitr Clín (São Paulo). 1999;26(1):41-7.
8. Czajka-Narins DM. Avaliação do estado nutricional. In: Mahan LK, Escott-Stump S. Krause: alimentos, nutrição e dietoterapia. São Paulo: Roca; 1995. p. 309-30. 9. Damasceno VO, Lima JRP, Vianna JM, Vianna VRA,
Novaes JS. Tipo físico ideal e satisfação com a imagem corporal de praticantes de caminhada. Rev Bras Med Esporte. 2005;11(3):181-6.
10. Fingeret MC, Gleaves DH, Pearson CA. On the methodology of body image assessment: the use of figural rating scales to evaluate body dissatisfaction and the ideal body standards of women. Body Image. 2004;1(2):207-12.
11. Gardner RM. Methodological issues in assessment of the perceptual component of body image
disturbance. Br J Psychol. 1996;87(Pt 2):327-37. 12. Gardner RM, Friedman BN, Jackson NA.
Methodolo-gical concerns when using silhouettes to measure body image. Percept Mot Skills. 1998;86(2):387-95. 13. Gardner RM, Stark K, Jackson NA, Friedman BN.
Development and validation of two new scales for assessment of body image. Percept Mot Skills. 1999;89(3 Pt 1):981-93.
14. Heinberg LJ. Theories of body image disturbance: perceptual, developmental and sociocultural factor. In: Thompson JK, editor. Body image, eating disorders, and obesity: an integrative guide for assessment and treatment. Washington (DC): American Psychological Association; 1996. p. 27-48.
15. Ingledew DK, Sullivan G. Effects of body mass and body image on exercise motives in adolescence. Psychol Sport Exerc. 2002;3:323-38.
16. Leonhard ML, Barry NJ. Body image and obesity: effects of gender and weight on perceptual measure of body image. Addict Behav. 1998;23(1):31-4. 17. Madrigal H, Sanchez-Villegas A, Martinez-González
MA, Kearney J, Gibney MJ, Irala J, et al. Underestimation of body mass index through perceived body image as compared to self-reported body mass index in the European Union. Public Health. 2000;114(6):468-73.
18. Matos MIR, Aranha LS, Faria AN, Ferreira SRG, Bacaltchuck J, Zanella MT. Binge eating disorder, anxiety, depression and body image in grade III obesity patients. Rev Bras Psiquiatr. 2002;24(4):165-9. 19. Pesa JA, Syre TR, Jones E. Psychosocial differences
associated with body weight among female
adolescents: the importance of body image. J Adolesc Health. 2000;26(5):330-7.
20. Poston WSC 2nd, Foreyt JP. Obesity is an environmental issue. Atherosclerosis. 1999;146(2):201-9.
21. Ramirez EM, Rosen JC. A comparison of weight control and weight control plus body image therapy for obese men and women. J Consult Clin Psychol. 2001;69(3):440-6.
22. Rosen JC. Improving body image in obesity. In: Thompson JK, editor. Body image, eating disorders, and obesity: an integrative guide for assessment and treatment. Washington (DC): American Psychological Association; 1996. p. 425-40.
23. Simões EAQ, Tiedemann KB. Psicologia da percep-ção. São Paulo: Ed. Pedagógica e Universitária; 1985. 24. Veggi AB, Lopes CS, Faerstein E, Sichieri R. Índice de
massa corporal, percepção do peso corporal e transtornos mentais comuns entre funcionários de uma universidade no Rio de Janeiro. Rev Bras Psiquiatr. 2004;26(4):242-7.
25. World Health Organization – WHO. Obesity: preventing and managing the global epidemic [report of a WHO Consultation on Obesity]. Geneve; 1997.