Body image in a representative sample of overweight,
obese and normal weight active older women living in
the community: associations with body composition,
physical itness and function
Vagner RasoI, Carol Ewing GarberII, Rafael Benito ManciniI, Sandra Marcela Mahecha MatsudoI
DOI: 10.5935/MedicalExpress.2016.04.02
I Centro de Estudos do Laboratório de Aptidão Física de São Caetano Sul (CELAFISCS), São Caetano do Sul, SP, Brazil. II Columbia University, Teachers’ College, Department of Biobehavioral Sciences, New York, NY, USA.
OBJECTIVE: To compare and examine relationships between body image (BI), body composition and physical function in overweight and normal weight active older women.
METHOD: We measured body mass (BM), body mass index (BMI), waist circumference (WAIST), grip strength (GS), lower limb muscle strength [LLMS], arm curl, balance, step-in-place test (SIPT), usual walk (WALK), fast walking (fastWALK), single chair stand (CHAIRtime) and repeated chair stand (CHAIRreps) in 398 overweight or obese women (67.2 ± 8.5 years; BMI > 27 kg•m2) and 302 women with a BMI < 27 kg•m2 (67.3 ± 8.5 years). Current (CBI)
and ideal body image (IBI), and body dissatisfaction (DS; current - ideal) were determined by participant’s responses to standardized silhouettes.
RESULTS: Multiple regression analyses veriied positive (CBI) and negative associations (DS) for balance in obese category. A positive association with WALK and fastWALK was observed for current (normal weight and obesity categories) and IBI (overweight). There were positive associations for SIPT, arm curl and CHAIRreps.
CONCLUSION: Physically active older women showed an elevated prevalence of dissatisfaction regardless of BMI which was mediated by age, and associated with worsened physical function; similar associations were seen for current body image.
KEYWORDS: Body composition, body image, body mass index, physical function, walking.
Raso V, Garber CE, Mancini RB, Matsudo SMM. Body image in a representative sample of overweight, obese and normal weight active older women living in the community: associations with body composition, physical itness and function. MedicalExpress (São Paulo, online). 2016;3(4):M160402
Received for Publication on March 23, 2016; First review on May 02, 2016; Accepted for publication on May 15, 2016; Online on July 14, 2016 E-mail: [email protected]
■
INTRODUCTIONBody image refers to an individual’s perception or subjective impression of their appearance.1 Body image
may be influenced by many factors such as media, mood, emotions, self-esteem, and sociocultural influences.1-5 A
positive body image refers to a satisfactory perception
and acceptance of an individual’s true shape.6 Perceptions
of body image may be distorted and not correspond to one’s actual appearance.6 When inaccurate perceptions of
appearance are combined with shame or dissatisfaction with one’s body image, this is termed negative body image.6 Negative body image is more common in women
than in men and occurs among women of all ages.2,6,7
informed consent in accordance with the policy and procedures of the institutional research ethics committee, consistent with the ethical rules for human experimentation stated in the Declaration of Helsinki.23
A preliminary screening that focused on current health status, drug and cigarette use, and habitual physical activity was followed by a detailed history and physical examination covering past and current health status, symptoms of depression, self-reported ability to perform the basic and instrumental activities of daily living, and an assessment of body composition. Possible volunteers were excluded for the following reasons: (i) uncontrolled cardiovascular, pulmonary or metabolic diseases; (ii) any orthopedic conditions that could limit or be exacerbated by exercise; (iii) any kind of surgery during the previous three months; (iv) forced bed rest during the previous three months; (v) current treatment for, or a history of cancer; (vi) adherence of less than 75% in the physical fitness classes; or (vii) less than two years of participation in the physical fitness program.
Body image
We determined perceived current and ideal body image and dissatisfaction through the participant’s identification of their own body size and shape status on standardized silhouettes.24 Nine side-by-side silhouettes
with different body sizes and shapes ranging from very thin (left side) to very heavy (right side) were presented to the participants. The participant was asked to select the silhouette that best represented her current body size and shape (i.e., current body image). Then she was asked to select her ideal body image, i.e., the body size and shape that she would like to have. The current and ideal body images ranged from tubular (category 1) to curvy or very round (category 6), and were coded from 1 to 6. Subsequently, the body dissatisfaction score was calculated as the difference between current and ideal body image.25
Anthropometrics and body composition
Height and weight were measured with a stadiometer and a digital scale, respectively, while the women were wearing light clothing without shoes. Body mass index was
calculated as body weight divided by height squared.26 The
volunteers were categorized according to the BMI cutoffs proposed by Lipschitz:27 underweight, BMI < 22 kg·m2;
normal weight, BMI 22 to 27 kg·m2; overweight, BMI 27 to
30 kg·m2; and obese, BMI > 30 kg·m2. Waist circumference
was measured at the midpoint between the lower margin of the last palpable rib and the top of the iliac crest.28
Physical function and physical itness
Physical function and physical fitness were evaluated using several tests. Maximal isometric grip strength was measured by an adjustable handgrip dynamometer and mental health.2,6 It is commonly associated with being
overweight or obese, disordered eating, and body checking in younger women, but it seems to occur in older women as well,6,8,9 although there is a paucity of research about body
image in older women.6 For women, aging is associated
with a decline in the feeling of a sense of attractiveness, in part due to the internalization of the aesthetic ideal of the young woman.2,10,11 In spite of dissimilarities in some
specific body image concerns of older and younger women, major commonalities exist: most older and younger women are dissatisfied with their body image and desire to lose weight.4,6 Weight status and/or body composition are
associated with body dissatisfaction and disordered eating in younger and older women.3,8,12
A physically active lifestyle has many well-known health and fitness benefits in younger older adults.13-15
Regular physical activity can enhance esteem, self-worth, and self-efficacy for physical activity,16-19 all of
which may improve perceived body image in younger women.16,20 However, whether or not regular exercise
training is associated with an improvement or decline in body dissatisfaction seems to depend partially on the woman’s motivation for exercise (e.g., for improving appearance, weight loss, or health), and her initial level of body dissatisfaction.20 Little is known about whether the
associations between body image and exercise behaviors in older women are similar to those seen in younger women. Changes in body weight or body composition (or lack thereof ) appear to alter the associations between body image and exercise behavior observed in younger women,12,21,22 but it is unclear whether these relationships
are also present in older women. Therefore, the purpose of this study was to examine relationships between body composition and physical function and body image in a representative sample of overweight physically active older women.
■
METHODSObservational cohort study
This cross-sectional observational cohort study was carried out over 15 years from 1997 to 2012. Our research team visited a physical fitness facility twice per year for about three to four weeks per visit to gather data.
Participants
(Takei TK005, Tokyo, Japan), repeated twice for each hand, alternating between right and left hands to avoid muscular fatigue. Participants were instructed to squeeze the handgrip as hard as possible; the best result for the dominant hand was used in the analysis. Lower limb muscular power was measured through vertical jump performed without arm help (i.e., arms remaining alongside the trunk); the best result of three trials was considered.29
The arm curl test was used to measure muscular endurance of the upper extremities.30 In this test, volunteers performed
as many repetitions of biceps curls as possible within 30 seconds, lifting a five pound weight with the right arm: the total number of performed curls was adopted as the score.30
Balance was measured while the volunteer stood in the unipodal position with the contra-lateral knee flexed at 90º; the arms were crossed over the chest and the participant looked straight ahead.31 Three trials of up to 30-seconds
duration were completed on the dominant leg, separated by one-minute intervals; the longest duration of maintaining the one-legged stance was used as the score.31 The
step-in-place test (SIPT) was used to measure endurance.30
Volunteers stepped in place as quickly as possible for a two minute period. The steps were performed by raising the knee to a set height established at the midway point between the patella and the iliac crest; the total number of steps performed was taken as the score.30 The
time-to-walk 3.33 meters at a usual pace (WALK) and at the fastest walking speed possible (fastWALK) also were measured. Participants completed tests of lower extremity function with the chair rise test and the repeated chair rise tests. In the former, participants stood up from a seated position as quickly as possible (CHAIRtime); in the latter, they repeated the chair rise as many times as possible during 30 seconds (CHAIRreps). The score on the chair rise was the total time to move from a sitting to a full stand stance. For the repeated chair rise, the score was the total number of repetitions completed within 30 seconds.32
Statistical analysis
Statistical analyses were performed using Predictive
Analytics Software version 17.0 for Windows (PASW, Inc.,
Chicago, IL). A one-sample Kolmogorov-Smirnov test was used to test the normality of data distribution for all measured variables. Due to small numbers of participants selecting current body image silhouettes at the extremes of the scale, we combined images 1 and 2 (≤ 2; thin) together, and images 7-9 (≥ 7 very round) together. Descriptive data are presented as means ± standard deviations. To compare the characteristics of the participants, a series of one-way analyses of variance (ANOVA) across classifications of current body image were conducted for each of the physical fitness, physical function and body composition variables, age, body image, ideal body image, and body dissatisfaction. Post-hoc unpaired t-tests with Bonferroni
corrections followed whenever there were significant main effects. Cross tabulations were performed to describe the distribution of participants across categories of body mass index, body satisfaction, and current body image. Similarly, a series of one-way ANOVA were conducted to evaluate these same variables across categories of BMI, with post-hoc unpaired t-tests with Bonferroni corrections
performed whenever there were significant main effects. Univariate and hierarchical multiple regression analysis investigated associations of body image (current, ideal and dissatisfaction) with physical function, after adjusting for age, BMI, and waist circumference.
■
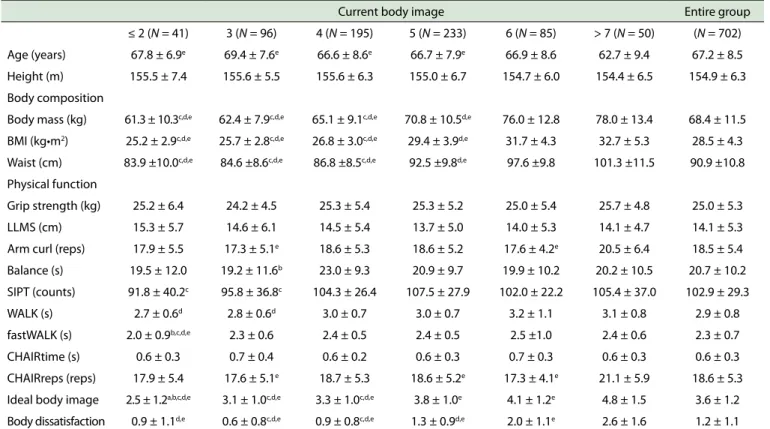
RESULTSGeneral characteristics. Table 1 shows the
descriptive characteristics and the results of the physical fitness, physical function and anthropometric tests across classifications of current body image. The majority of participants was between 65 and 74 years old, and the mean age was similar across the current body image categories, except for category > 7, where the mean age was significantly younger. The average body mass index for the total sample was 28.5 ± 4.3 kg·m2. BMI was similar across
the first four current body image categories; however, there was a significant increment in BMI in each category thereafter when compared with the previous category. A similar trend was observed for body mass and waist circumference. We observed some significant differences among distinct current body image categories for some tests of physical function (i.e., WALK, fastWALK, arm curl, SIPT, CHAIRreps), such that physical function scores worsened across current body image categories. That is, when moving from a tubular shaped to rounder body shapes. ideal body image and dissatisfaction also increased across the range of current body image categories, especially after category 5, which represents a rounded body shape.
We observed a high prevalence of body dissatisfaction in our volunteers, even among those who fell within the normal weight category, as shown in Figure 1. The range of dissatisfaction scores ranged from 60% to 82% in the normal weight group. When looking at the entire sample, 70% of the volunteers reported body dissatisfaction. Moreover, there was a positive relationship between dissatisfaction scores and BMI, so that as BMI increased, so did body dissatisfaction. On average, body composition (body mass, BMI and waist circumference) and body image (current, ideal and dissatisfaction) were higher in the overweight and obese when compared with the normal weight category.
Associations between age, body mass index
and waist circumference. We conducted a series of
Current body image Entire group
≤ 2 (N = 41) 3 (N = 96) 4 (N = 195) 5 (N = 233) 6 (N = 85) > 7 (N = 50) (N = 702)
Age (years) 67.8 ± 6.9e 69.4 ± 7.6e 66.6 ± 8.6e 66.7 ± 7.9e 66.9 ± 8.6 62.7 ± 9.4 67.2 ± 8.5
Height (m) 155.5 ± 7.4 155.6 ± 5.5 155.6 ± 6.3 155.0 ± 6.7 154.7 ± 6.0 154.4 ± 6.5 154.9 ± 6.3
Body composition
Body mass (kg) 61.3 ± 10.3c,d,e 62.4 ± 7.9c,d,e 65.1 ± 9.1c,d,e 70.8 ± 10.5d,e 76.0 ± 12.8 78.0 ± 13.4 68.4 ± 11.5
BMI (kg•m2) 25.2 ± 2.9c,d,e 25.7 ± 2.8c,d,e 26.8 ± 3.0c,d,e 29.4 ± 3.9d,e 31.7 ± 4.3 32.7 ± 5.3 28.5 ± 4.3
Waist (cm) 83.9 ±10.0c,d,e 84.6 ±8.6c,d,e 86.8 ±8.5c,d,e 92.5 ±9.8d,e 97.6 ±9.8 101.3 ±11.5 90.9 ±10.8
Physical function
Grip strength (kg) 25.2 ± 6.4 24.2 ± 4.5 25.3 ± 5.4 25.3 ± 5.2 25.0 ± 5.4 25.7 ± 4.8 25.0 ± 5.3
LLMS (cm) 15.3 ± 5.7 14.6 ± 6.1 14.5 ± 5.4 13.7 ± 5.0 14.0 ± 5.3 14.1 ± 4.7 14.1 ± 5.3
Arm curl (reps) 17.9 ± 5.5 17.3 ± 5.1e 18.6 ± 5.3 18.6 ± 5.2 17.6 ± 4.2e 20.5 ± 6.4 18.5 ± 5.4
Balance (s) 19.5 ± 12.0 19.2 ± 11.6b 23.0 ± 9.3 20.9 ± 9.7 19.9 ± 10.2 20.2 ± 10.5 20.7 ± 10.2
SIPT (counts) 91.8 ± 40.2c 95.8 ± 36.8c 104.3 ± 26.4 107.5 ± 27.9 102.0 ± 22.2 105.4 ± 37.0 102.9 ± 29.3
WALK (s) 2.7 ± 0.6d 2.8 ± 0.6d 3.0 ± 0.7 3.0 ± 0.7 3.2 ± 1.1 3.1 ± 0.8 2.9 ± 0.8
fastWALK (s) 2.0 ± 0.9b,c,d,e 2.3 ± 0.6 2.4 ± 0.5 2.4 ± 0.5 2.5 ±1.0 2.4 ± 0.6 2.3 ± 0.7
CHAIRtime (s) 0.6 ± 0.3 0.7 ± 0.4 0.6 ± 0.2 0.6 ± 0.3 0.7 ± 0.3 0.6 ± 0.3 0.6 ± 0.3
CHAIRreps (reps) 17.9 ± 5.4 17.6 ± 5.1e 18.7 ± 5.3 18.6 ± 5.2e 17.3 ± 4.1e 21.1 ± 5.9 18.6 ± 5.3
Ideal body image 2.5 ± 1.2a,b,c,d,e 3.1 ± 1.0c,d,e 3.3 ± 1.0c,d,e 3.8 ± 1.0e 4.1 ± 1.2e 4.8 ± 1.5 3.6 ± 1.2
Body dissatisfaction 0.9 ± 1.1d,e 0.6 ± 0.8c,d,e 0.9 ± 0.8c,d,e 1.3 ± 0.9d,e 2.0 ± 1.1e 2.6 ± 1.6 1.2 ± 1.1 Table values are means ± standard deviations; shaded areas indicate signiicant diferences (p ≤ 0.05); BMI: body mass index; LLMS: lower limb muscle strength; SIPT: step-in-place test; WALK: usual walking speed; fastWALK: fastest walking speed possible; CHAIRtime: single chair stand; CHAIRreps: repeated chair stand; a: statistically diferent from 3; b:
statistically diferent from 4; c: statistically diferent from 5; d: statistically diferent from 6; e: statistically diferent from > 7.
Table 1. Characteristics of older adult women participant according to current body image.
Figure 1. Prevalence of body image dissatisfaction (i.e., diference between current and
ideal body image) according to body mass index category and in the entire sample of 700 older adult women participants (Normal: BMI 22 to 27 kg·m2; Overweight: BMI 27
to 30 kg·m2; Obese: BMI > 30 kg·m2; Total: entire group).
function. Our data demonstrated that age, BMI and waist circumference have a weak association with physical function. Importantly, age was associated with almost all parameters of physical function, ranging from a common variance (R2) of 1% to 15%, regardless of overweight
category. Very poor associations were observed when we analyzed the effect of BMI (common variance, R2 = 1%
to 2%) and waist circumference (common variance, R2
= 1% to 4%; data not shown) on physical function (data not shown).
Associations between body image and physical function. Bivariate correlations of current and ideal body image with several distinct parameters of physical function were significant across all BMI categories, as shown in Table 2. We examined the associations between the physical function parameters and ideal body image, because we hypothesized that a discrepancy between current and ideal body image might be associated with poorer physical function. In our data, we observed significant correlations only for arm curl and CHAIRreps in overweight and obesity categories, but not in the normal weight category, as also shown in Table 2. Moreover, we also analyzed the magnitude of dissatisfaction, because we hypothesized a linear relationship between body image dissatisfaction and disturbances on physical function. There were some significant (and most of them positive) correlations between the magnitude of dissatisfaction and physical function in obesity group; however, those correlations seemed to be lower when compared to the body image satisfaction subcategory. Table 3 illustrates this point.
The body silhouettes were also compared over the four body mass index categories. In this sense, silhouettes 1, 2 and 3 were relatively equivalent to underweight (BMI < 22 kg·m2), silhouettes 4 and 5 were representative of
Table 2. Bivariate correlations of current and ideal body image with age, body composition and physical function according to body mass index categories in 700 older adult women.
Normal weight Overweight Obesity
Current BI Ideal BI Current BI Ideal BI Current BI Ideal BI
r p r p r p r p r p r p
Grip
strength -.01 .822 -.04 .521 .08 w.323 -.02 .846 .03 .710 .06 .360
LLMS -.06 .274 -.09 .125 .04 .617 .07 .380 .12 .100 .02 .726
Arm curl .13 .028 .06 .278 .08 .305 .36 .0005 .06 .407 .26 .0005
Balance -.02 .749 -.07 .202 .02 .807 -.03 .709 .14 .036 .06 .355
SIPT .15 .011 .04 .470 .12 .127 .06 .469 .11 .097 .10 .123
WALK .12 .035 .00 .948 .04 .646 .15 .050 .15 .027 -.01 .877
fastWALK .07 .249 -.01 .840 -.04 .578 .08 .295 .19 .005 -.03 .635
CHAIRtime -.01 .913 .06 .272 -.07 .359 -.14 .069 .00 .995 .00 .976
CHAIRreps .15 .010 .07 .235 .08 .323 .35 .0005 .04 .559 .24 .0005 Table values are Pearson correlations (r) and p values; BI: body image; LLMS: lower limb muscle strength; SIPT: step-in-place test; WALK: usual walking speed; fastWALK: fastest walking speed possible; CHAIRtime: single chair stand; CHAIRreps: repeated chair stand.
Table 3. Bivariate correlations of body image with age, body composition and physical function according to the magnitude of body image disturbance and for total sample in 700 older adult women.
Normal weight Overweight Obesity
Dissatisfaction Dissatisfaction Dissatisfaction
Satisfaction 1 > 2 Satisfaction 1 > 2 Satisfaction 1 > 2
Gripstrength -.06 -.02 .01 -.01 .16 -.03 .14 .15 -.06
LLMS -.18 -.07 .02 .20 -.07 .09 .01 .14 .15
Armcurl .06 .21* .09 .41* .07 .00 .18 .24* .03
Balance .02 -.02 -.01 -.02 .01 .08 .36* .15 .15
SIPT .09 .17 .17 .26 .11 .04 .16 .10 .21*
WALK .16 .01 .27* .10 -.02 .03 .14 .26* .12
fastWALK -.03 .12 .13 -.04 -.03 -.17 .17 .15 .27*
CHAIRtime .10 -.10 .01 .13 -.32* -.05 -.42* .27* -.03
CHAIRreps .06 .21* .13 .42* .08 -.06 .14 .17 .04
Table values are Pearson correlations (r) and p values; *p ≤ 0.05; LLMS: lower limb muscle strength; SIPT: step-in-place test; WALK: usual walking speed; fastWALK: fastest walking speed possible; CHAIRtime: single chair stand; CHAIRreps: repeated chair stand.
and 7 represented overweight body shapes (BMI 27 to 30 kg·m2) and silhouettes 8 and 9 represented obese
body shapes (BMI > 30kg·m2). We found significant
correlations in normal weight women for body mass with current body image (r = 0.28, p= .0005), ideal body image (r = 0.10, p = .041) and dissatisfaction (r = 0.11, p < .029). BMI with dissatisfaction (r = 0.14, p = .003), and waist circumference with current body image (r = 0.29, p = .0005), ideal body image (r = 0.10, p = .048) and dissatisfaction (r = 0.13, p = .009). However in overweight women the only significant associations with ideal body image were, with body mass [r = 0.18, p = .047], BMI [r = 0.23, p = .009] and waist circumference [r = 0.26, p = .004]) and obesity categories.
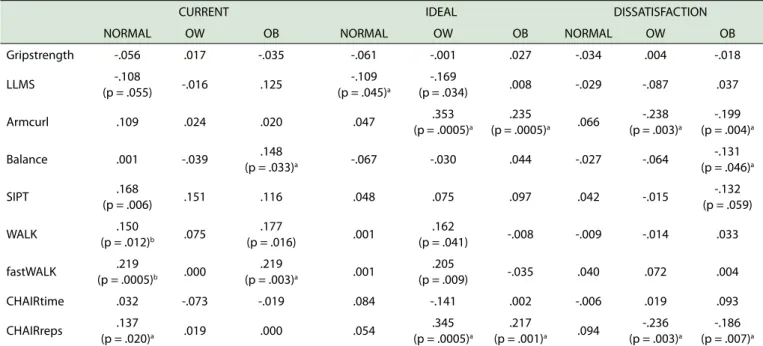
Table 4. Beta values from multiple regression analyzes of physical function as a function of body composition regardless of age in a sample in 700 older adult women.
CURRENT IDEAL DISSATISFACTION
NORMAL OW OB NORMAL OW OB NORMAL OW OB
Gripstrength -.056 .017 -.035 -.061 -.001 .027 -.034 .004 -.018
LLMS -.108
(p = .055) -.016 .125
-.109 (p = .045)a
-.169
(p= .034) .008 -.029 -.087 .037
Armcurl .109 .024 .020 .047 .353
(p= .0005)a
.235
(p= .0005)a .066
-.238 (p= .003)a
-.199 (p = .004)a
Balance .001 -.039 .148
(p = .033)a -.067 -.030 .044 -.027 -.064
-.131 (p = .046)a
SIPT .168
(p = .006) .151 .116 .048 .075 .097 .042 -.015
-.132 (p = .059)
WALK .150
(p = .012)b .075
.177
(p = .016) .001
.162
(p = .041) -.008 -.009 -.014 .033
fastWALK .219
(p = .0005)b .000
.219
(p = .003)a .001
.205
(p = .009) -.035 .040 .072 .004
CHAIRtime .032 -.073 -.019 .084 -.141 .002 -.006 .019 .093
CHAIRreps .137
(p = .020)a .019 .000 .054
.345 (p = .0005)a
.217
(p = .001)a .094
-.236 (p = .003)a
-.186 (p = .007)a Table values are Beta (signiicance level); NORMAL: normal weight category; OW: overweight category; OB: obese category; BMI: body mass index; LLMS: lower limb muscle strength; SIPT: step-in-place test; WALK: usual walking speed; fastWALK: fastest walking speed possible; CHAIRtime: single chair stand; CHAIRreps: repeated chair stand. aAdjusted by age; bAdjusted by age and BMI; cAdjusted by BMI; dAdjusted by age and waist.
■
DISCUSSIONWe conducted a comprehensive analysis of body image in a representative sample of overweight older women who were regular active participants in a community fitness center program and found a high prevalence of body dissatisfaction. Our results demonstrate that physically active older women, irrespective of BMI category (i.e., normal weight, overweight/obese), reported body image dissatisfaction in about 7 out of 10 of the participant women. Others have found that body dissatisfaction is common in older women, but these have been in general populations and not among physically active older women.2,4,7,33 Moreover, body dissatisfaction intensified with increasing body mass index among participants in our study. A curvilinear association was identified in which women and men with high and low BMI categories were more dissatisfied with their appearance.7 Our findings showing
greater dissatisfaction in overweight and obese community dwelling older women extend previous findings6,34 in
older North American women to older South American Latina women who may have a different ideal body image in comparison to women from other cultures. Women of European origins tend to internalize the thinness ideal, and this is associated with body dissatisfaction.2,10,33 By and large, black and Latina women tend to view a more substantial body shape as ideal and are therefore less dissatisfied with their body shape, even when overweight.35
However, a study of younger black and Latina women in
the U.S. found that black women weighed more and had more body image satisfaction than did Latina women, demonstrating a cultural difference in ideal body image.36
In contrast to our findings in active older women, studies of younger Latina women have reported body dissatisfaction to be present only if the woman was overweight or obese.37-39 In our sample, waist circumference, but not BMI category or body weight, was an independent predictor of body image dissatisfaction only in the overweight and obese older women, and this did not vary with age. We did not observe associations between the distinct silhouettes and body mass index, regardless of weight category. This may reflect the effect of truncated ranges of values that resulted in depressed correlation coefficients, or the covariation of the BMI and silhouettes.
Notably, the volunteers in our study were engaged in regular exercise and therefore do not represent the general community-dwelling population of older women who tend to be physically inactive. Despite this, our participants affirmed body dissatisfaction at a similar frequency described in other studies of samples drawn from the general population.2,4,6,34 A study discovered that body dissatisfaction was not a primary motivator for exercise in older men and women, but rather older adults exercised to enhance health and fitness.40 Furthermore, in this study both older men and
fitness concerns.41 Studies of younger adults have observed
that body dissatisfaction was not a primary motivator for obligatory exercise, rather exercise behavior and disordered eating was associated with negative affect such as anger or guilt, sociocultural influences (e.g., teasing about weight), internalization of the thin ideal, and other risk factors and motivators for obligatory exercise.3,42,43
The present study represents the first to demonstrate that both current body image and dissatisfaction is associated with objectively measured physical function and physical fitness in older women, although older age moderates these associations. Importantly, when we adjusted for potentially confounding variables (i.e., body mass, body mass index and waist circumference), these observed relationships remained the same.
Reporting on a large sample of community-dwelling older French women, it was also found that satisfaction with body image was associated with higher levels of self-reported body functioning during instrumental activities of daily living.7 Further supporting our findings, a recent study
of college undergraduates reported poorer physical health-related quality of life and psychosocial functioning with higher body image dissatisfaction.12 Studies of individuals
with disabling conditions likewise report poorer body image and body dissatisfaction.44-46
The generalizability of this study is limited by the select nature of the sample which consists of volunteer participants from a large community fitness program; some of the program participants did not choose to participate in this study. The small numbers of participants who identified with the extremes of the discrete body silhouettes truncated the range of scores, and this also represents a limitation of this study. Further, the cross sectional observational design of the study shows associations between variables and do not demonstrate causal relations among the variables. In conclusion, body mass, BMI, and waist circumference were important correlates of body image dissatisfaction among active older women. In this association, we observed an age-mediated effect for body mass and BMI, but not for waist circumference. Our results show that waist circumference is an independent predictor of body image dissatisfaction in overweight and obese older women. In contrast, the effects of body mass and BMI seem to be also important, correlates but their effect is age-dependent.
■
AUTHOR CONTRIBUTIONSStudy concept and design: Raso V. Acquisition of data: Mancini RB and Matsudo SMM. Analysis and interpretation of data: Raso V. Drafting of the manuscript: Garber CE and Raso V. Critical revision of the manuscript for important intellectual content: Garber CE and Raso V. Statistical analysis: Raso V. Administrative, technical, or material support: Mancini RB and Matsudo SMM. Study supervision: Garber CE, Matsudo SMM and Raso V.
■
CONFLICT OF INTERESTAuthors report no conflict of interest regarding this project.
IMAGEM CORPORAL NUMA AMOSTRA REPRE-SENTATIVA DE MULHERES IDOSAS FISICAMENTE ATIVAS COM SOBREPESO, OBESIDADE E PESO NORMAL VIVENDO NA COMUNIDADE: ASSOCIA-ÇÕES COM A COMPOSIÇÃO CORPORAL, APTIDÃO E FUNÇÃO FÍSICAS
OBJETIVO: Comparar e analisar as relações entre imagem corporal, composição coporal e função física em mulheres idosas fisicamente ativas com sobrepeso e peso normal.
MÉTODOS: Medimos a massa corporal, índice
de massa corporal (IMC), circunferência da cintura, força de preensão manual, força de membros inferiores, flexão de cotovelo, equilíbrio, marcha estacionária, velocidade normal e máxima de caminhada, levantar-se da cadeira em 700 mulheres idosas fisicamente ativas com sobrepeso (N: 398 [67.2 ± 8.5 years; IMC > 27 kg·m2]) e peso normal (N: 302 [67.3 ± 8.5 years; IMC <
27 kg·m2]). A imagem corporal atual (ICA) e ideal (ICI),
assim como a insatisfação com a imagem corporal (IIC) foram determinadas pelas respostas das voluntarias de acordo com silhuetas padronizadas.
RESULTADOS: A analise de regressão múltipla
verificou associações positivas (ICA) e negativas (IIC) para equilíbrio na categoria obesidade. Foi observada associação positiva com a velocidade usual e máxima de caminhada para ICA (categorias peso normal e obesidade) e IIC (sobrepeso). Existiram associações positivas para o desempenho no teste de marcha estacionária, flexão de cotovelo e numero de repetições para levantar-se da cadeira.
CONCLUSÃO: Mulheres idosas fisicamente ativas
demonstram elevada prevalência de insatisfação com a imagem corporal independente do índice de massa corporal. Esse resultado é mediado pela idade, e está associado com pior função física; associações semelhantes foram observadas para a imagem corporal atual.
PALAVRAS-CHAVE: composição corporal, imagem
corporal, índice de massa corpórea, função física, caminhada.
■
REFERENCES2. Marshall C, Lengyel C, Utioh A. Body dissatisfaction among middle-aged and older women. Can J Diet Pract Res. 2012;73:e241-7.
3. Slevec JH, Tiggemann M. Predictors of body dissatisfaction and disor-dered eating in middle-aged women. Clin Psychol Rev. 2011;31(4):515-24. http://dx.doi.org/10.1016/j.cpr.2010.12.002.
4. Peat CM, Peyerl NL, Muehlenkamp JJ. Body image and eating disorders in older adults: a review. J Gen Psychol. 2008;135(4):343-58. http:// dx.doi.org/10.3200/GENP.135.4.343-358.
5. Hurd LC. Older women’s body image and embodied experience: an exploration. J Women Aging. 2000;12(3-4):77-97.
6. Roy M, Payette H. The body image construct among Western se-niors: a systematic review of the literature. Arch Gerontol Geriatr. 2012;55(3):505-21. http://dx.doi.org/10.1016/j.archger.2012.04.007. 7. de Souto Barreto P, Ferrandez AM, Guihard-Costa AM. Predictors of body satisfaction: differences between older men and women’s per -ceptions of their body functioning and appearance. J Aging Health. 2011;23(3):505-28. http://dx.doi.org/10.1177/0898264310386370. 8. Gagne DA, Von Holle A, Brownley KA, et al. Eating disorder symptoms and weight and shape concerns in a large web-based convenience sample of women ages 50 and above: results of the Gender and Body Image (GABI) study. Int J Eat Disord. 2012;45(7):832-44. http://dx.doi. org/10.1002/eat.22030.
9. Ro O, Bang L, Reas DL, Rosenvinge JH. The impact of age and BMI on impairment due to disordered eating in a large female community sample. Eat Behav. 2012;13(4):342-6. http://dx.doi.org/10.1016/j. eatbeh.2012.05.010.
10. Karazsia BT, van Dulmen MH, Wong K, Crowther JH. Thinking meta--theoretically about the role of internalization in the development of body dissatisfaction and body change behaviors. Body Image 2013; http://dx.doi.org/10.1016/j.bodyim.2013.06.005
11. Sontag S. The double standard of aging. Sat Rev 1972; 31-9. 12. Wilson RE, Latner JD, Hayashi K. More than just body weight: The role
of body image in psychological and physical functioning. Body Image 2013; http://dx.doi.org/10.1016/j.bodyim.2013.04.007
13. Garber CE, Blissmer B, Deschenes MR, Franklin BA, Lamonte MJ, Lee IM, et al. American College of Sports Medicine position stand. Quantity and quality of exercise for developing and maintaining cardiorespiratory, musculoskeletal, and neuromotor fitness in apparently healthy adults: guidance for prescribing exercise. Med Sci Sports Exerc. 2011;43(7):1334-59. http://dx.doi.org/10.1249/ MSS.0b013e318213fefb.
14. Nelson ME, Rejeski WJ, Blair SN, Duncan PW, Judge JO, King AC, et al. Physical activity and public health in older adults: recommendation from the American College of Sports Medicine and the American Heart Association. Med Sci Sports Exerc. 2007;39(8):1435-45. http://dx.doi. org/10.1249/mss.0b013e3180616aa2
15. U.S. Department of Health and Human Services. 2008 Physical Activity Guidelines for Americans. 2008; Retrieved from http://www.health. gov/paguidelines/pdf/paguide.pdf doi:ODPHP Publication No. U0036 16. Thogersen-Ntoumani C, Ntoumanis N, Cumming J, Bartholomew KJ, Pe-arce G. Can self-esteem protect against the deleterious consequences of self-objectification for mood and body satisfaction in physically active female university students? J Sport Exerc Psychol. 2011;33(2):289-307. 17. Elavsky S. Longitudinal examination of the exercise and self-esteem model in middle-aged women. J Sport Exerc Psychol. 2010;32(6):862-80. 18. Elavsky S, McAuley E. Exercise and self-esteem in menopausal women:
a randomized controlled trial involving walking and yoga. Am J Health Promot. 2007;22(2):83-92.
19. Elavsky S, McAuley E, Motl RW, Konopack JF, Marquez DX, Hu L, et al. Physical activityenhances long-term quality of life in older adults: effi-cacy, esteem, and affective influences. Ann Behav Med. 2005;30(2):138-45.
20. Lepage ML, Crowther JH. The effects of exercise on body satis-faction and affect. Body Image. 2010;7(2):124-30. http://dx.doi. org/10.1016/j.bodyim.2009.12.002.
21. Teixeira PJ, Going SB, Houtkooper LB, Cussler EC, Metcalfe LL, Blew RM, et al. Exercise motivation, eating, and body image variables as predictors of weight control. Med Sci Sports Exerc. 2006;38(1):179-88.
22. McAuley E, Bane SM, Rudolph DL, Lox CL. Physique anxiety and exercise in middle-aged adults. J Gerontol B Psychol Sci Soc Sci 1995;50(5):229-35.
23. World Medical Association declaration of Helsinki. Recommendations guiding physicians in biomedical research involving human subjects. JAMA. 1997;277(11):925-6.
24. Sørensen TI, Stunkard AJ. Does obesity run in families because of genes? An adoption study using silhouettes as a measure of obesity. Acta Psychiatr Scand Suppl. 1993;370:67-72.
25. Mchiza ZJ, Goedecke JH, Lambert EV. Intra-familial and ethnic effects on attitudinal and perceptual body image - A cohort of South African mother-daughter dyads. BMC Public Health. 2011;11:433. http:// dx.doi.org/10.1186/1471-2458-11-433.
26. World Health Organization. Obesity: preventing and managing the global epidemic. Report of a World Health Organization Consultation. World Health Organization Technical Report Series 894. Geneva: World Health Organization, 2000.
27. Lipschitz DA. Screening for nutritional status in the elderly. Primary Care. 1994;21(1):55-67.
28. World Health Organization. Waist circumference and waist-hip ratio: report of a World Health Organization expert consultation. Geneva: WorldHealth Organization, 2008.
29. Ditroilo M, Forte R, McKeown D, Boreham C, De Vito G. Intra- and inter--session reliability of vertical jump performance in healthy middle--aged and older men and women. J Sports Sci. 2011;29(15):1675-82. http://dx.doi.org/10.1080/02640414.2011.614270.
30. Rikli RE, Jones CJ. Development and validation of a functional fit-ness test for community-residing older adults. J Aging Phys Activ. 1999;7(2):129-61.
31. Briggs RC, Goosman MR, Drews JE, Shadeau SA. Balance perfor-mance among non-institutionalized elderly women. Phys Ther. 1989;69(9):748-56.
32. Carter JS, Williams HG, Macera CA. Relationships between physical activity habits and functional neuromuscular capacities in healthy older adults. J Appl Gerontol. 1993;12(2):283-93. http://dx.doi. org/10.1177/073346489301200210
33. Grippo KP, Hill MS. Self-objectification, habitual body monitoring, and body dissatisfaction in older European American women: exploring age and feminism as moderators. Body Image. 2008;5(2):173-82. http:// dx.doi.org/10.1016/j.bodyim.2007.11.003.
34. Runfola CD, Von Holle A, Trace SE, Brownley KA, Hofmeier SM, Gagne DA, et al. Body dissatisfaction in women across the lifespan: results of the UNC-SELF and Gender and Body Image (GABI) studies. Eur Eat Disord Rev. 2013;21(1):52-9. http://dx.doi.org/10.1002/ erv.2201.
35. Ceballos N, Czyzewska M. Body image in Hispanic/Latino vs. European American adolescents: implications for treatment and prevention of obesity in underserved populations. J Health Care Poor Underserved. 2010;21(3):823-38. http://dx.doi.org/10.1353/hpu.0.0333. 36. Sanchez-Johnsen LA, Fitzgibbon ML, Martinovich Z, Stolley MR, Dyer
AR, Van Horn L. Ethnic Differences in correlates of obesity between Latin-American and black Women. Obes Res. 2004;12(4):652-60. http://dx.doi.org/10.1038/oby.2004.75
37. Dorsey RR, Eberhardt MS, Ogden CL. Racial and ethnic differences in weight management behavior by weight perception status. Ethn Dis. 2010;20(3):244-50. http://dx.doi.org/10.1038/oby.2006.112 38. Yancey AK, Simon PA, McCarthy WJ, Lightstone AS, Fielding JE. Ethnic
and sex variations in overweight self-perception: relationship to se-dentariness. Obesity (Silver Spring). 2006;14(6):980-8. http://dx.doi. org/10.1038/oby.2006.112
39. Fitzgibbon ML, Blackman LR, Avellone ME. The relationship be-tween body image discrepancy and body mass index across ethnic groups. Obes Res. 2000;8(8):582-9. http://dx.doi.org/10.1038/ oby.2000.75
41. Rote AE, Swartz AM, Klos LA. Associations between lifestyle physical activity and body image attitudes among women. Women Health. 2013;53(3):282-97. http://dx.doi.org/10.1080/03630242.2013.773956 42. De Young KP, Anderson DA. Prevalence and correlates of exercise
motivated by negative affect. Int J Eat Disord. 2010;43(1):50-8. http:// dx.doi.org/10.1002/eat.20656
43. De Young KP, Anderson DA. The importance of the function of exer-cise in the relationship between obligatory exerexer-cise and eating and body image concerns. Eat Behav. 2010;11(1):62-4. http://dx.doi. org/10.1016/j.eatbeh.2009.09.001
44. Paffenberger N, Gutweniger S, Kopp M, Seeber B, Stürz K, Berger T, et al. Impaired body image in patients with multiple sclerosis. Acta Neu -rol Scand. 2011;124(3):165-70. http://dx.doi.org/10.1111/j.1600-0404.2010.01460.x
45. Guenther V, Locher E, Falkenbach A, Gutweniger S, Kopp M, Pfaffen-berger N, et al. Body image in patients with ankylosing spondylitis. Clin Exp Rheumatol. 2010;28(3):341-7.