Cassiano Ricardo RechI,II Rogério César FerminoI,III Pedro Curi HallalIV Rodrigo Siqueira ReisI,III
I Programa de Pós-Graduação em Educação Física. Universidade Federal do Paraná. Curitiba, PR, Brasil
II Departamento de Educação Física, Universidade Estadual de Ponta Grossa. Ponta Grossa, PR, Brasil
III Pontifícia Universidade Católica do Paraná. Curitiba, PR, Brasil. Grupo de Pesquisa em Atividade Física e Qualidade de Vida. Pontifícia Universidade Católica do Paraná. Curitiba, PR, Brasil
IV Departamento de Educação Física, Universidade Federal de Pelotas. Pelotas, RS, Brasil
Correspondence: Cassiano Ricardo Rech
Centro de Ciências Biológicas e da Saúde Pontifícia Universidade Católica do Paraná R. Imaculada Conceição, 1155 - Prado Velho 80215-901 Curitiba, PR, Brasil
E-mail: [email protected] Received: 3/10/2010 Approved: 8/25/2010
Article available from: www.scielo.br/rsp
Validation and reliability of the
satisfaction scale for physical
activity in adults
ABSTRACT
OBJECTIVE: To analyze the validation, internal consistency and reliability of the satisfaction scale for performing physical activity among Brazilian adults.
METHODS: The satisfaction scale for the performance of physical activity was applied using a multidimensional questionnaire. Face-to-face interviews were performed with 1,461 subjects (63.7% females) who were at least 18 years in Curitiba, Southern Brazil from April 2009 to July 2009. The questionnaire was submitted to an analysis of its validity (factorial and construct) and reliability (internal consistency and temporal stability). The test-retest procedure was used to assess temporal stability after a one-week interval (n = 74).
RESULTS: The exploratory factor analysis yielded two main factors: satisfaction with the practice of walking during leisure-time and satisfaction with the practice of moderate or vigorous physical activity. These factors explained 29.3% of the variance for walking and 53.5% of the variance for moderate and vigorous physical activity. Alpha values of 0.91 and 0.88, respectively, indicated high internal consistency and two subscales. The scale items presented high agreement in the test-retest for both walking (71.7% to 81.1%) and moderate and vigorous physical activity (80.5% to 92.6%). These factors presented a signifi cant correlation with time spent walking (minutes/week) (rho = 0.23; p < 0.001) and time spent performing moderate and vigorous physical activity (rho = 0.21; p < 0.001), which indicated the validation of the construct.
CONCLUSIONS: The proposed satisfaction scale for the performance of physical activity has been appropriately validated and exhibits internal consistency and reliability for Brazilian adults.
DESCRIPTORS: Motor Activity. Personal Satisfaction. Evaluation. Reproducibility of Results. Validity of Tests.
INTRODUCTION
Physical activity (PA) is an important component of a healthy life and confers various physical and psychological benefi ts.a Levels of physical activity in adults, however, have decreased in recent decades.12 Physical inactivity is associated with various morbidities, including hypertension 17 and other cardio-vascular diseases and diabetes 10. Therefore, interest in the promotion of PA has increased in an effort to reduce the negative impacts of physical inactivity.10
To date, low adherence to programs that promote PA has limited their results. Factors such as weather, poor support from family and friends, lack of time and motivation, low quality of public spaces and fi nancial diffi culties have been reported to be barriers of PA.2,26 In contrast, personal satisfaction and the possibility of social interaction can have a positive infl uence on promoting PA.20,26 The perception of satisfaction (i.e., enjoyment) seems to be an important mediator of moti-vation for PA, and substantially contributes to active physical behavior.1,5,8
Studies conducted with adolescents 5 and adults 8,22 have reported that individuals who are more satisfi ed with PA are more active. Our literature review did not reveal any studies of the psychosocial aspects of PA that made reference to satisfaction among Brazilian adults. This gap in the literature can be partially attributed to the lack of quality psychometric instruments that are appropriate for the Brazilian sociocultural context. To better understand the role of psychosocial aspects in promoting PA, we need to develop instruments that allow us to evaluate the relationship between personal satisfaction and PA.
The present study aimed to validate and test the reliabi-lity of the satisfaction scale for physical activity (SSPA) among Brazilian adults.
METHODS
The data analyzed in the present study were taken from a project designed to designed to evaluate various aspects of the health, lifestyle and leisure habits of the population residing close to parks and plazas in the city of Curitiba, Southern Brazil, from April 2009 to July 2009. Parks and plazas were selected according to the socioeconomic conditions of the neighborhood where they were located and the environmental quality.19
All street segments in a 500-m radius around the parks and plazas selected for the study (n = 1,899), and all domiciles in these segments were enrolled. Only the segments that contained at least one domicile (n = 1,538) were considered eligible. Using the EpiInfo software, a table of random numbers was generated for a lottery that selected one domicile per segment. In our visits to these domiciles, the interviewers used a similar lottery to randomly choose one eligible resident from each domicile to be interviewed, according to the methodology proposed by Kish.11
Individuals aged 18 years or older who had resided in the domicile in question for at least one year were considered eligible. The individuals who did not reside in the domicile (e.g., maids and visitors) were excluded.
In addition, we excluded individuals with physical limitations that prevented them from performing PA or who had any cognitive limitations that would make it diffi cult for them to understand the questionnaire.
During the data collection process, 25 interviewers (all at least 18 years) who had completed their high school education received 30 hours of theoretical and practical training on the distribution, completion and codifi cation of the questionnaire. The interviewers were instructed to conduct the interviews in an appropriate location within the domicile to avoid the infl uence of other family members. Interviews were conducted in 95% (n = 1,461) of the eligible segments;the interviewers did not encounter any eligible residents in the remaining segments (5%). In addition, 7.9% (n = 121) of the residents refused to participate. Quality control was performed by fi eld supervisors who redid the interviews for 12.5% of the same sample.
Reliability was tested through repeated interviews conducted for a subsample of individuals who were selected in a systematic and random manner from the participants used in the fi rst stage of the data collec-tion. For every fi ve subjects interviewed, one was invited to participate in a second interview but only 74 people accepted to be interviewed twice. The second interviews, which were conducted after an interval of seven to ten days, were performed over the phone by the fi eld supervisors.
To evaluate satisfaction regarding the performance of PA, we used a translated and adapted version of the original scale developed by San Diego State University (USA), which was used in the Neighborhood Quality of Life Study,b The original tool consisted of six ques-tions related to satisfaction with moderate and vigo-rous physical activity (MVPA), which were evaluated separately. The responses were communicated using a 5-point Likert scale.
In the present study, the SSPA was tested with reference to two items (divided by blocks) using questions about satisfaction resulting from walking and MVPA. We opted to analyze these psychometric characteristics separately for PA of different types and intensity levels because the perception of satisfaction is distinct for each case. Walking is a common human activity, whereas MVPAs involve more complex motor actions and greater intensity.
Each block was composed of three questions: The fi rst block addressed satisfaction related to walking: 1) Do you enjoy walking in your free time? 2) Do you feel good while walking in your free time? 3) Do you feel well after walking in your free time? The second block addressed satisfaction related to MVPA: 4) do you
like to practice moderate or vigorous activity in your free time? 5) Do you feel well while participating in moderate or vigorous activity in your free time? 6) Do you feel well after participating in moderate or vigorous activity in your free time?
The questions were applied in a sample of adults with low, medium and high levels of education (n = 20) to verify clarity and comprehension regarding the order and form of the scales. During the interviews, we observed that subjects with lower levels of education presented greater diffi culty understanding the questions. Thus, we adapted the original 5-point scale into a 3-point scale (the choices were no, a little or a lot). The diffi culty that some individuals experienced with the original scale was understandable given the differences between the sociocultural characteristics of Brazil and those of other countries with higher levels of education. In addition, domiciliary interviews using complex psychometric scales are more common in North American countries than in Brazil. The adapted SSPA used in the present study is presented in the Appendix.
A 3-point scale was used (“no”, “a little” and “a lot”). The scores were computed using the sum of the responses for each block, and two scores varying from zero to six points were generated to indicate greater or lesser satisfaction with either walking or MVPA.
Physical activity was evaluated using the leisure module from the long version of the International Physical Activity Questionnaire,4 which was appropriately adapted for the Brazilian population.15 The questions were designed to determine whether the participants spent at least ten minutes walking and engaging in MVPA per week, and the questionnaire required that the participants indicate the duration of activity. The information on MVPA was grouped and analyzed separately from the information on walking so that the SSPA questions could be compared in a specifi c manner.
Gender, age, socioeconomic level and self-perceptions regarding health were also considered in the question-naire. Socioeconomic status was evaluated according to the criteria for economic classifi cation in Brazil c. The classes were grouped into A (A1+A2, wealthier), B (B1+B2) and C (C+D+E, poorer). Health self-percep-tion was evaluated using the following quesself-percep-tion: “How do you consider your health?” The response options were given using a 4-point Likert scale (bad, regular, good and very good). The “good” and “very good” responses were grouped together to create a variable called “positive health perception”.d
The structure of the scale was verifi ed using exploratory
factor analysis, and varimax rotation was used to
verify the load of each item. Sampling adequacy was tested with the Kaiser-Meyer-Olkin (KMO) method. Eigenvalues ≥ 1.0 and items with a load > 0.4 were deemed acceptable.
To validate the SSPA construct, we compared the sum of the scores for walking and MVPA with the weekly time dedicated to those activities. For this purpose, we used Spearman (rho) rank-order correlation. In this analysis, we assumed that a positive and specifi c association existed between the scale scores and PA (e.g., minutes/ week of walking and the satisfaction score associated with walking). This method was intended to indicate the meaning of the relationship rather than demonstrate a positive correlation between the variables.
Reliability was evaluated by determining internal consistency (Cronbach’s α) and temporal stability (intraclass correlation coeffi cient – ICC), with the latter evaluated using the test-retest method. Values for α and ICC ≥ 0.70 were considered acceptable reliability.25 All analyses were performed using the SPSS 15.0 software, and the required signifi cance level was 5%.
The individuals were informed about the research procedures and voluntarily agreed to participate. The study was approved by the Committee of Ethics in Research of Escola Superior de Educação Física da Universidade Federal de Pelotas (protocol nº 005/2008) on 12/17/2008.
RESULTS
Table 1 shows the characteristics of the interviewees (n = 1,461) and the subsample used to determine temporal stability (n=74). A high proportion of the participants in the overall sample (49.6%) were at the intermediate socioeconomic level (B). In addition, 69% reported positive perceptions regarding their own health, and 61.7% and 76.2% did not practice walking or MVPA, respectively, in their free time. The subsample used to determine temporal stability presented characteristics similar to those of the overall sample for all variables examined in the present study.
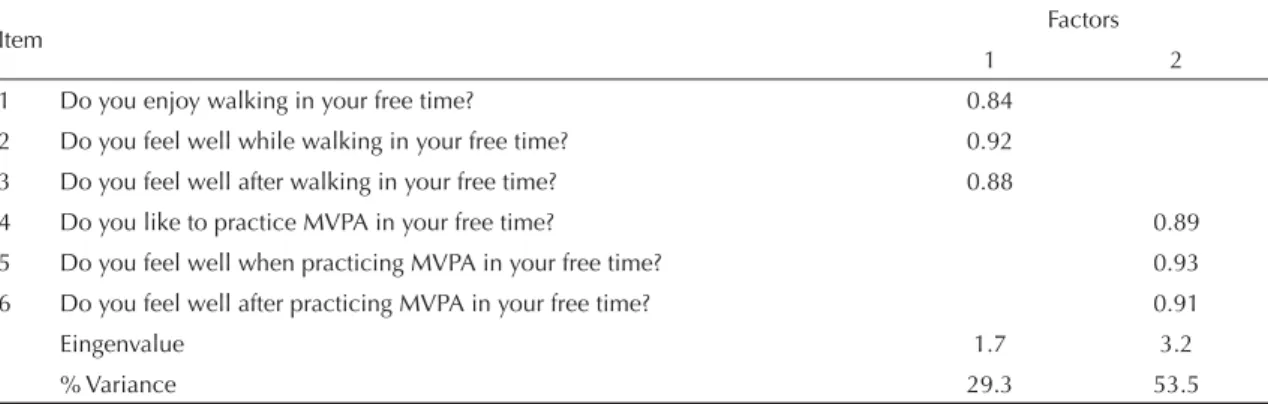
The exploratory factor analysis identifi ed two inde-pendent, signifi cant factors with eigenvalues ≥ 1.0. The combination of the two factors was able to explain 82.8% of the total variance. Factor 1 consisted of three items regarding satisfaction with walking (variance = 29.3%). Factor 2 (variance = 53.5%) also consisted of three items, but these were related to MVPA. All items presented load at ≥0.84 in the respective factor (Table
c ABEP. Associação Brasileira de Empresas de Pesquisa. Critério de classifi cação econômica do Brasil, 2009. [Internet]. [cited January 10 2010]. Available from: http://www.abep.org/novo/CMS/Utils/FileGenerate.ashx?id=46
2). The present sample was adequately large enough for the procedures employed during the factor analysis (KMO = 0.74; p < 0.001).
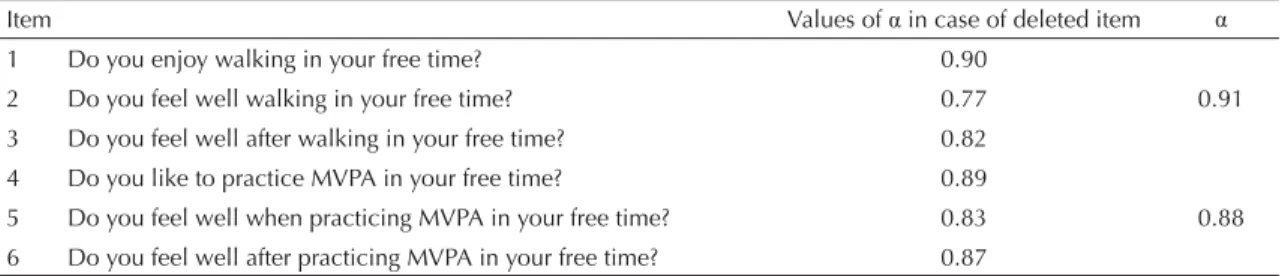
The internal consistency (Cronbach’s α) was signifi -cant for all items (Table 3), and the values were high for walking (α=0.91) and MVPA (α=0.88). All items were important in explaining the total variance of each factor; however, only the fi rst MVPA item could posi-tively alter the total α if the item was removed from the scale. Moreover, this alteration would not create a signifi cant increase in the fi nal value. Thus, the item was kept because the total α value was high (α=0.88).
We observed a signifi cant positive correlation between the factors mentioned and the PA indicators for both walking (rho = 0.23; p < 0.001) and MVPA (rho = 0.21; p < 0.001). We also observed that the SSPA score for walking was not correlated with the number of minutes of MPVA or with the SSPA score for MVPA. The results indicate a relationship between higher levels of
satisfaction with PA and greater time spent engaging in PA. This association was specifi c to the type of PA (walking versus MVPA).
The results of the temporal stability analysis are presented in table 4. The ICC values were 0.71 for walking (95%CI: 0.49;0.83) and 0.75 for MVPA (95%CI: 0.53;0.87). The concordance was high for all scale items for both walking (71.7% to 81.1%) and MVPA (80.5% to 92.6%).
DISCUSSION
The SSPA proposed in the present study showed psychometric characteristics adequate for its use in studies of Brazilian adults.
The results of the SSPA application suggest that the intensity and type of PA must be considered to analyze perceptions regarding PA satisfaction. Indeed, the issues of walking and MVPA satisfaction are distinct.26 The
Table 1. Characteristics of the study participants. Curitiba, Southern Brazil, 2009.
Characteristics
Factor analysis and validation (n = 1,461)
Reliability Analysis
(n = 74) χ2 p
n % n %
Women 931 63.7 52 70.3 1.04 0.25
Age range (years)
18 to 39 604 41.5 30 42.9
40 to 59 668 45.9 36 51.4 3.09 0.21
≥ 60 184 12.6 4 5.7
Socioeconomic Level
A (highest) 182 12.5 11 14.9
B 720 49.6 38 51.4 0.67 0.71
C 551 37.9 25 33.8
Positive self-perceptions regarding health 1041 69.0 47 62.1 1.69 0.19
0 min walking/week 901 61.7 40 54.1 1.42 0.23
0 min MVPA/week 671 76.2 57 77.0 0.23 0.10
AFMV: atividade física moderada e vigorosa.
Table 2. Exploratory factor analysis of the satisfaction scale for physical activity. Curitiba, Southern Brazil, 2009.
Item Factors
1 2
1 Do you enjoy walking in your free time? 0.84 2 Do you feel well while walking in your free time? 0.92 3 Do you feel well after walking in your free time? 0.88
4 Do you like to practice MVPA in your free time? 0.89 5 Do you feel well when practicing MVPA in your free time? 0.93 6 Do you feel well after practicing MVPA in your free time? 0.91
Eingenvalue 1.7 3.2
% Variance 29.3 53.5
exploratory factor analysis (Table 2) suggests that two independent factors explain the total variance. The
fi rst factor, which was related to walking satisfaction, presented a high load of factors (between 0.84 and 0.92). The same result was observed for MVPA (the second factor), which had a load between 0.89 and 0.93; however, the variance was greater for MVPA (53.5%
versus 29.3% for walking satisfaction). The factor
structure was different from that of the original scale, which was only used to analyze MVPA.21
In general, the individuals presented distinct percep-tions regarding their “enjoyment” of PA at different levels of intensity. For example, many individuals enjoyed walking but did not indicate that they received satisfaction from vigorous physical activities, such as running and sport practices. Two recent surveys of PA in adults suggested that men are more active and spend more time engaged in MVPA.7,14 In part, this may be explained by the greater demand for vigorous activity among men. In contrast, women tend to practice less intense PA.13 In addition to differences in biology, cultural considerations are also different for men and women. For example, women are raised to care about their families from an early age, whereas men are more oriented toward manual labor and other activities that require more vigorous physical activity.24
The internal consistency of the scales for both walking (α = 0.91) and MVPA (α = 0.88) was adequate25 and similar to that of other studies.18,23,27 The α value was > 0.70 for all the scale items, which shows that all items make an important contribution, and each scale
has a consistent structure (Table 3). Other studies that have investigated the psychometric characteristics of PA satisfaction in children3 and adolescents16 found high reliability values (α = 0.85)3 that were similar to those of the present study. Using a scale with 18 items, Heesch et al. tested the psychometric characteristics of PA satisfaction in a study of 378 adults between the ages of 25 and 75 years old and attained a value of α=0.95,9 The higher number of items on the scale of Heesch et al’s study can explain the high α value,9 as the number of items of the tool directly infl uences that value.
In our analysis of the correlation between the SSPA factors and PA indicators, we expected that the indivi-duals with the highest satisfaction scores would present positive PA indicators (even though satisfaction is not the only variable that explains PA).26 We found that satisfac-tion related to walking and MVPA exhibited a positive moderate correlation with time spent on those activities.
The reliability results were positive (71.7% to 92.6%). Although the second interview was conducted by phone, this did not seem to significantly alter the reliability results. These values were similar or even greater than those reported by studies of psychosocial scales for PA.3,6,16
Despite the effort made in the present study to validate and test the reliability of the SSPA in Brazilian adults, some limitations need to be considered. The scale was tested using a sample of adults who were residents of the city of Curitiba. Sixty-two percent of the study participants were from high socioeconomic levels, and 69% exhibited positive perceptions of their health. Table 4. Values for intraclass concordance and correlation for the temporal stability subsample. Curitiba, Southern Brazil, 2009.
Item %C ICC 95%CI
1 Do you enjoy walking in your free time? 71.7
0.71 0.49;0.83 2 Do you feel well walking in your free time? 75.5
3 Do you feel well after walking in your free time? 81.1
4 Do you like to practice MVPA in your free time? 80.5
0.75 0.53;0.87 5 Do you feel well when practicing MVPA in your free time? 92.6
6 Do you feel well after practicing MVPA in your free time? 87.6
%C: concordance percentage (test-retest); ICC: intraclass correlation coeffi cient; MVPA: moderate and vigorous physical activity.
Table 3. Analysis of internal consistency of items comprising the satisfaction scale for physical activity. Curitiba, Southern Brazil, 2009.
Item Values of α in case of deleted item α
1 Do you enjoy walking in your free time? 0.90
0.91 2 Do you feel well walking in your free time? 0.77
3 Do you feel well after walking in your free time? 0.82 4 Do you like to practice MVPA in your free time? 0.89
0.88 5 Do you feel well when practicing MVPA in your free time? 0.83
Research in other locations must also consider socioe-conomic status and individual health perceptions when comparing and analyzing their results. Importantly, our reliability results were signifi cant and satisfac-tory. We performed self-reported measurements, however, which present a less precise estimation of PA. Nonetheless, the patterns of PA (more or less time spent performing PA) were adequate for us to compare
with the scale scores.
Based on the results shown in the present study, we can
confi rm the validity of the SSPA model, which exhibited internal consistency and reliability that is suffi cient
to evaluate satisfaction regarding the performance of walking and MVPA among Brazilian adults.
1. Allender S, Cowburn G, Foster C. Understanding participation in sport and physical activity among children and adults: a review of qualitative studies. Health Educ Res. 2006;21(6):826-35. DOI:10.1093/ her/cyl063
2. Cassou ACN, Fermino RC, Reis RS, Rodrigues Anez CR, Santos MS, Domingues MR. Barriers to physical activity among brazilian elderly women from different socioeconomic status. A focus-group study. J Phys Activ Health. 2010;8(1):126-32.
3. Colón WI, Rodríguez C, Ito M, Reed CN. Psychometric evaluation of the Spanish version of the children’s assessment of participation and enjoyment and preferences for activities of children. Occup Ther Int. 2008;15(2):100-13. DOI:10.1002/oti.250
4. Craig CL, Marshall AL, Sjöström M, Bauman AE, Booth ML, Ainsworth BE, et al. International physical activity questionnaire: 12-country reliability and validity. Med Sci Sports Exerc. 2003;35(8):1381-95.
5. Dishman RK, Motl RW, Sallis JF, Dunn AL, Birnbaum AS, Welk GJ, et al. Self-management strategies mediate self-effi cacy and physical activity. Am J Prev Med. 2005;29(1):10-8. DOI:10.1016/j.amepre.2005.03.012
6. Fernández García E, Sánchez Bañuelos F, Salinero Martín JJ. Validación y adaptación de la escala PACES de disfrute con la práctica de la actividad física para adolescentes españolas. Psicothema. 2008;20(4):890-95.
7. Florindo AA, Hallal PC, Moura EC, Malta DC. Prática de atividades físicas e fatores associados em adultos, Brasil, 2006. Rev Saude Publica. 2009;43(1):65-73. DOI:10.1590/S0034-89102009000900009
8. Hagberg LA, Lindahl B, Nyberg L, Hellenius ML. Importance of enjoyment when promoting physical exercise. Scand J Med Sci Sports. 2009;19(5):740-7. DOI:10.1093/her/cyl054
9. Heesch KC, Masse LC, Dunn AL. Using Rasch modeling to re-evaluate three scales related to physical activity: enjoyment, perceived benefi ts and perceived barriers. Health Educ Res. 2006;21(Suppl 1):i58–i72.
10. Hu G, Eriksson J, Barengo NC, Lakka TA, Valle TT, Nissinen A, et al. Occupational, commuting, and leisure-time physical activity in relation to total and cardiovascular mortality among Finnish subjects with type 2 diabetes. Circulation. 2004;110(6):666-73. DOI:10.1161/01.CIR.0000138102.23783.94
11. Kish L. Sampling Organizations and Groups of Unequal Sizes. Am Sociol Rev. 1965;30(564-72).
12. Knuth AG, Bacchieri G, Victora CG, Hallal PC. Changes in physical activity among Brazilian adults over a fi ve-years period. Epidemiol Community Health. 2009;64(7):591-95.
13. Malta DC, Moura EC, Castro AM, Cruz DKA, Neto OLM, Monteiro CA. Padrão de atividade física em adultos brasileiros: resultados de um inquérito por entrevistas telefônicas, 2006. Epidemiol Serv Saude. 2009;18(1):7-16.
14. Martins TG, Assis MAAd, Nahas MV, Gauche H, Moura EC. Inatividade física no lazer de adultos e fatores associados. Rev Saude Publica. 2009;43(814-24. DOI:10.1590/S0034-89102009005000058
15. Matsudo S, Araújo T, Marsudo V, Andrade D, Andrade E, Oliveira lC, et al. International physical activity questionnaire (IPAQ): study of validity and reability in Brazil. Rev Bras Ativ Fis Saude. 2001;6(2):5-18.
16. Motl RW, Dishman RK, Saunders R, Dowda M, Felton G, Pate RR. Measuring enjoyment of physical activity in adolescent girls. Am J Prev Med. 2001;21(2):110-17.
17. Pugliese R, Zanella MT, Blay SL, Plavinik F, Andrade MA, Galvao R. Effi cacy of lifestyle change psychological intervention in coronary risk reduction. Arq Bras Cardiol. 2007;89(4):225-30. DOI:10.1590/ S0066-782X2007001600003
18. Reis RS, Sallis JF. Reliability and validity of the brazilian version of social support for exercise scale for adolescents. Rev Bras Cien e Mov. 2005;13(2):7-14.
19. Reis RS, Hallal PC, Parra DC, Ribeiro IC, Browson RC, Ramos LR, et al. Promoting physical activity through community-wide policies and planning: fi ndings from Curitiba, Brazil. J Phys Act Health. 2010;7(Suppl 2):S137-45.
20. Sallis JF, Owen N. Physical activity and behavioral medicine. San Diego: SAGE Publications; 1998. (Behavioral Medicine and Health Psychology, 3).
21. Sallis JF, Alcaraz JE, McKenzie TL, Hovell MF. Predictors of change in children’s physical activity over 20 months. Variations by gender and level of adiposity. Am J Prev Med. 1999;16(3):222-9.
22. Salmon J, Owen N, Crawford D, Bauman A, Sallis JF. Physical activity and sedentary behavior: a population-based study of barriers, enjoyment, and preference. Health Psychol. 2003;22(2):178-88. DOI:10.1037/0278-6133.22.2.178
23. Santos MS, Hino AAF, Reis RS, Rodriguez-Añez CR. Prevalência de barreiras para a prática de atividade física em adolescentes. Rev Bras Epidemiol. 2010;13(1):94-104. DOI:10.1590/S1415-790X2010000100009
24. Seabra A, Mendonça DM, Thomis MA, Anjos LA, Maia JAR. Biological and socio-cultural determinants of physical activity in adolescents. Cad Saude Publica. 2008;24(4):721-36. DOI:10.1590/S0102-311X2008000400002
25. Terwee CB, Bot SDM, Boer MR, Van Der Windt DAWM, Knol DL, Dekker J, et al. Quality criteria were proposed for measurement properties of health status questionnaires. J Clin Epidemiol. 2007;60(34-42). DOI:10.1016/j.jclinepi.2006.03.012
26. Trost SG, Owen N, Bauman AE, Sallis JF, Brown W. Correlates of adults’ participation in physical activity: review and update. Med Sci Sports Exerc. 2002;34(12):1996-2001. DOI:10.1249/01. MSS.0000038974.76900.92
27. Zubaran C, Foresti K, Thorell MR, Franceschini PR, Homero W. Portuguese version of the Quality of Life Enjoyment and Satisfaction Questionnaire: a validation study. Rev Panam Salud Publica. 2009;25(5):443-8. DOI: 10.1590/S1020-49892009000500010
APPENDIX
Escala de satisfação com a prática de atividade física
As questões abaixo estão relacionadas a quanto você gosta e/ou se sente bem realizando atividade física. Não existem respostas corretas. Assinale apenas uma opção para cada questão.
Para responder as questões, lembre que:
Atividades físicas de intensidade moderada são aquelas que precisam de algum esforço físico, que fazem você respirar um pouco mais forte que o normal e/ou que fazem o seu coração bater um pouco mais forte.
Atividades físicas de intensidade vigorosa são aquelas que precisam de um grande esforço físico, que fazem você respirar muito mais forte que o normal e/ou que fazem o seu coração bater mais forte.
Seção 1. Nesta seção considere somente a caminhada que você faz no seu tempo livre. 1. Você gosta de caminhar no seu tempo livre?
0[ ] Não 1[ ] Um pouco 2[ ] Muito 2. Você se sente bem quando está caminhando no seu tempo livre?
0[ ] Não 1[ ] Um pouco 2[ ] Muito
3. Você se sente bem depois que caminha no seu tempo livre?
0[ ] Não 1[ ] Um pouco 2[ ] Muito
Seção 2. Nesta seção considere as atividades físicas de intensidade moderada e/ou vigorosa (exemplo: correr, nadar, pedalar, jogar vôlei, futebol, etc.). Não inclua a caminhada.
4. Você gosta de fazer atividade física de intensidade moderada ou vigorosa no seu tempo livre? 0[ ] Não 1[ ] Um pouco 2[ ] Muito
5. Você se sente bem quando está fazendo atividade física de intensidade moderada ou vigorosa no seu tempo livre? 0[ ] Não 1[ ] Um pouco 2[ ] Muito