AR
TICLE
1 Núcleo de Física Molecular e Fluidos, Instituto de Física, Universidade de Brasília (UnB). Campus Darci Ribeiro s/n, Asa Norte. 70910-900 Brasília DF Brasil.
[email protected] 2 Escola Nacional de Saúde Pública, Fiocruz. Rio de Janeiro RJ Brasil. 3 Centro de Estudos Avançados Multidisciplinares, UnB. Brasília DF Brasil.
The
Mais Médicos
(More Doctors) Program,
the infrastructure of Primary Health Units
and the Municipal Human Development Index
Abstract The main objective of this article was to examine the context in which professionals
working within the Mais Médicos (More Doctors)
Program operate. This study used the infrastruc-ture scale of primary health units (PHUs), which was recently developed by Soares Neto and colle-agues to provide more information regarding the relationship between the infrastructure of PHUs and the Municipal Human Development Index
(MHDI) of municipalities that received Mais
Médicos Program doctors. Using exploratory and inferential statistics, the article shows that 65.2%
of the PHUs that received Mais Médicos Program
doctors had medium-quality infrastructure and only 5.8% of them had low-quality infrastructure. The correlation of 0.50 between the infrastructu-re indicator and the MHDI points to a moderate tendency for municipalities with low MHDIs to have more precarious PHUs. Using multiple line-ar regression analysis it can be inferred that the main factor that contributed to the increase in the infrastructure indicator of the PHUs was the average municipal income. On the other hand, the factor that negatively affected the infrastructure of the PHUs was being located in the north or
nor-theast regions.
Key words Mais Médicos Program, infrastruc-ture, municipal human development index, pri-mary health unit, indicators
Joaquim José Soares Neto 1
Maria Helena Machado 2
So
ar
es N
Introduction
During the first decade of this century, studies have indicated a shortage of doctors in Brazil. A report published in 2010 by the Center for Stu-dies in Public Health at the Federal University of Minas Gerais (NESCON/UFMG) found that 97.6% of municipalities had a shortage of doc-tors and that 400 municipalities were totally la-cking in doctors. In a response to this need, the Brazilian government launched the Mais Médi-cos Program through Law No. 12,871, which was passed on 22/10/20131. The implementation of
the Mais Médicos Program resulted in intense
discussions regarding the numbers of doctors in Brazil and their training.
Mais Médicos Program doctors were
assig-ned to primary health units (PHUs), which were located in very different situations: rural, indi-genous, quilombolas, border regions, and on the outskirts of large towns and cities, from the south to the north of Brazil. Because of this, the infras-tructure of the units in which Mais Médicos Pro-gram doctors worked has also been the subject of much debate. For example, the following was the headline of an article published in the iG portal on 7/7/2013: “Lack of adequate infrastructure is an obstacle to the regional distribution of doc-tors: doctors argue that without a guarantee of good working conditions, not even foreign doc-tors will work in the interior or on the periphe-ries of large cities”2.
Nora and Junges3 performed a literature re-view and a subsequent metasynthesis, which ai-med to analyze the humanization practices wi-thin the Brazilian health system. They pointed out that problems related to the context in which work was performed interfered in the work pro-cess itself, compromising the quality of services, demotivating professionals and managers, and causing discomfort to service users. The lack of adequate space in health units led to a lack of pri-vacy in conversations between professionals and service users. In addition, these authors found that a lack of equipment and material resources in the units interfered with the continuity of care, and that it created unfavorable working condi-tions.
Given that the infrastructure conditions en-countered by Mais Médicos Program professio-nals has had an effect on their performance, the monitoring of such conditions should be one of the central concerns of the Mais Médicos Pro-gram. Moreover, in order that new public policies can be planned to improve service conditions,
greater knowledge is required about the specific reality of each PHU in which professionals from
the Mais Médicos Program operate.
The monitoring and evaluation of govern-mental intervention programs has been conside-red to be an important part of the program itself. In the specific case of the Mais Médicos Program, part of Law No. 12.8711 concerns the structuring of evaluative research in order to monitor the development of the program. The Bolsa Família
(Family Allowance) Program, which is another public policy of great social impact, also incor-porates an established policy of monitoring and evaluation.
In terms of the evaluation procedures and monitoring of public policies, P. M. Jannuz-zi4 writes, “Information and knowledge are key inputs for the improvement and innovation of public policies and programs. In isolation they are not enough, but they are certainly essential, given the scale, scope and complexity that charac-terize governmental action in the contemporary world”. In the same publication, Jannuzzi4 conti-nues: “The monitoring of programs requires an intelligent selection of key indicators regarding resources, processes, products and, if possible, of results and potential impacts, which are or-ganized in a way that allows for the continuous monitoring of critical activities of the program and the timely decisions that are necessary for its proper working. Completeness, redundancy and ambiguity are not good or objective attributes for a monitoring system. Regularity, timeliness and sensitivity are what are expected of the indicators of such a system”.
To monitor the evolution of the material con-ditions of PHUs, Soares Neto et al.5 constructed an infrastructure scale regarding PHUs in Brazil. A scale is a sophisticated way of constructing an indicator. The authors claim that “the advantages of having a scale are multiple, highlighting the fact that the level of infrastructure of a PHU can be more easily understood; for example, given the infrastructure score one knows the probability of whether that PHU has clusters of infrastructure items evaluated in the questionnaire”.
regar-aúd
e C
ole
tiv
a,
21(9):2709-2718,
2016
ding life expectancy at birth, education, and GDP per capita. Each year, the United Nations (UN) classifies its member countries according to their HDI. Furthermore, this index can be calculated for states, cities, villages, etc.
Since 2012, the Brazilian UNDP, the IPEA and the João Pinheiro Foundation have used the global HDI methodology to obtain the pal HDI (MHDI) of the 5,565 Brazilian munici-palities. The calculations are based on the data of three censuses that were performed by the Brazi-lian Institute of Geography and Statistics (IBGE) - 1991, 2000 and 2010 - and according to the mu-nicipal grid that existed in 2010.
According to the Atlas of Human Develop-ment6, “the Brazilian MHDI considers the same three factors as the global HDI, i.e. longevity, education and income but it goes further and fits the global methodology to the Brazilian con-text and the availability of Brazilian indicators. Although it measures the same phenomena, the indicators taken into account in the MHDI are better suited to evaluate the development of Bra-zilian cities and metropolitan regions”.
This article is based on the aforementioned infrastructure of scale and the MHDI. The analy-sis is provided in order to provide greater know-ledge about the conditions of the infrastructure in Brazilian PHUs and their relationship to the MHDI.
Results are also presented regarding the mu-nicipalities, in which comparisons will be made of the infrastructure conditions of the PHUs taking into account the size of the municipality. For the analysis of the information, descriptive and inferential statistical analysis of the level of infrastructure of PHUs is used.
The relevance of the study of the relationship between the infrastructure of Brazilian PHUs and the MHDI is underpinned by the expectation of a strong relationship between these two varia-bles, which would show that there is a tendency that municipalities with a low MHDI would also have PHUs with low infrastructure scores; and on the other hand, municipalities which had a high MHDI would also have high infrastructure scores.
Infrastructure of low complexity and with insufficient material resources compromises the development and quality of primary care actions that are currently being developed by municipa-lities and these factors also limit the potential to expand actions from the perspective of reorgani-zing health care models and practices.
The infrastructure scale and the Mais Médicos Program
The article by Soares Neto et al.5 describes in detail the methodology used to obtain the infras-tructure scale of Brazilian PHUs. That scale will be used in the current article to provide further information about the context in which doctors from the Mais Médicos Program operate.
An important feature of any scale is its abili-ty to create different levels of complexiabili-ty. In the specific case of infrastructure, six levels of com-plexity were created. Level 1 refers to PHUs with quite a basic infrastructure, while Level 6 refers to PHUs with more sophisticated equipment and structures.
Because other data collection has already been carried out, or even by using the data from the National Health Establishments Census (CNES), it is possible to compare the temporal series and to check the progress of the infrastruc-ture of each individual PHU. It is also possible to check PHUs in individual cities, states or even the country as a whole. In addition, if information regarding other infrastructure items were to be obtained in future data collections, they could be simply included on the scale.
Recognizing the importance of having struc-tural features and equipment that make it possi-ble to meet primary care health needs, the Brazi-lian Ministry of Health launched “The Physical Structure of Primary Health Units Manual: fa-mily health”7, which proposed that the physical structure of PHUs acts as facilitator of changes in health practices, thereby favoring changes in the Brazilian health care model. This manu-al7 follows the principles of Resolution of the Collegiate Directorate (RDC No. 50/ANVISA/ February/20028), which deals with technical re-gulations for the planning, programming and evaluation of physical projects of healthcare es-tablishments (EAS).
cle-So
ar
es N
aning and decontamination; a sterilization room; an area for solid waste; and a trash storage area.
The present study used data from the PMAQ census data of 2012 (6th June version). This da-tabase provides information from 38,308 PHUs. However, it was observed that out of this total, 3,449 health units did not complete the question-naire required by the 2012 PMAQ census and the-refore they could not be included in the analysis. The Register of Doctors dated September 2014, which was available from the Open Uni-versity of the National Health Service (UNASUS) was used to provide information about the num-bers of doctors in units who were working within
the Mais Médicos Program. Data were used from
doctors allocated to PHUs until the fifth cycle. Out of a total of 14,702 practicing physicians there was information regarding the figures for PHUs without repetition for 11,136 doctors. Sub-sequently, 2,671 more doctors registered in PHUs were added from CNES data (August 2014), making a total of 13,351 doctors working within
the Mais Médicos Program who were allocated to
known PHUs. Data relating to the infrastructure level were found for 9,902 PHUs with Mais
Mé-dicos Program doctors. From this analysis, it was
found that 2,115 Brazilian municipalities did not have doctors working within the Mais Médicos
Program allocated until September 2014. Of the
3,198 municipalities with Mais Médicos Program doctors, about 50% received the service of only one such doctor and 19% received the service of two such doctors. It is necessary to investigate the location and trajectory of these doctors using more recent data, given that the Mais Médicos
Program continued to grow after 2014.
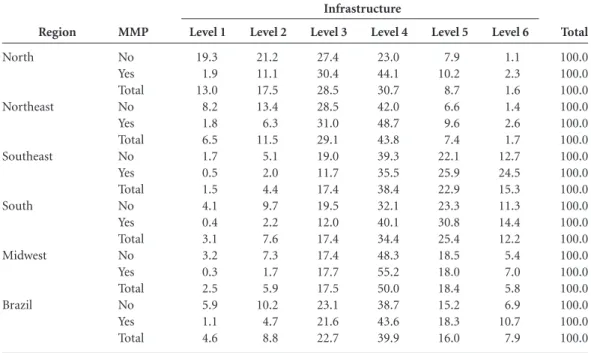
Table 1 shows the percentage of PHUs in rela-tion to levels of infrastructure and the allocarela-tion of at least one Mais Médicos Program doctor.
Table 1 provides an important contribution to public policy. It shows the conditions of the PHUs in Brazil within the five geographical re-gions in summary form, and more specifically, those units which contained Mais Médicos Pro-gram doctors.
It was observed that in Brazil most PHUs that were allocated Mais Médicos Program doc-tors had infrastructure Levels of 3 and 4 (65.2%). The lowest percentage of PHUs was found for Level 1 (only 1.1%). About 64% of PHUs were classified within three main infrastructure levels, i.e. Levels 4, 5 and 6. Few PHUs were at the extre-mes of the scale; 4.6% at Level 1 (indicating the lowest infrastructure level) and 7 9% at Level 6 (the highest infrastructure level).
Regarding the degrees of complexity of the PHUs found in this study, generally there were hi-gher percentages in the lower range levels (Levels
Total 100.0 100.0 100.0 100.0 100.0 100.0 100.0 100.0 100.0 100.0 100.0 100.0 100.0 100.0 100.0 100.0 100.0 100.0 Region North Northeast Southeast South Midwest Brazil MMP No Yes Total No Yes Total No Yes Total No Yes Total No Yes Total No Yes Total Level 1 19.3 1.9 13.0 8.2 1.8 6.5 1.7 0.5 1.5 4.1 0.4 3.1 3.2 0.3 2.5 5.9 1.1 4.6
Table 1. Level of infrastructure of primary health units assessed by the PMAQ Census (2012) and allocation of
doctors working within the Mais Médicos Program (MMP) by geographical region, Brazil 2014.
Level 3 27.4 30.4 28.5 28.5 31.0 29.1 19.0 11.7 17.4 19.5 12.0 17.4 17.4 17.7 17.5 23.1 21.6 22.7 Level 2 21.2 11.1 17.5 13.4 6.3 11.5 5.1 2.0 4.4 9.7 2.2 7.6 7.3 1.7 5.9 10.2 4.7 8.8 Level 4 23.0 44.1 30.7 42.0 48.7 43.8 39.3 35.5 38.4 32.1 40.1 34.4 48.3 55.2 50.0 38.7 43.6 39.9 Level 5 7.9 10.2 8.7 6.6 9.6 7.4 22.1 25.9 22.9 23.3 30.8 25.4 18.5 18.0 18.4 15.2 18.3 16.0
Source: prepared from PMAQ data, 2012.
aúd
e C
ole
tiv
a,
21(9):2709-2718,
2016
1, 2 and 3) in the north and northeast regions and higher percentages were found in the upper levels (Levels 4, 5 and 6) in the southeast, south and mi-dwest. It was found that most of the units in the north (59.0%) and almost half of the units in the northeast (47.1%) were located in the lower levels of the scale (Levels 1, 2 and 3), unlike the southe-ast, south and midwest, in which most units were at higher levels (Levels 4, 5 and 6). It is notewor-thy that even in the north, which contained about 30% of PHUs with Level 1 and 2 infrastructure, only 13% of PHUs that had allocated Mais
Mé-dicos Program doctors had such a low levels. In
the north, 13.0% of PHUs had Level 1 type in-frastructure. It is noteworthy that this percentage was much lower in the southeast (1.5%), midwest (2.5%) and the south (3.1%).
The Mais Médicos Program, the Municipal Human Development Index (MHDI) and the infrastructure of Primary Health Units
This section provides a detailed study of how the Municipal Human Development Index is related to the infrastructure of the PHUs basic health units. It is vital to check this relationship because, as there is a significant relationship be-tween the MHDI and the infrastructure of PHUs, there is a need to prioritize the development of public policies aimed at improving the material conditions of PHUs located in municipalities with a lower MHDI.
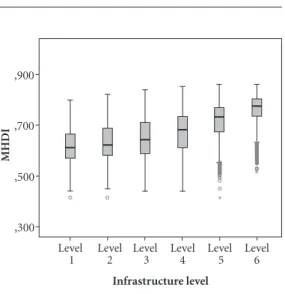
The boxplot that follows presents the MHDI according to the level of infrastructure of the PHU.
The MHDI is a composite measure of indi-cators regarding three factors related to human development: longevity, education and income. The index ranges from 0 to 1, and the closer to 1 the higher the level of human development in a municipality.
In Figure 1, the gray box is separated by the median into two quartiles, the upper and lower (25th and 75th percentiles) quartiles. The me-dian is the score that divides the population into two; half above and half below. The height of the boxes represents the interquartile range and esti-mates the variability of the data. Figure 1 shows that there was a pattern of better infrastructure for PHUs in municipalities with a higher MHDI, mainly at Levels 4 and 5. The value of the me-dian in the municipalities with PHUs at Level 1 and 2 was about 0.62, indicating that 50% of the PHUs at the two lowest levels of infrastructure had an HDI less than or equal to 0.62. However,
a much higher value was found when observing the median of PHUs with Level 6 of infrastructu-re (MHDImedian = 0.78). The vertical lines that le-ave the box are known as cat’s whiskers and they represent the 25% lowest and 25% highest scores (which are not outliers). The small circles repre-sent values that were moderately distant from the interquartiles, and the values that were substan-tially distant are marked with an asterisk. Figure 1 also shows that there were PHUs at Level 5 and 6 in municipalities with a low MHDI, however, these PHUs were considered to be outliers.
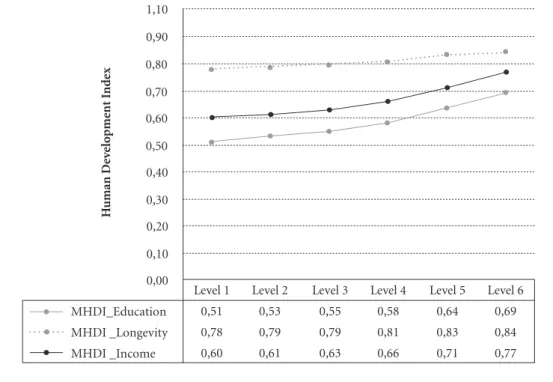
Figure 2 below, shows the average values for each of the three types of MHDI that were avai-lable, namely: MHDI_Longevity, MHDI_Educa-tion and MHDI_Income, according to the level of infrastructure of the PHUs.
Figure 2 shows that the three factors involved in the calculation of the MHDI behaved quite differently when they were analyzed from the perspective of the level of infrastructure of the PHUs. The education factor (MHDI_Education) has the lowest average values for all the levels of infrastructure. The longevity factor (MHDI_ Longevity) had the highest average values. In addition, there was a growing pattern between the level of infrastructure of the PHUs and the MHDI, in particular in relation to the education and income factors.
Figure 1. Boxplot of the Municipal Human Development Index for the level of infrastructure of PHUs.
Source: prepared from PMAQ data (2012) and Brazilian Human Development Atlas.
Infrastructure level Level
1 Level 2 Level 3 Level4 Level 5 Level6 ,300
,500 ,700 ,900
*
MHDI
So
ar
es N
In an analysis of the Pearson Correlation be-tween the MHDI and the average infrastructure score for municipality, there was a moderately high correlation (r=0.50, p<0.01, N=5.542), indi-cating that the higher the development within a municipality the better the infrastructure of the PHUs.
In order to investigate the size of the effects of variables such as MHDI, size of the municipality, and the geographical region of the PHU, multi-ple linear regression analysis was performed. The regression coefficient indicates how much the probability of an event increases with the increa-se of a unit in the independent variable, when all the other variables remain constant. The higher the value of the coefficient (Beta), the greater the predictive power of the explanatory variable regarding the infrastructure scores. In contrast, negative values are associated with a decrease in the infrastructure score. It should be noted that in this analysis the categorized variable was not used in the six infrastructure levels, but its conti-nued value, on a scale from 0 to 100.
The coefficients in Table 2 show that MHDI_ Income was the factor that contributed most to the increase in the infrastructure score for PHUs
(β = 0.206, p < 0.05), followed by MHDI_Educa-tion and the number of inhabitants in the munici-pality (both: β = 0.177, p < 0.05). The positive sign of the coefficient indicated that the greater the (a) income of the municipality, (b) educational level and (c) number of inhabitants of the municipali-ty, the higher the infrastructure score for PHUs.
Furthermore, living in the north or northeast negatively and significantly affected the infras-tructure score (β = -0.115, p < 0.05). The negati-ve sign of the coefficient indicated that the PHUs located in the north and northeast were associa-ted with a decrease in the infrastructure score.
Regarding the number of inhabitants of the municipality, from the data that was analyzed, about 58% of PHUs with Level 1 and Level 2 in-frastructure were located in municipalities with 10,000-50,000 inhabitants. PHUs with Level 6 infrastructure were mainly found in large muni-cipalities: about 66% of such PHUs were in mu-nicipalities with more than 100,000 inhabitants.
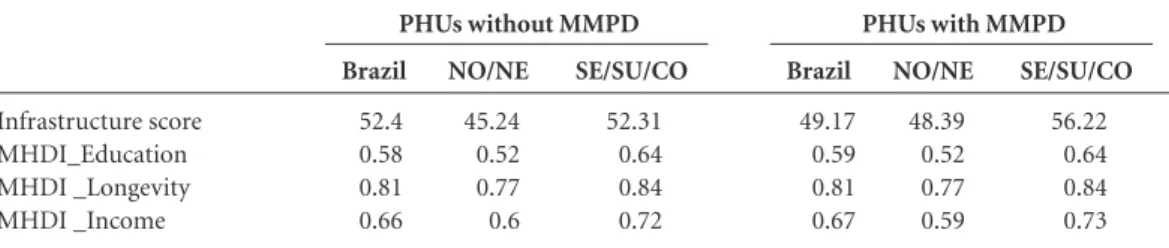
The following table shows the average infras-tructure score and also the average score for the three types of MHDI, according to whether or not there were Mais Médicos Program doctors in the PHUs.
Figure 2. Average Municipal Human Development Index level of infrastructure of PHUs.
Source: prepared from PMAQ data (2012) and Brazilian Human Development Atlas.
0,00 0,10 0,20 0,30 0,40 0,50 0,60 0,70 0,80 0,90 1,10
MHDI_Education MHDI _Longevity MHDI _Income
Level 1 0,51 0,78 0,60
Level 2 0,53 0,79 0,61
Level 3 0,55 0,79 0,63
Level 4 0,58 0,81 0,66
Level 5 0,64 0,83 0,71
Level 6 0,69 0,84 0,77
H
uman De
ve
lo
pme
nt I
nd
aúd
e C
ole
tiv
a,
21(9):2709-2718,
2016
Table 3 shows that the infrastructure score was slightly higher in PHUs that had health units that had Mais Médicos Program doctors. The ave-rage values for MHDI were very similar and the largest difference was found for MHDI_Educa-tion and MHDI _Income.
When these average scores were analyzed only considering two areas - (1) north and nor-theast and (2) sounor-theast, south and midwest the biggest difference in HDI scores was in terms of location, and not the allocation of Mais Médicos
Program doctors. In general, PHUs that were allocated Mais Médicos Program doctors had sli-ghtly higher infrastructure scores, regardless of their location.
Conclusion
Many studies have provided in-depth knowle-dge about social inequality in Brazil. In recent decades, with the possibility of collecting more and more accurate data due to technological
ad-vances, it has become possible to construct good social indicators, which in turn has made it pos-sible to expand the level of analysis that can be performed and therefore provide greater unders-tanding about the issue being studied.
This study used a scale of infrastructure of primary health units (PHUs) that was recently developed by Soares Neto et al.5 for the study of the relationship between the infrastructure of PHUs and their location in Brazil. That par-ticular study examined the relationship between the infrastructure of PHUs and the Municipal Human Development Index (MHDI). The afo-rementioned study found that “most health units in the north of Brazil (59.5%) and almost half in the northeast (47.2%) were in the lower range (Levels 1, 2 and 3), unlike those in the southeast, south and midwest in which the majority were located in the upper levels (Levels 4, 5 and 6)”. The present study found that a large majority of PHUs (75.8%) with the lowest scores for infras-tructure (i.e. Level 1) were located in the north and northeast of Brazil. A similar situation was found for Levels 2 and 3. On the other hand, it
Model
1 (Constant) MHDI_Education MHDI _Longevity MHDI _Income No. of inhabitants of city North and northeast
Table 2. Estimates of multiple linear regression between the infrastructure score for PHUs and contextual variables.
β
.177 -.031 .206 .177 -.115
t
22.552 19.456 -3.323 17.752 36.522 -16.945
Source: prepared from PMAQ data (2012) and Brazilian Human Development Atlas.
Sig.
.000 .000 .001 .000 .000 .000
β
30.932 17.512 -6.891 22.606 1.365E-6 -2.311
Standard error
1.372 .900 2.074 1.273 .000 .136 Non-standardized coefficients
Standardized coefficients
Infrastructure score MHDI_Education MHDI _Longevity MHDI _Income
Table 3. Average infrastructure and score and MHDI score depending on whether or not there were Mais Médicos Program doctors (MMPD) in the PHUs.
Source: prepared from PMAQ data (2012) and Brazilian Human Development Atlas. PHUs without MMPD
Brazil
52.4 0.58 0.81 0.66
NO/NE
45.24 0.52 0.77 0.6
SE/SU/CO
52.31 0.64 0.84 0.72
PHUs with MMPD
Brazil
49.17 0.59 0.81 0.67
NO/NE
48.39 0.52 0.77 0.59
SE/SU/CO
So
ar
es N
was noted that most of the PHUs with a high le-vel of infrastructure (Lele-vels 5 and 6) were located in the southeast (44.5% and 60.9%, respectively). This data reflects the well-known inequality that exists between regions of Brazil, where, in gene-ral, the north and northeast are more deprived than other regions.
A study by Santos et al.9 found that the Mais
Médicos Program was effective in reducing health
inequities and that the program has been impor-tant in highlighting the importance of the right to health and the mandatory nature of municipal adherence to the refurbishment of PHUs, whi-ch involves investing in the (re)construction of PHUs. The aforementioned authors also found that in Brazil in 2015 there were 23,050 PHUs scheduled to be refurbished of in the process of being refurbished and that for the period 2013-2014 the estimated total value of works was R$ 3.3 billion for 4,811 municipalities.
Regarding the MHDI, in the present stu-dy there was a moderate relationship between MHDI and the infrastructure levels of PHUs. Thus, in general, there was a rising pattern in which the growth in the value of the Human Development Index was related to growth in the infrastructure level of PHUs, especially in terms of education and income.
Among the PHUs assessed at Level 1, 23% were in the north and 52.8% were in the northe-ast. On the other hand, of the total PHUs asses-sed at Level 6, 60.9% were in the southeast and 25.2% were in the south. This data is very strong evidence of well-established regional inequality in Brazil. A very similar picture, with regard to the educational situation in Brazil, was found in a study of the infrastructure conditions in Brazi-lian schools5. This evidence that Brazilian social reality has led to an undesirable association be-tween these two variables (region of Brazil and level of infrastructure) points to the need for further studies to study public policies in order to provide better structures for PHUs for munici-palities with low MHDI, mainly in the north and northeast of Brazil.
The present study also indicates other im-portant aspects to be observed such as the rela-tionship between the levels of infrastructure and indices of MHDI (Education), MHDI (Longevi-ty), MHDI (Income), and Brazilian
municipa-lities. While the average for MHDI (Longevity) was basically the same for all the levels of infras-tructure, a clear positive trend was noted between the relationship between MHDI (Education) and MHDI (Income) with the levels of infrastructure.
With regard to possible differences between the HDI of municipalities that received Mais
Mé-dicos Program doctors and those that did not, it
was noted that there was no substantive differen-ce between the average MHDI of municipalities that received Mais Médicos Program doctors and those that did not, when the region to which the PHU belonged was controlled. However, in rela-tion to the infrastructure score, both in the north/ northeast and also the southeast/south/Midwest regions, the average infrastructure score for PHUs with Mais Médicos Program doctors was higher than that of PHUs without such doctors. This shows an effort to provide minimum (or more appropriate) conditions in relation to the work of
the Mais Médicos Program doctors, even though
the Mais Médicos Program envisaged that such
doctors would be allocated as a priority to mu-nicipalities that generally had greater needs and a higher proportion of vulnerable clients.
aúd
e C
ole
tiv
a,
21(9):2709-2718,
2016
It is important to highlight the fact that growth in income and educational indicators is related to growth in the indicator of infrastruc-ture in PHUs. This study was unable to establish any causal relationship between the variables. Further studies should be conducted in order to verify the need for integrated educational and health policies.
Collaborations
So
ar
es N
References
Brasil. Lei nº 12.871, de 22 de outubro de 2013 2. Ins-titui o Programa Mais Médicos, altera as Leis nº 8.745, de 9 de dezembro de 1993, e nº 6.932, de 7 de julho de 1981, e dá outras providências. Diário Oficial da União 2013; 23 out.
Borges P. Portal iG. [acessado 2013 jul 7]. Disponível em: http://ultimosegundo.ig.com.br/brasil/2013-07-07 /falta-de-infraestrutura-adequada-e-entrave-para-in-teriorizacao-de-medicos.html
Nora CRD, Junges JR. Política de humanização na aten-ção básica: revisão sistemática. Rev Saude Publica 2013; 47(6):1186-1200.
Jannuzzi PM. Monitoramento e Avaliação de Programas Sociais. Campinas: Alínea Editora; 2016.
Soares Neto JJ, Alves CB, Cherchiglia ML, Campos FCC, Girardi SN, Belisário AS, Machado MH. Uma Escala para Monitorar a Evolução da Infraestrutura das Unidades Básicas de Saúde no Programa Mais Médicos. No prelo 2016.
Programa das Nações Unidas para o Desenvolvimento (PNUD), Instituto de Pesquisa Econômica Aplicada (Ipea), Fundação João Pinheiro (FJP). Atlas de Desen-volvimento Humano. Formosa: PNUD, Ipea, FJP; 2013. Brasil. Ministério da Saúde (MS). Secretaria de Atenção à Saúde. Departamento de Atenção Básica. Manual de estrutura física das unidades básicas de saúde: saúde da família. 2ª ed. Brasília: MS; 2008. (Série A. Normas e Manuais Técnicos).
Brasil. Ministério da Saúde (MS). Resolução-RDC nº 50 de 21 de fevereiro de 2002. Dispõe sobre o Regu-lamento Técnico para planejamento, programação, elaboração e avaliação de projetos físicos de estabeleci-mentos assistenciais de saúde. Diário Oficial da União 2002; 22 fev.
Santos LMP, Costa AM, Girardi SN. Programa Mais Médicos: uma ação efetiva para reduzir iniquidades em saúde. Cien Saude Colet 2015; 20(11):3547-3552. Campos FE, Machado MH, Girardi SN. A fixação de profissionais de saúde em regiões de necessidades. Di-vulg. saúde debate 2009; (44):13-24.
Tomasi E, Fachini LA, Thumé E, Piccini Rx, Osorio A, Silveira DS, Siqueira FV, Teixeira VA, Dilélio AS, Maia MFS. Características da utilização de serviços de aten-ção básica à saúde nas regiões Sul e Nordeste do Brasil: diferenças por modelo de atenção. Cien Saude Colet 2011; 16(11):4395-4404.
Article submitted on 02/03/2016 Approved on 17/6/2016
Final version submitted 19/6/2016 1.
2.
3.
4. 5.
6.
7.
8.
9.
10.