Biogeosciences, 6, 333–348, 2009 www.biogeosciences.net/6/333/2009/
© Author(s) 2009. This work is distributed under the Creative Commons Attribution 3.0 License.
Biogeosciences
Particle fluxes in the deep Eastern Mediterranean basins: the role of
ocean vertical velocities
L. Patara1, N. Pinardi2, C. Corselli3, E. Malinverno3, M. Tonani4, R. Santoleri5, and S. Masina1,4
1Centro Euro-Mediterraneo per i Cambiamenti Climatici (CMCC), Viale Aldo Moro 44, 40127 Bologna, Italy 2Laboratorio SINCEM, Universit`a di Bologna, Via S. Alberto 163, 48100 Ravenna, Italy
3Dipartimento di Scienze Geologiche e Geotecnologie, Universit`a Milano-Bicocca, Piazza della Scienza 4, 20126 Milan, Italy 4Istituto Nazionale di Geofisica e Vulcanologia (INGV), Viale Aldo Moro 44, 40127 Bologna, Italy
5Istituto di Scienze dell’Atmosfera e del Clima – C.N.R., Via del Fosso del Cavaliere 100, 00133 Rome, Italy
Received: 25 April 2008 – Published in Biogeosciences Discuss.: 12 August 2008 Revised: 26 January 2009 – Accepted: 10 February 2009 – Published: 6 March 2009
Abstract. This paper analyzes the relationship between deep sedimentary fluxes and ocean current vertical veloc-ities in an offshore area of the Ionian Sea, the deepest basin of the Eastern Mediterranean Sea. Sediment trap data are collected at 500 m and 2800 m depth in two successive moorings covering the period September 1999–May 2001. A tight coupling is observed between the upper and deep traps and the estimated particle sinking rates are more than 200 m day−1. The current vertical velocity field is computed from a 1/16◦×1/16◦Ocean General Circulation Model sim-ulation and from the wind stress curl. Current vertical locities are larger and more variable than Ekman vertical ve-locities, yet the general patterns are alike. Current vertical velocities are generally smaller than 1 m day−1: we therefore
exclude a direct effect of downward velocities in determin-ing high sedimentation rates. However we find that upward velocities in the subsurface layers of the water column are positively correlated with deep particle fluxes. We thus hy-pothesize that upwelling would produce an increase in up-per ocean nutrient levels – thus stimulating primary produc-tion and grazing – a few weeks before an enhanced vertical flux is found in the sediment traps. High particle sedimen-tation rates may be attained by means of rapidly sinking fe-cal pellets produced by gelatinous macro-zooplankton. Other sedimentation mechanisms, such as dust deposition, are also considered in explaining large pulses of deep particle fluxes. The fast sinking rates estimated in this study might be an
evi-Correspondence to:L. Patara ([email protected])
dence of the efficiency of the biological pump in sequestering organic carbon from the surface layers of the deep Eastern Mediterranean basins.
1 Introduction
while Ediger and Yilmaz (1996) measure in the Levantine Basin a 600 m deep nutricline in correspondence of anticy-clonic structures. In the Ionian Sea, oligotrophic features increase according to a north-south and west-east gradient (Bricaud et al., 2002; Casotti et al., 2003), in response to different water mass characteristics and possibly circulation patterns. In this oligotrophic region coccolithophores are an important constituent of the phytoplankton assemblage larger than 3µm (Boldrin et al., 2002; Malinverno et al., 2003) and their calcitic remains give a major contribution to the calcium carbonate export to the deep layers (Ziveri et al., 2000).
Organic matter export in the ocean interior – occurring mainly through zooplankton fecal pellets and marine snow particles (Knappertsbusch and Brummer, 1995; Stemmann et al., 2002; Turner, 2002) – is one of the processes maintain-ing the CO2 partial pressure gradient between surface and
deep layers (Sarmiento and Gruber, 2006) and it is there-fore involved in the ocean’s capacity to absorb atmospheric CO2. Hence it is important to quantify particle
sedimenta-tion in the water column and to assess the mechanisms af-fecting its variability. Particle fluxes may be estimated by means of sediment traps which collect the material sinking through the water column in temporally rotating containers (Honjo, 1996; Buesseler et al., 2007), thus giving a measure of the mass of particles (mg) sinking across the sediment trap surface (m2) during a specific time interval (days). Results from sediment traps moored at various depths and geograph-ical settings (Honjo et al., 2008) yield significant variability in particle flux magnitudes and sinking velocities as a conse-quence of physical and biological processes (Berelson, 2002; Francois et al., 2002; De La Rocha and Passow, 2007; Lutz et al., 2007; Trull et al., 2008).
In oligotrophic open ocean regions particle fluxes are generally very low, and yet they have been observed to strongly react to localized and episodic phenomena such as the passage of mesoscale eddies (Sweeney et al., 2003), el-evated zooplankton biomass (Conte et al., 2003; Goldthwait and Steinberg, 2008), and the occurrence of lithogenic dust events (Zu˜niga et al., 2008); in addition deep particle fluxes are found to be in some cases decoupled with respect to sur-face ocean primary production (Buesseler, 1998; Conte et al., 2001; Lutz et al., 2002). However the relevant physical and biological mechanisms controlling particle sedimentation in oligotrophic regions are still to be fully understood.
In this study we investigate the effect of current vertical ve-locities on particle fluxes measured in the deep Ionian basin. Ocean vertical velocities might influence particle fluxes in two opposite ways: on one hand they could directly increase sedimentation rates through downwelling velocities; on the other hand they could produce, via upwelling velocities, an indirect effect through an enhancement of nutrient levels and primary productivity in the upper ocean.
Particles are sampled during the period 1999–2001 at the Urania and Bannock stations – located in the open southeast-ern Ionian Sea – by means of sediment traps moored at 500 m
and 2800 m depth. We analyze total particle flux, i.e. the flux of all sinking particles, and total coccolith flux, i.e. the flux of the calcitic plates constituting the coccolithophore exter-nal shell.
Ekman vertical velocities calculated from the wind stress curl were used in previous studies as a proxy of the cur-rent vertical velocities and a relation with biological patterns was found (Agostini and Bakun, 2002). However biogeo-chemical processes and vertical particle fluxes are affected by mesoscale features (McGillicuddy et al., 1999; Sweeney et al., 2003), which are pervasive in the eastern Mediterranean Sea (Robinson et al., 1987) but might not be correctly repre-sented by the large scale Ekman vertical velocities.
Current vertical velocities are difficult to directly measure because of their extremely low values, which are commonly less than 1 m day−1. We therefore analyze vertical veloci-ties simulated with a 1/16◦×1/16◦Ocean General Circula-tion Model (OGCM) for the years 1999–2001. The OGCM vertical velocities are compared with the wind induced Ek-man vertical velocities in order to verify the consistency be-tween the two fields. The OGCM vertical velocities are then correlated with particle fluxes from sediment traps.
The paper is organized as follows: Sect. 2 gives some de-tails regarding the particle flux observations and the compu-tation of Ekman and current vertical velocity fields. Section 3 investigates the main results of this work, concentrating on the effect of ocean vertical velocities on particle fluxes mea-sured at the studied sites. In Sect. 4 we discuss the major findings and in Sect. 5 we give a few concluding remarks.
2 Methods
2.1 Particle flux data from sediment traps
Particle flux data analyzed in this work were collected by means of conical Technicap PPS5/2 sediment traps deployed at 500 m and 2800 m depth in two offshore sites located in the southeastern Ionian Sea, the Urania and Bannock stations (Fig. 1). Sediment traps are equipped with 24 polypropylene bottles, have a 1 m2 collection area, measure 2.3 m height and have an aspect ratio equal to 6.25. The sediment trap time series cover the period 15 September 1999–9 May 2001 in two successive moorings, the first one from 15 September 1999 to 13 May 2000 (hereafter referred to as Mooring 1), the second one from 30 May 2000 to 9 May 2001 (hereafter referred to as Mooring 2). The sampling frequency varies between 10 days for Mooring 1 and 15 days for Mooring 2.
L. Patara et al.: Particle fluxes and ocean vertical velocities 335
Fig. 1. Ionian Sea bathymetry and sediment trap mooring sites. U=Urania station (latitude 35◦2′N, longitude 21◦2′E), B=Bannock station (latitude 34◦2′N, longitude 20◦E).
particle flux in units of mg m−2day−1 was then calculated by knowing the sample fraction weight, the sediment trap aperture area, and the sampling frequency. Another fraction, intended for coccolith analysis, was processed following the method of Bairbakhish et al. (1999) in order to remove or-ganic matter and disaggregate particles. Samples were then filtered onto a millipore cellulose acetate filter (0.45µm pore size, 47 mm diameter), oven dried at 40◦C and stored in plas-tic petri dishes. A portion of each filter was mounted on a glass slide and analyzed along radial transects from the centre to the edge using a polarized light Olympus micro-scope (LM) at 1250 magnification. Coccolith count of major species was performed on areas of 0.2 to 5 mm2, depending on coccolith concentration on the filter, whereas minor and rare species were counted on areas of 1 to 10 mm2. Coccol-ith flux was calculated according to the following equation: F = N Af S
af Ast T
, (1)
where F=coccolith flux (nC m−2day−1), N=number of counted specimens (nC),Af=filter area (mm2),S=split
fac-tor, af =investigated filter area (mm2), Ast=sediment trap
aperture area (m2) andT=sample collecting interval (days). Because of the utilized sampling procedure, coccolith data represent the contribution from both loose coccoliths and coccospheres disaggregated during sample preparation. Flux
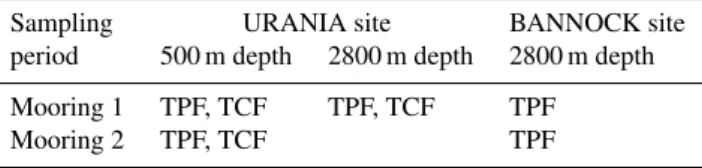
Table 1. Available sediment trap data from the Urania and Ban-nock sites, where TPF=Total Particle Flux (mg m−2day−1) and TCF=Total Coccolith Flux (nC m−2day−1). Mooring 1=from 15 September 1999 to 13 May 2000 and Mooring 2= from 30 May 2000 to 9 May 2001.
Sampling URANIA site BANNOCK site period 500 m depth 2800 m depth 2800 m depth
Mooring 1 TPF, TCF TPF, TCF TPF Mooring 2 TPF, TCF TPF
data at the Urania station are available at both 500 m and 2800 m depth for Mooring 1, and at 500 m depth for Mooring 2. At the Bannock station only total particle flux at 2800 m depth is available (see Table 1).
A few technical problems were encountered during the sampling procedures. At the Urania site, a few samples from the Mooring 1 time series collected at 2800 m depth dis-solved in the laboratory after being weighted and before the coccolith count: the total particle flux time series is there-fore complete, whereas a few samples are missing from the coccolith flux time series. During the sediment trap recovery of Mooring 1, the last collecting bottle remained open dur-ing the ascent through the water column: the last samples of the two time series – at 500 m depth and at 2800 m depth – may therefore give an overestimated value of the true particle flux. At the Bannock site, the sediment trap rotation mecha-nism stopped after the 16th temporal interval of Mooring 1, i.e. after 24 February 2000. Particles sinking during the re-maining part of the time series (25 February 2000–13 May 2000) were then collected in one single vial during a period of 79 days.
2.2 Vertical velocities calculation
The model used in this study is derived from the OPA code (Madec et al., 1998), it has a horizontal resolution of 1/16◦×1/16◦ (corresponding to a grid spacing of approxi-mately 6 km) and a vertical z-level step-wise discretization with 72 unevenly spaced levels. Vertical resolution is en-hanced in the upper layers and gradually decreases with depth (Tonani et al., 2008).
The current vertical velocity field is computed as a diag-nostic variable according to the continuity equation for an incompressible fluid:
w(z)=w(−H )− z Z
−H
∂u
∂x+ ∂v ∂y
dz′ (2)
The kinematic bottom boundary condition for vertical veloc-ity can be expressed as:
w(−H )= −Uh·∇hH, (3)
whereUh=(u, v)and∇h= ∂∂x, ∂∂y. Because of the bottom topography discretization used, ∇hH is equal to
zero, thus vertical velocity at the ocean bottom will also be zero. A discussion over the vertical velocity represen-tation at the ocean bottom in z-level models may be found in Pacanowski and Gnanadesikan (1998).
We compare current vertical velocity computed with Eq. (2) with Ekman vertical velocity, calculated as a func-tion of the curl of the wind stressτ= τx, τyaccording to:
wE (x, y, δE)=
1 ρof
k·∇h×τ+ β τx
f
, (4)
wherewEis the Ekman vertical velocity,τis computed from
ECMWF winds using a bulk formula as reported in Tonani et al. (2008), ρ0 is the average seawater density taken as
1029 kg m−3, and f is the Coriolis parameter. The β
pa-rameter, i.e. the meridional gradient off, is computed as β = 2cosθ
r, wherer andare the Earth radius and angular velocity, andθis the latitude.
Ekman vertical velocities are defined at the Ekman layer depthδE, which is the e-folding depth of the wind-induced
currents. For the Mediterranean SeaδEis generally between
20 m and 40 m. Such an estimate is calculated using the scaling formulaδE=π
q
2Av|f|(Pond and Pickard, 1983),
whereAvis the vertical eddy coefficient for momentum,
cal-culated in the model as a function of the Richardson number (Tonani et al., 2008) and normally variable between 10−2and 10−3m2s−1.
We use daily wind stress fields for the years 1999–2001 to compute Ekman vertical velocities and daily current ve-locity fields of the model output to compute current vertical velocities. The comparison between the two fields is done on a monthly basis at 30 m depth. The comparison between the vertical velocity fields and the particle flux time series is done by averaging the former fields on the same time inter-vals of the sediment traps, i.e. 10 days for Mooring 1 and 15 days for Mooring 2.
Current vertical velocity values are vertically averaged be-tween 100 m and 600 m depth, which allows for the surface high frequency signals to be neglected and is deep enough for the nutricline depth to be included at all seasons (Ediger and Yilmaz, 1996; Klein et al., 1999). The vertical velocity field is then horizontally averaged on six areas of increasing dimensions around the station coordinates, with the aim of assessing how the spatial heterogeneity of vertical velocities affects correlations with particle flux data.
Spearman rank correlation coefficients between current vertical velocities and particle fluxes are calculated. We use this non-parametric method because particle flux time series
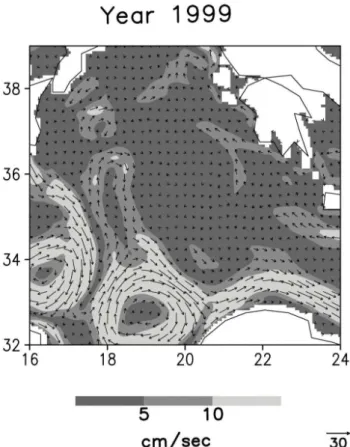
Fig. 2. Simulated current horizontal velocities (cm s−1) in the Io-nian Sea at 30 m depth averaged over the year 1999. The arrow on the bottom-right of the panel indicates the 30 cm s−1velocity.
do not fit a normal distribution. However we would like to mention that the use of Pearson correlation coefficients yields very similar results. Correlations are calculated both without a time lag (“0 lag” case) and with particle fluxes shifted of one (“1 lag” case) and two (“2 lags” case) sediment trap rota-tion intervals with respect to current vertical velocities. The “1 lag” case corresponds to a shift of 10 days for Mooring 1 and of 15 days for Mooring 2, whereas the “2 lags” case corresponds to a shift of 20 days for Mooring 1 and of 30 days for Mooring 2. The computation of lagged correlations is aimed at assessing the delayed effects of ocean vertical ve-locities on particle fluxes.
3 Results
3.1 Surface circulation in the Ionian Sea
L. Patara et al.: Particle fluxes and ocean vertical velocities 337
Fig. 3. Ekman vertical velocities (m day−1) in the Ionian Sea in (a)November 1999,(b) June 2000,(c)November 2000, and(d) February 2001. In letters we indicate the positions of the Urania (U) and Bannock (B) stations.
a weak and prevailingly cyclonic circulation to the north. A large meander of the Modified Atlantic Water current, called the Atlantic Ionian Stream (Robinson et al., 1999), is present in the Ionian Sea around 34◦N with an anticyclonic curvature and a detached anticyclonic eddy to the north (up to 37◦N).
The Ionian Sea was affected in the late 80s by an in-tensification and northward extension of the anticyclonic circulation (Malanotte-Rizzoli et al., 1999; Demirov and Pinardi, 2002). This circulation change, which is an aspect of the widespread phenomenon known as the Eastern Mediter-ranean Transient, appears to have recovered since the late 90s (Manca et al., 2003). The weak but cyclonic circulation north of 35◦N and the large but limited in extent anticyclonic meander and northward eddy are signatures of such change, which our model succeeds to capture.
3.2 Vertical velocities in the Ionian Sea
The Ekman Vertical Velocity field (hereafter referred to as EVV) calculated according to Eq. (4), is depicted in Fig. 3 for the months of November 1999, June and November 2000, and February 2001, which are months overlapping with sediment trap data. EVVs have values between−0.1 and 0.1 m day−1on large portions of the Ionian basin and ex-hibit a typical large scale structure consistent with the large
Fig. 4. Simulated current vertical velocities (m day−1) in the Io-nian Sea at 30 m depth in(a)November 1999,(b)June 2000,(c) November 2000, and(d)February 2001. In letters we indicate the positions of the Urania (U) and Bannock (B) stations.
scale wind field. Positive values, i.e. upward EVVs, are prevalently found in the northern part of the Ionian basin, while the southeastern regions are typically characterized by negative values, i.e. downward EVVs. Seasonal and interan-nual variability is moreover evident: in February 2001 the Io-nian Basin exhibits the largest areas with upward EVV, while June and November 2000 are characterized by prevailingly downward EVVs. The upward EVVs are then stronger in the northern part of the basin and in the winter season.
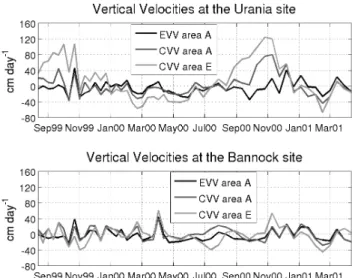
Fig. 5.Ocean vertical velocities (cm day−1) at the Urania (top) and Bannock (bottom) sites, where EVV=Ekman Vertical Velocity com-puted from the wind stress curl, and CVV=simulated Current Ver-tical Velocity, verVer-tically averaged between 100 m and 600 m depth. EVVs are horizontally averaged over an area of 145 km side (area A); CVVs are horizontally averaged over areas of 85 km side (area E) and 145 km side (area A). The tick marks on the x-axis indicate the 15th day of each month.
In Fig. 5 we show time series at the Urania and Ban-nock sites of EVV, horizontally averaged over an area of 145 km side (area A), and of CVV, vertically averaged be-tween 100 m and 600 m depth and horizontally averaged over areas of 145 km side (area A) and of 85 km side (area E). EVV and CVV exhibit in many cases synchronous peaks, thus suggesting a relevant role of the wind stress curl field in modulating the seasonal variability of ocean vertical ve-locity. CVV, in particular when averaged over the smaller area E, is however much larger in amplitude with respect to EVV, thus indicating that ocean dynamics enhances the atmospheric forcing and translates it into smaller scale mo-tions. Due to the spatial and temporal variability of CVV, the Urania and Bannock stations despite their vicinity are char-acterized by different circulation regimes. This variability does not appear to be correctly captured by the large scale EVV field, which we therefore do not believe suitable for the computation of correlations with sediment trap data. 3.3 Particle fluxes at the Urania and Bannock stations Total Particle Flux (hereafter referred to as TPF) measured at the Urania site is depicted in logarithmic scale in Fig. 6 with a light-gray line; Current Vertical Velocity (CVV), averaged between 100 m and 600 m depth and on an area of 85 km side (area E), is superimposed on the same plot with a dark-gray line.
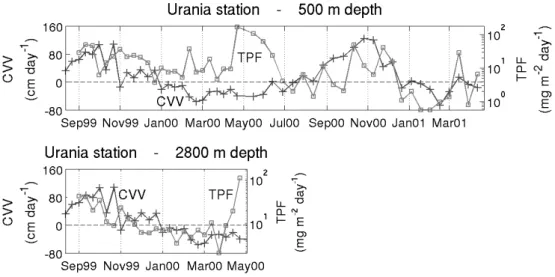
At 500 m depth TPF is highest between mid-May 2000 and the beginning of June 2000, when it exceeds
100 mg m−2day−1. Secondary flux maxima exceeding
25 mg m−2day−1 occur in September–November 1999, at
the beginning of March 2000, in November–December 2000 and in April 2001. TPFs lower than 2 mg m−2day−1 oc-cur throughout the period January–March 2001. At 2800 m depth TPF is highest in mid-May 2000 with a value exceed-ing 100 mg m−2day−1 (we recall however that this value is probably overestimated), whereas secondary flux max-ima in excess of 25 mg m−2day−1 occur in the period of September–October 1999. TPF at the Urania site is on aver-age 17 mg m−2day−1at 500 m depth (with a standard devi-ation of 20 mg m−2day−1) and 13 mg m−2day−1at 2800 m depth (with a standard deviation of 12 mg m−2day−1). The large value of the standard deviation indicates that the mean is not a robust estimate of the probability distribution due to the eventful and short time series.
Total Coccolith Flux (hereafter referred to as TCF) mea-sured at the Urania site is depicted in logarithmic scale in Fig. 7 with a light-gray line; Current Vertical Velocity (CVV), averaged between 100 m and 600 m depth and on an area of 85 km side (area E), is superimposed on the same plot with a dark-gray line.
TCF at 500 m depth shows a sporadic peak around 3×10⁹nC m−2day−1 between mid-May and the beginning of June 2000 and secondary flux maxima in excess of 5×10⁸nC m−2 day−1 at the end of September 1999 and in March 2000. At 2800 m depth TCF exhibits the largest values (in excess of 5×10⁸nC m−2day−1) in the period September–November 1999 and in mid-May 2000 (even though this value is probably overestimated). Microscope visual inspection has revealed no evidence of coccolith dis-solution (Malinverno et al., in preparation): this observation is consistent with the similar TCF magnitude between upper and deep traps. TCF measured at 500 m depth during Moor-ing 2 is significantly lower with respect to MoorMoor-ing 1, and we suspect that calcite dissolution may have partly occurred in the samples. Thus this part of the time series might not be fully reliable.
We may thus conclude that at the Urania site, fluxes are extremely high in May–June 2000, i.e., at the beginning of summer, and are generally larger in the autumn and spring seasons.
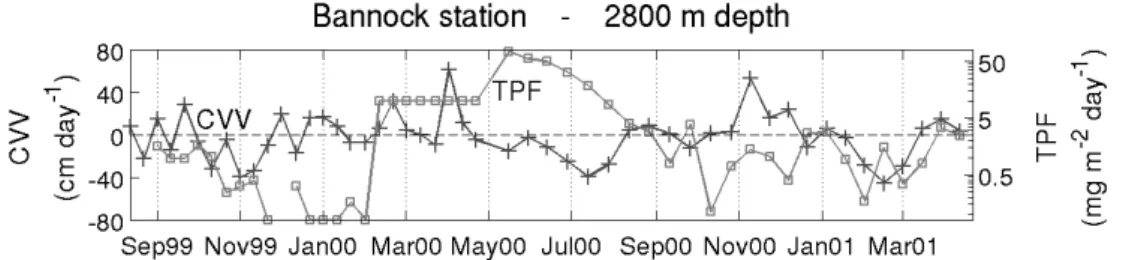
TPF measured at 2800 m depth at the Bannock site is de-picted in Fig. 8 with a light-gray line; Current Vertical Veloc-ity (CVV), averaged between 100 m and 600 m depth and on an area of 85 km side (area E), is superimposed on the same plot with a dark-gray line.
L. Patara et al.: Particle fluxes and ocean vertical velocities 339
Fig. 6.Total Particle Flux (TPF) and Current Vertical Velocity (CVV) at the Urania site for Mooring 1 (15 September 1999–13 May 2000) and for Mooring 2 (30 May 2000–9 May 2001). Light-gray line: TPF (mg m−2day−1), plotted in logarithmic scale, at 500 m depth (top) and at 2800 m depth (bottom). Dark-gray line: CVV (cm day−1) averaged between 100 m and 600 m depth and on a horizontal area of 85 km side (area E). The tick marks on the x-axis indicate the 15th day of each month.
Fig. 7. Total Coccolith Flux (TCF) and Current Vertical Velocity (CVV) at the Urania site for Mooring 1 (15 September 1999 to 13 May 2000) and for Mooring 2 (30 May 2000 to 9 May 2001). Light-gray line: TCF (nC m−2day−1), plotted in logarithmic scale, at 500 depth (top) and at 2800 m depth (bottom). Dark-gray line: CVV (cm day−1) averaged between 100 m and 600 m depth and on a horizontal area of 85 km side (area E). The tick marks on the x-axis indicate the 15th day of each month.
magnitude over the whole period. TPF at the Bannock site is on average 8 mg m−2day−1, with a standard deviation of
17 mg m−2day−1(in this computation we removed the con-stant value of 10 mg m−2day−1of the period 25 February–13 May 2000).
Particle fluxes measured at the Urania site are compara-ble with those collected in other off-shore sites of the Ionian Sea, whereas at the Bannock site they are lower. Ziveri et al. (2000) observe in fact at the Bannock site an average to-tal particle flux at 3000 m depth of about 16 mg m−2day−1, while Boldrin et al. (2002) observe in the northern Ionian
Sea an average total particle flux at 2250 m depth of about 17 mg m−2day−1.
Fig. 8.Total Particle Flux (TPF) and Current Vertical Velocity (CVV) at the Bannock site for Mooring 1 (15 September 1999–13 May 2000) and Mooring 2 (30 May 2000–9 May 2001). Light-gray line: TPF (mg m−2day−1) at 2800 m depth plotted in logarithmic scale. Dark-gray line: CVV (cm day−1) averaged between 100 m and 600 m depth and on a horizontal area of 85 km side (area E). The tick marks on the x-axis indicate the 15th day of each month.
two traps (i.e., 2300 m) by the sediment trap temporal reso-lution (i.e., 10 days), which yields sinking velocities higher than 200 m day−1.
Spearman correlation coefficients between TPF measured at 500 m and at 2800 m depth are significant at 95% confi-dence level also with 10 days lag between the two time series. We may therefore hypothesize that a range of particle sinking velocities might be occurring in the ocean interior, with val-ues that may vary between approximately 100 m day−1 and more than 200 m day−1. Fluxes of single coccolithophore species at the two investigated depths (Malinverno et al., in preparation) display a pattern that is consistent with this in-ference. In fact in the 500 m trap there is a rather distinct sea-sonal signal in assemblage composition, with specific abun-dance peaks occurring over short time intervals, whereas in the 2800 m trap the signal is more smoothed and occurs over longer time periods.
Particle sinking speeds between 100 m day−1 and more than 200 m day−1are in general agreement with other stud-ies conducted in open areas of the Mediterranean Sea. In the northwestern Mediterranean Sea, Lee et al. (2004) mea-sure at 200 m depth a dominant particle sinking regime of 200 m day−1. In the northeastern Ionian Sea, Boldrin et al. (2002), estimate particle sinking speeds higher than 140 m day−1 by computing the time lag between sediment
trap flux peaks measured at different depths. On the contrary Ziveri et al. (2000) estimate, in the southeastern Ionian Sea, settling rates of 17–25 m day−1 for coccoliths and of more than 100 m day−1 for coccospheres by calculating the time lag between the 1979–1985 satellite chlorophyll maximum, and the 1991-1994 sediment trap flux peaks at 3000 m depth. 3.4 Correlation between current vertical velocities and
par-ticle fluxes
CVVs at the Urania site (Figs. 6 and 7) exhibit positive values exceeding 80 cm day−1in September–November 1999 and in November–December 2000, whereas negative values lower than−30 cm day−1occur in March 2000, in May–June 2000 and in February 2001. Thus we observe an increase in
up-ward motion in autumn and an increase in downup-ward motion in late winter and summer. CVVs at the Bannock site (Fig. 8) remain close to zero (<±30 cm day−1) during most of the time series, except for two sporadic peaks in April 2000 and November 2000 (>50 cm day−1) and negative values below
−30 cm day−1in November 1999, August 2000 and March 2001.
Periods of upward vertical velocities are normally asso-ciated with higher particle fluxes. This behavior is ob-served at the Urania site in September–November 1999 and in November–December 2000. Periods of downward verti-cal velocities appear instead to coincide with periods of low particle fluxes, as seen at the Urania site in late winter 2000 (only at 2800 m depth) and 2001, and at the Bannock site in November 1999 and late winter 2001. When ocean vertical velocities remain close to zero, as seen in most of the Ban-nock time series, there appears to be no evident correlation with particle fluxes.
An exception to this pattern occurs in May–June 2000, when the high particle flux occurring at both the Urania and Bannock sites is not associated with a large increase of up-ward CVVs. We decided to remove the May–June 2000 flux event from the remaining computations: we believe in fact that mechanisms other than ocean vertical velocities are de-termining the observed strong particle fluxes, as it will be discussed further on.
In Fig. 9 we show, for the Urania site, Spearman corre-lation coefficients between CVV and particle fluxes, for the three cases “0 lag”, “1 lag” and “2 lags”. Correlation coeffi-cients are plotted as a function of the horizontal integration area of CVV, where area A is the largest (145 km side) and area F is the smallest (70 km side). The correlation value marking the 90% confidence level is depicted with a dashed line.
L. Patara et al.: Particle fluxes and ocean vertical velocities 341
Fig. 9. Spearman correlation coefficients between Current Verti-cal Velocity (CVV), vertiVerti-cally averaged between 100 m and 600 m depth, and(a)Total Particle Flux (TPF) at 500 m depth for Mooring 1 (15 September 1999–13 May 2000),(b)TPF at 500 m depth for Mooring 2 (30 May 2000–9 May 2001),(c)TPF at 2800 m depth for Mooring 1, (d) Total Coccolith Flux (TCF) at 500 m depth for Mooring 1,(e) TCF at 500 m depth for Mooring 2, (f)TCF at 2800 m depth for Mooring 1. CVVs are horizontally averaged over 6 areas of increasingly higher dimension, where area A is the largest (145 km side) and area F is the smallest (70 km side). Cor-relation coefficients are calculated between coincidental time series (“0 lag”) and between time series shifted of one (“1 lag”) and two (“2 lags”) sediment trap rotation intervals. The correlation value marking the 90% confidence level is depicted with a dashed line.
with CVV, whereas at 2800 m depth it exhibits significant correlations at 90% confidence level for the “0 lag” and “1 lag” cases. During Mooring 2, TPF at 500 m depth is sig-nificantly correlated with CVV at 90% confidence level for all time lags (“0 lag”, “1 lag”, “2 lags”), whereas for TCF at 500 m depth significant correlations occur only in the “0 lag” and “1 lag” cases.
Thus in general we observe that correlation coefficients are higher for TPF with respect to TCF, and at 2800 m depth with respect to 500 m depth; moreover correlations appear to be in many cases higher when the horizontal average of CVV is performed on the smallest area F around the Urania station coordinates. Even though characterized by some het-erogeneity, correlation coefficients appear to be overall ro-bust with respect to the horizontal integration area of ocean vertical velocities.
At the Bannock station correlation coefficients for Moor-ing 1 cannot be computed because of the discontinuity of the time series and for Mooring 2 they are not statistically sig-nificant.
4 Discussion
4.1 Correlation between particle fluxes and upward vertical velocities
The positive correlation between upward vertical velocities and particle fluxes might seem at first sight surprising, as we might expect downward vertical velocities to enhance parti-cle fluxes by increasing vertical settling rates. However par-ticle sinking rates estimated from sediment traps are two or-ders of magnitude higher with respect to ocean vertical ve-locities calculated from the model output, which are around 1 m day−1. We thus exclude, in the region analyzed in this study, a direct effect of ocean vertical velocities on particle sinking rates and thus particle fluxes.
In correspondence of submesoscale features, arising as a result of non-linear interaction of mesoscale eddies in re-gions of strong shears, large vertical velocities higher than 10 m day−1may occur (L´evy et al., 2001; Mahadevan, 2006). The OGCM used in the present study, characterized by ap-proximately 6 km horizontal resolution, is too coarse to re-solve submesoscale features and associated high vertical ve-locities. However enhanced density gradients and velocity shears leading to the formation of submesoscale structures are not a predominant feature of our study area and we do not expect this to be a substantial mechanism in this region.
sinking fecal pellets or other large particles and would be collected by sediment traps.
According to our results, the described mechanism of en-hanced particle fluxes triggered by upward CVVs appears to occur within a temporal range of a few weeks. The fact that correlations between CVV and TPF at 500 m depth are high-est with “1 lag” for Mooring 1 and with “0 lag” for Mooring 2 is not necessarily an inconsistent result, as the temporal resolution is of 10 days for Mooring 1 and of 15 days for Mooring 2. Significant correlations between CVV and both coincidental and lagged particle flux time series might be in-dicating that various time scales are involved in the sedimen-tation of particle pulses from the ocean surface. We may speculate that this is due to the existence of a spectrum of particle sinking rates in the ocean interior. However, due to the shortness of the time series, the robustness of temporally lagged correlation results might be questioned and caution must be used in drawing conclusions.
The observation that correlations generally increase when CVV is horizontally averaged on the smallest area F around the station coordinates gives strength to our hypothesis, as it would highlight the local effect of CVVs on the observed particle fluxes. Higher correlations occurring for the 2800 m depth trap – with respect to the 500 m depth trap - might in-dicate that sediment trap measurements at 500 m depth are more affected by upper ocean dynamics (e.g. vertical migrat-ing organisms, higher abundance of zooplanktonic “swim-mers”).
Both TCF and TPF are significantly correlated with CVVs and we hypothesize that this might be due to a high percent-age of biogenic matter to the total particle flux. Zu˜niga et al. (2008) observe, in the open Algero-Balearic basin, that biogenic flux contributes to about 50% of total particle flux, with calcium carbonate being a major constituent (∼25% of total particle flux, with a maximum of 60% during winter). Our results show however that TPF, rather than TCF, is giv-ing the highest correlations with CVV and we propose two reasons for this behavior. First of all TPF contains, in ad-dition to coccoliths, other sinking matter of biogenic origin (Zu˜niga et al., 2008): TPF may therefore be, in areas of low lithogenic inputs, a better proxy of upper ocean productivity than TCF itself. Secondly, the measure of TPF may be in-trinsically more precise than the measure of TCF: the latter is only an estimate of the true coccolith flux and moreover, because of the various steps of the sampling and measuring procedures, there is a non-null risk for coccolith plates to un-dergo partial dissolution.
At the Bannock site, where CVVs are close to zero dur-ing most of the studied period, CVVs do not appear to affect particle flux variability in any evident way, and the proposed mechanism of enhanced particle fluxes triggered by upward CVVs is not valid. In the next sections we will analyze addi-tional data sets that may help to improve our understanding of the sedimentary processes at the Urania and Bannock sites during the studied period.
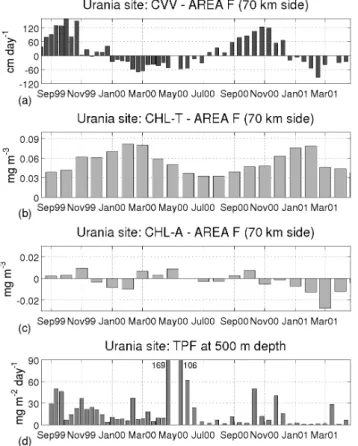
4.2 Relationship with SeaWiFS chlorophyll-a data To support our discussion on enhanced primary produc-tion triggered by upward CVVs, we analyze SeaWiFS chlorophyll-a monthly means available from the JRC Ocean Color Portal (http://oceancolour.jrc.ec.europa.eu) for the years 1999–2004. The data, which have a horizontal res-olution of approximately 2 km in our study area, are used to compute average chlorophyll concentrations at the Ura-nia and Bannock sites. We analyze total chlorophyll values (hereafter referred to as CHL-T) and chlorophyll anomalies with respect to the long-term seasonal mean (hereafter re-ferred to as CHL-A). In Figs. 10 and 11 we depict, at the Urania and Bannock sites respectively, T and CHL-A together with CVV and TPF. CVV, CHL-T and CHL-CHL-A are horizontally averaged over an area of 70 km side (area F) around the station coordinates.
At both the Urania and Bannock sites, CHL-T exhibits a well developed seasonal cycle with maximum values in the late winter months (up to 0.1 mg Chl m−3) and minimum val-ues in the summer months (below 0.04 mg Chl m−3). The Urania and Bannock chlorophyll concentration values are characterized by equivalent mean values (i.e. approximately 0.05 mg m−3) and seasonality (i.e. seasonal maximum in February–March). This chlorophyll concentration pattern is typical of a subtropical oligotrophic setting where light is never limiting and nutrients are conveyed seasonally in the eutrophic layer by means of winter mixing. CHL-A values, i.e. the interannual chlorophyll fluctuations around the sea-sonal mean, are confined between±0.03 mg Chl m−3at both the Urania and Bannock sites.
L. Patara et al.: Particle fluxes and ocean vertical velocities 343
Fig. 10. Urania site: (a) simulated Current Vertical Veloci-ties (CVV) in cm day−1 vertically averaged between 100 m and 600 m depth, (b) SeaWiFS chlorophyll-a concentration (CHL-T) in mg m−3, (c) SeaWiFS chlorophyll-a concentration anoma-lies (CHL-A) in mg m−3, (d) Total Particle Flux (TPF) in mg m−2day−1at 500 m depth. CVV, CHL-T and CHL-A are hor-izontally averaged over an area of 70 km side (area F) around the station coordinates. The tick marks on the x-axis indicate the 15th day of each month.
biomass magnitude does not appear to directly determine particle flux variability. On the contrary, TPFs appear to respond with a similar magnitude to the winter chlorophyll concentration maximum (peaks in late winter 2000 and 2001 at the Urania site) and to its interannual anomalies: higher than average TPFs often concur with positive CHL-A values (autumn 1999 and 2000 and late spring 2000 at the Urania site; spring 2000 at the Bannock site), whereas lower than av-erage TPFs are often associated with negative CHL-A values (late summer 2000 and winter 2000 and 2001 at the Urania site; winter 2001 at the Bannock site).
These results suggest a non-linear relationship between upper ocean algal biomass and deep sedimentary fluxes, with an amplification of the summer-autumn response of particle fluxes to upper chlorophyll amount with respect to winter and early spring. The weak coupling between primary pro-ducers and deep particle fluxes supports the hypothesis that particle export depends, in addition to primary production,
Fig. 11. Bannock site: (a) simulated Current Vertical Ve-locities (CVV) in cm day−1 vertically averaged between 100 m and 600 m depth, (b) SeaWiFS chlorophyll-a concentration (CHL-T) in mg m−3, (c) SeaWiFS chlorophyll-a concentration anomalies (CHL-A) in mg m−3, (d) Total Particle Flux (TPF) in mg m−2day−1at 2800 m depth. CVV, CHL-T and CHL-A are horizontally averaged over an area of 70 km side (area F) around the station coordinates. The tick marks on the x-axis indicate the 15th day of each month.
also on the biological pump efficiency. Other studies have shown that in oligotrophic areas primary production and par-ticle fluxes are often decoupled (Buesseler, 1998; Conte et al., 2001; Lutz et al., 2002) and that the sinking fraction of primary production varies seasonally possibly in response to flux biodegradability (Lutz et al., 2007). These results argue for a relevant role of the food web structure, sedimentation pathways and particle properties in affecting deep particle fluxes. From our data it is possible to speculate on three pos-sible factors affecting the biological pump: 1) grazer commu-nity composition and activity; 2) phytoplankton coagulation processes; 3) particle properties connected to Saharan dust events.
a) b)
d)
c)
e) f)
Fig. 12.Quasi True Color satellite images:(a)22 May 2000 at 10:36 a.m.,(b)22 May 2000 at 12:14 a.m.,(c)24 May 2000 at 12:02 a.m., (d)26 May 2000 at 10:15 a.m.,(e)26 May 2000 at 11:51 a.m.,(f)27 May 2000 at 10:57 a.m.
chlorophyll anomalies generated by upward CVVs. Ob-servations in coastal areas of the Mediterranean Sea show that warm-dwelling species of pelagic tunicates, such as O. dioica, D. nationalis and T. democratica, exhibit their seasonal maximum in spring-summer and autumn (Avancini et al., 2006). We could then specu-late that gelatinous zooplankton organisms in this area would be mostly abundant during the summer and au-tumn months whereas they would be lower in win-ter. If this is the case, the summer and autumn par-ticle flux pulses at the Urania site might be related to higher macrozooplankton abundance. The discrepancy between the Urania and Bannock particle fluxes could then be related to differences in macrozooplankton pop-ulations at the two sites.
2. The exudation by phytoplankton organisms – includ-ing coccolithophores – of transparent exopolymer par-ticles (TEP) may be playing a relevant role in promot-ing phytoplankton aggregation and export at depth (En-gel, 2004). Beauvais et al. (2003) observe, in an off-shore site of the western Mediterranean Sea, an increase in TEP volume after the spring bloom and throughout the summer months, and they relate this feature to in-creases in carbon excretion by phytoplankton and to thermally stratified conditions. Thus it is possible that during summer there may be more favorable conditions for TEP-enhanced phytoplankton aggregation followed by higher particle fluxes.
3. The higher frequency of Saharan dust events in summer might be responsible for the high particle flux event in May-June 2000, as it will be discussed in Sect. 4.3.
4.3 Dust-enhanced particle fluxes in May–June 2000 Between mid-May and the beginning of June 2000, a strong particle flux peak occurs at both the Urania and Bannock sites (Figs. 6, 7 and 8). Since we cannot fully trust the particle flux peak occurring in mid-May (because of the incorrect sedi-ment trap opening) we concentrate on the particle flux peak occurring at the beginning of June 2000. We suggest that this event may be due to a Saharan dust pulse, which would enhance lithogenic and possibly biogenic flux.
Saharan dust transport over the Mediterranean occurs fre-quently in spring and summer in the form of non-continuous “pulses” (Kubilay et al., 2000). Dust particles may repre-sent an important source of nutrients in the euphotic layer (Markaki et al., 2003; Herut et al., 2005), and may act as ballast on organic matter settling within the ocean interior (Klaas and Archer, 2002). Zu˜niga et al. (2008) observe in the open Algero-Balearic Basin an increase of particle fluxes (and of the lithogenic fraction therein) associated with sum-mer and autumn Saharan dust pulses.
L. Patara et al.: Particle fluxes and ocean vertical velocities 345
Fig. 13. Simulated current horizontal velocities (cm s−1) at 90 m, 500 m and 2800 m depth at the Urania (top) and Bannock (bottom) sites, temporally averaged over the sediment trap rotation intervals. The tick marks on the x-axis indicate the 15th day of each month.
4.4 Impact of horizontal advection
In Fig. 13 we show, for the Urania and Bannock sites, simu-lated horizontal currents at 90 m, 500 m and 2800 m depth, temporally averaged over the sediment trap rotation inter-vals. Horizontal currents at the Urania site have a mean of 7.5–2.8–0.6 cm s−1at 90–500–2800 m depth respectively,
whereas at the Bannock site they have a mean of 4.1–2.0– 0.2 cm s−1 at 90–500–2800 m depth respectively. At 90 m
depth, horizontal currents at the Urania site are higher with respect to the Bannock site, and a rather pronounced season-ality is evident, with strongest currents (>15 cm s−1) occur-ring in autumn 1999. On the other hand, at 500 m and 2800 m depth mean currents are lower in amplitude (<5 cm s−1) and almost stationary with greater variability again at the Urania site.
Because horizontal velocities in our study area are gener-ally well below 5 cm s−1at both 500 m and 2800 m depth, we do not expect a significant impact of hydrodynamics on sed-iment trap collecting efficiency (Buesseler et al., 2007). Lat-eral advection in the upper ocean may however modify the source region of particles collected by deep sediment traps (Siegel et al., 2008). This process might be occurring in par-ticular at the Urania site, where horizontal velocities up to 10–15 cm s−1(i.e. approximately 10 km day−1) would cause a lateral transport of upwelled nutrients and primary produc-ers of about 100–200 km during a 10–15 day period. We ex-pect instead that the Bannock site, where simulated currents at 90 m depth are normally below 5 cm s−1, will be more
rep-resentative of local conditions.
To evaluate the qualitative aspects of lateral advection of primary producers at the Urania site, we compare
chloro-Fig. 14.Urania site: simulated current horizontal velocities at 90 m depth (cm s−1) and SeaWiFS chlorophyll-a concentration (CHL-T) gradients computed over a 200 km side area (mg m−3/200 km). Top: zonal velocities (U) and zonal CHL-T gradients; bot-tom: meridional velocities (V) and meridional CHL-T gradi-ents. With arrows we indicate the direction of lateral advection (grey arrows) and of positive chlorophyll gradients (white arrows) during periods when these simultaneously exceed 5 cm s−1 and 0.01 mg m−3/200 km respectively.
phyll concentration gradients characterizing the study area with horizontal current velocities at 90 m depth, i.e. approx-imately at the base of the euphotic layer. We use SeaWiFS chlorophyll-a monthly means available for the years 1999– 2004 to compute zonal and meridional chlorophyll concen-tration gradients on a 200 km side area around the Urania site. In Fig. 14 these values are plotted together with zonal and meridional current velocities at 90 m depth. We indi-cate with grey arrows the direction of zonal (i.e., west-east) and meridional (i.e., south-north) velocities and with white arrows the direction of positive chlorophyll gradients, dur-ing periods when these simultaneously exceed 5 cm s−1(i.e. approximately 4 km day−1) and 0.01 mg m−3/200 km respec-tively. The choice of these threshold values is not based on quantitative arguments: our aim here is only to make our qualitative description clearer.
We can write a simplified equation accounting for the local rate of change of chlorophyll concentration due to horizontal advection as:
∂Chl ∂t ≈ −u
∂Chl ∂x −v
∂Chl
∂y , (5)
occurring in December 1999, March and May 2000); when horizontal velocity and chlorophyll gradients have the same direction, we expect lateral advection to cause instead a re-duction of local chlorophyll values (as it could be occurring in November 1999 and in January–February 2001). We may then speculate that part of the particle flux increase occur-ring in December 1999 and in March–May 2000 at the Ura-nia site may be due to lateral advection from more productive regions near the site. On the other hand in January-February 2001 particle fluxes may be particularly low because of lat-eral chlorophyll divergence away from the station.
However we also recall that correlation coefficients be-tween CVV and particle fluxes are overall robust with respect to the spatial integration area of CVV (Fig. 9): it could then be argued that, for our studied period and area, horizontal ad-vection is not changing the spatial distribution of particles to such an extent to provoke a substantial effect on CVV-TPF correlations.
5 Conclusions
The mechanisms of sedimentary particle fluxes in the deep Urania and Bannock sites are studied by means of sediment trap records and model simulated vertical velocities.
The current vertical velocities in the Ionian Sea have a large mesoscale signal that is superimposed to a seasonally varying Ekman vertical velocity field at low amplitude. It is found that current vertical velocities at the Urania site are positive (upward motion) in autumn, when pulses of total particle fluxes are found in the water column at 500 m and 2800 m depth.
From sediment trap data the sinking velocities of TPF and TCF are estimated to be 100–200 m day−1while current ver-tical velocities are estimated to be around 1 m day−1. This observation brought us to envisage a tight coupling between surface and deep layers through particle aggregation mecha-nisms. We suggested that fast sinking rates of organic ma-terial in the deep ocean are connected to both lithogenic and biological aggregation mechanisms that transfer parti-cles rapidly in the deep water column.
In synthesis two emerging fast sinking mechanisms have been captured:
1. Pulses of primary production, triggered by upward current vertical velocities, followed by grazing and macrozooplankton-related biogenic flux that rapidly conveys the material in the deep ocean.
2. Large Saharan dust events that fertilize the upper ocean and possibly contribute to aggregation of organic mate-rial, thus producing high sedimentation fluxes.
If these mechanisms are at work in other open ocean ar-eas, it is possible to argue that the carbon export to the deep ocean is larger in the cyclonic gyres of the ocean general cir-culation and during the months of maximum upward vertical velocities. The fast sinking rates estimated in this study could be moreover an evidence of the efficiency of the biological pump in sequestering organic carbon from the surface layers of the open areas of the Mediterranean Sea. Further work is however needed to unravel the relevant physical and biolog-ical features of the marine environment capable of affecting deep particle fluxes.
Acknowledgements. This work has been supported by the Italian Project VECTOR (VulnErability of the Italian coastal area and marine Ecosystems to Climatic changes and Their rOle in the Mediterranean caRbon cycles) funded by the Italian Ministry of Research and University (http://vector-conisma.geo.unimib.it/). Sediment trap samples were available for the study of biogenic particles within an Italian-Dutch cooperation agreement. Mooring equipment was made available by NWO/ALW, through the Dutch Marine Research Facilities at NIOZ; ship-time was funded alterna-tively by NWO and the Italian CoNISMa (National Interuniversity Consortium for Marine Sciences). The study of biogenic particles was performed within the European Project BIODEEP (BIOtech-nologies from the DEEP, EVK3-2000-00042). The SeaWiFS derived products have been processed by CNR-ISAC, and obtained from the E.C. Joint Research Centre, Institute for Environment and Sustainability, through its MERSEA portal (FP6–EC project–SIP3-CT-2003-502885). The Ocean Biology Processing Group of NASA is also acknowledged for the distribution of the SeaWiFS raw data.
Edited by: A. Borges
References
Agostini, V. N. and Bakun, A.: “Ocean triads” in the Mediter-ranean Sea: physical mechanisms potentially structuring repro-ductive habitat suitability (with example application to European anchovy,Engraulis encrasicolus), Fish Oceanogr., 11(3), 129– 142, 2002.
Alldredge, A. L. and Madin, L. P.: Pelagic tunicates – unique her-bivores in marine plankton, Bioscience, 32(8), 655–663, 1982. Avancini M., Cicero, A. M., Di Girolamo, I., Innamorati, M.,
Ma-galetti, E., and Sertorio Zunini, T. (eds.): Guida al riconosci-mento del plancton dei mari italiani, Vol. II – Zooplancton ner-itico. Ministero dell’Ambiente e della Tutela del Territorio e del Mare ICRAM, Roma, Italy, 192–206, 2006.
Bairbakhish, A. N., Bollmann, J., Sprengel, C., Thierstein, H. R.: Disintegration of aggregates and coccospheres in sediment trap samples, Mar Micropaleontol, 37(2), 219–223, 1999.
Beauvais, S., Pedrotti, M. L., Villa, E., Lemee, R.: Transparent ex-opolymer particle (TEP) dynamics in relation to trophic and hy-drological conditions in the NW Mediterranean Sea, Mar. Ecol.-Prog. Ser., 262, 97–109, 2003.
Berelson, W.: Particle settling rates increase with depth in the ocean, Deep-Sea Res Pt II, 49(1–3), 237–251, 2002.
L. Patara et al.: Particle fluxes and ocean vertical velocities 347 Ionian Sea: characterization and downward fluxes, J. Mar. Syst.,
33, 389–410, 2002.
Bricaud, A., Bosc, E., and Antoine, D.: Algal biomass and sea sur-face temperature in the Mediterranean Basin – Intercomparison of data from various satellite sensors, and implications for pri-mary production estimates, Remote Sens Environ, 81(2–3), 163– 178, 2002.
Bruland, K. W. and Silver, M. W.: Sinking rates of fecal pellets from gelatinous zooplankton (salps, pteropods, doliolids), Mar. Biol., 63(3), 295–300, 1981.
Buesseler, K. O.: The decoupling of production and particulate ex-port in the surface ocean, Global Biogeochem. Cy., 12(2), 297– 310, 1998.
Buesseler, K. O., Antia, A. N., Chen, M., Fowler, S. W., Gardner, W. D., Gustafsson, O., Harada, K., Michaels, A. F., van der Loeff’o, M. R., Sarin, M., Steinberg, D. K., and Trull, T.: An assessment of the use of sediment traps for estimating upper ocean particle fluxes, J. Mar. Res., 65(3), 345–416, 2007.
Casotti, R., Landolfi, A., Brunet, C., D’Ortenzio, F., Man-goni, O., Ribera d’Alcal`a, M., and Denis, M.: Composition and dynamics of the phytoplankton of the Ionian Sea (east-ern Mediterranean), J. Geophys. Res.-Ocean., 108(C9), 8116, doi:10.1029/2002JC001541, 2003.
Conte, M. H., Ralph, N., and Ross, E. H.: Seasonal and interan-nual variability in deep ocean particle fluxes at the Oceanic Flux Program (OFP)/Bermuda Atlantic Time Series (BATS) site in the western Sargasso Sea near Bermuda, Deep-Sea Res. Pt. II, 48(8– 9), 1471–1505, 2001.
Conte, M. H., Dickey, T. D., Weber, J. C., Johnson, R. J., and Knap, A. H.: Transient physical forcing of pulsed export of bioreactive material to the deep Sargasso Sea, Deep-Sea Res. Pt. I, 50(10– 11), 1157–1187, 2003.
De La Rocha, C. L. and Passow, U.: Factors influencing the sinking of POC and the efficiency of the biological carbon pump, Deep-Sea Res. Pt. II, 54(5–7), 639–658, 2007.
Demirov, E. and Pinardi, N.: Simulation of the Mediterranean Sea circulation from 1979 to 1993: Part I. The interannual variability, J. Mar. Syst., 33, 23–50, 2002.
Ediger, D. and Yilmaz, A.: Characteristics of deep chlorophyll max-imum in the Northeastern Mediterranean with respect to environ-mental conditions, J. Mar. Syst., 9(3–4), 291–303, 1996. Engel, A.: Distribution of transparent exopolymer particles (TEP)
in the northeast Atlantic Ocean and their potential significance for aggregation processes, Deep-Sea Res. Pt. I, 51(1), 83–92, 2004.
Francois, R., Honjo, S., Krishfield, R., and Manganini, S.: Fac-tors controlling the flux of organic carbon to the bathypelagic zone of the ocean, Global Biogeochem. Cy., 16(4), 1087, doi:10.1029/2001GB001722, 2002.
Goldthwait, S. A. and Steinberg, D. K.: Elevated biomass of meso-zooplankton and enhanced fecal pellet flux in cyclonic and mode-water eddies in the Sargasso Sea, Deep-Sea Res. Pt. II, 55(10– 13), 1360–1377, 2008.
Herut, B., Zohary, T., Krom, M. D., Mantoura, R. F. C., Pitta, P., Psarra, S., Rassoulzadegan, F., Tanaka, T., and Thingstad, T. F.: Response of East Mediterranean surface water to Saharan dust: On-board microcosm experiment and field observations, Deep-Sea Res. Pt. II, 52(22–23), 3024–3040, 2005.
Honjo, S.: Fluxes of particles to the interior of the open oceans, in:
Particle Flux in the Ocean, edited by: Ittekkot, V., Sch¨afer, P., Honjo, S., and Depetris, P. J., SCOPE Published by John Wiley & Sons Ltd, 1996.
Honjo, S., Manganini, S. J., Krishfield, R. A., and Francois, R.: Particulate organic carbon fluxes to the ocean interior and fac-tors controlling the biological pump: A synthesis of global sed-iment trap programs since 1983, Prog. Oceanogr., 76(3), 217– 285, 2008.
Ignatiades, L.: Scaling the trophic status of the Aegean Sea, eastern Mediterranean, J. Sea Res., 54 (1), 51–57, 2005.
Klaas, C. and Archer, D. E.: Association of sinking organic matter with various types of mineral ballast in the deep sea: Implica-tions for the rain ratio, Global Biogeochem. Cy., 16(4), 1116, doi:10.1029/2001GB001765, 2002
Klein, B., Roether, W., Manca, B. B., Bregant, D., Beitzel, V., Ko-vacevic, V., and Luchetta, A.: The large deep water transient in the Eastern Mediterranean, Deep-Sea Res. Pt. I, 46(3), 371–414, 1999.
Knappertsbusch, M. and Brummer, G.-J. A.: A sediment trap in-vestigation of sinking coccolithophorids in the North-Atlantic, Deep-Sea Res. Pt. I, 42(7), 1083–1109, 1995.
Korres, G., Pinardi, N., and Lascaratos, A.: The ocean re-sponse to low-frequency interannual atmospheric variability in the Mediterranean Sea. Part I: sensitivity experiments and energy analysis, J. Climate, 13(4), 705–731, 2000.
Kubilay, N., Nickovic, S., Moulin, C., and Dulac, F.: An illustration of the transport and deposition of mineral dust onto the eastern Mediterranean, Atmos. Environ., 34(8), 1293–1303, 2000. Lee, C., Armstrong, R. A., Beck, A., Cochran, J. K., Wakeham, S.
G., Peterson, M. L., and Miquel, J.-C.: MEDFLUX: Associa-tion of organic matter with ballast minerals in sinking particles. American Geophysical Union Fall Meeting, San Francisco (CA, USA), 13–17 December 2004, OS52A-02, 2004.
L´evy, M., Klein, P., and Treguier, A. M.: Impact of sub-mesoscale physics on production and subduction of phytoplankton in an oligotrophic regime, J. Mar. Res., 59(4), 535–565, 2001. Lutz, M., Dunbar, R., and Caldeira, K.: Regional
variabil-ity in the vertical flux of particulate organic carbon in the ocean interior, Global Biogeochem. Cy., 16(3), 1037, doi:10.1029/2000GB001383, 2002.
Lutz, M. J., Caldeira, K., Dunbar, R. B., and Behrenfeld, M. J.: Seasonal rhythms of net primary production and particulate or-ganic carbon flux to depth describe the efficiency of biological pump in the global ocean, J. Geophys. Res.-Ocean., 112(C10), C10011, doi:10.1029/2006JC003706, 2007.
Madec, G., Delecluse, P., Imbard, M., and L´evy, C.: OPA version 8.1 Ocean General Circulation Model reference manual, Techni-cal Report, Note 11, LODYC/IPSL, Paris, France, 91 pp., 1998. Mahadevan, A.: Modeling vertical motion at ocean fronts: Are
nonhydrostatic effects relevant at submesoscales?, Ocean Model, 14(3–4), 222–240, 2006.
Malanotte-Rizzoli, P., Manca, B. B., D’Alcal`a, M. R., Theocharis, A., Bergamasco, A., Bregant, D., Budillon, G., Civitarese, G., Georgopoulos, D., Michelato, A., Sansone, E., Scarazzato, P., and Souvermezoglou, E.: A synthesis of the Ionian Sea hydrog-raphy, circulation and water mass pathways during POEM Phase I, Prog. Oceanogr., 39(3), 153–204, 1997.
Eastern Mediterranean in the 80s and in the 90s: the big tran-sition in the intermediate and deep circulations, Dynam. Atmos. Ocean., 29(2–4), 365–395, 1999.
Malinverno, E., Ziveri, P., and Corselli, C.: Coccolithophorid distri-bution in the Ionian Sea and its relationship to eastern Mediter-ranean circulation during late fall to early winter 1997, J. Geo-phys. Res.-Ocean., 108(C9), 8115, doi:10.1029/2002JC001346, 2003.
Manca, B. B., Budillon, G., Scarazzato, P., and Ursella, L.: Evolution of dynamics in the eastern Mediterranean af-fecting water mass structures and properties in the Ionian and Adriatic Seas, J. Geophys. Res.-Ocean., 108(C9), 8102, doi:10.1029//2002JC001664, 2003.
Markaki, Z., Oikonomou, K., Kocak, M., Kouvarakis, G., Chanio-taki, A., Kubilay, N., and Mihalopoulos, N.: Atmospheric de-position of inorganic phosphorus in the Levantine Basin, east-ern Mediterranean: Spatial and temporal variability and its role in seawater productivity, Limnol. Oceanogr., 48(4), 1557–1568, 2003.
Mazzocchi, M. G., Nervegna, D., D’Elia, G., Di Capua, I., Aguzzi, L., and Boldrin, A.: Spring mesozooplankton com-munities in the epipelagic Ionian Sea in relation to the Eastern Mediterranean Transient, J. Geophys. Res.-Ocean., 108, 8114, doi:10.1029/2002JC001640, 2003.
McGillicuddy, D. J., Johnson, R., Siegel, D. A., Michaels, A. F., Bates, N. R., and Knap, A. H.: Mesoscale variations of bio-geochemical properties in the Sargasso Sea, J. Geophys. Res.-Ocean., 104(C6), 13381–13394, 1999.
McGillicuddy, D. J., Kosnyrev, V. K., Ryan, J. P., and Yoder, J. A.: Covariation of mesoscale ocean color and sea-surface tempera-ture patterns in the Sargasso Sea, Deep-Sea Res. Pt. II, 48(8–9), 1823–1836, 2001.
Molcard, A., Pinardi, N., Iskandarani, M., Haidvogel, D.B.: Wind driven general circulation of the Mediterranean Sea simulated with a Spectral Element Ocean Model, Dynam. Atmos. Ocean., 35(2), 97–130, 2002.
Pacanowski, R. C. and Gnanadesikan, A.: Transient response in a z-level ocean model that resolves topography with partial cells, Mon. Weather Rev., 126(12), 3248–3270, 1998.
Pinardi, N. and Navarra, A.: Baroclinic wind adjustment processes in the Mediterranean Sea, Deep-Sea Res. Pt. II, 40(6), 1299– 1326, 1993.
Pinardi, N. and Masetti, E.: Variability of the large scale gen-eral circulation of the Mediterranean Sea from observations and modelling: a review, Palaeogeogr. Palaeocl., 158(3–4), 153–174, 2000.
Pinardi, N., Arneri, E., Crise, A., Ravaioli, M., and Zavatarelli, M.: The physical, sedimentary and ecological structure and variabil-ity of shelf areas in the Mediterranean Sea, in: The Sea, Vol. 14, Harvard University Press, 1243–1330, 2005.
Pond, S. and Pickard, G. L.: Introductory Dynamical Oceanog-raphy, 2nd edition, Elsevier Butterworth-Heinemann, 349 pp., 1983.
Robinson, A. R., Hecht, A., Pinardi, N., Bishop, J., Leslie, W. G., Rosentroub, Z., Mariano, A. J., and Brenner, S.: Small synoptic mesoscale eddies and energetic variability of the Eastern Levan-tine Basin, Nature, 327(6118), 131–134, 1987.
Robinson, A. R., Sellschopp, J., Warn-Varnas, A., Leslie, W. G., Lozano, C. J., Haley, P. J., Anderson, L. A., and Lermusiaux, P. F. J.: The Atlantic Ionian Stream, J. Mar. Syst., 20(1–4), 129– 156, 1999.
Sarmiento, J. L. and Gruber, N.: Ocean Biogeochemical Dynamics, Princeton University Press, Princeton, NJ, USA, 318–358, 2006. Sciarra, R., Boehm, E., D’Acunzio, E., and Santoleri, R.: The large scale observing system component of ADRICOSM: the satellite system, Acta Adriatica, 47, 51–64, 2006.
Siegel, D. A., Fields, E., and Buesseler, K. O.: A bottom-up view of the biological pump: Modeling source funnels above ocean sediment traps, Deep-Sea Res. Pt. I, 55(1), 108–127, 2008. Stemmann, L., Gorsky, G., Marty, J.C., Picheral, M., and Miquel,
J. C.: Four-year study of large-particle vertical distribution (0– 1000 m) in the NW Mediterranean Sea in relation to hydrology, phytoplankton, and vertical flux, Deep-Sea Res. Pt. II, 49(11), 2143–2162, 2002.
Sweeney, E. N., McGillicuddy, D. J., and Buesseler, K. O.: Biogeo-chemical impacts due to mesoscale eddy activity in the Sargasso Sea as measured at the Bermuda Atlantic Time-series Study (BATS), Deep-Sea Res. Pt. II, 50(22–26), 3017–3039, 2003. Tonani, M., Pinardi, N., Dobricic, S., Pujol, I., and Fratianni, C.:
A high-resolution free-surface model of the Mediterranean Sea, Ocean Science, 4(1), 1–14, 2008.
Trull, T. W., Bray, S. G., Buesseler, K. O., Lamborg, C. H., Man-ganini, S., Moy, C., and Valdes, J.: In situ measurement of mesopelagic particle sinking rates and the control of carbon transfer to the ocean interior during the Vertical Flux in the Global Ocean (VERTIGO) voyages in the North Pacific, Deep-Sea Res. Pt. II, 55(14–15), 1684–1695, 2008.
Turner, J. T.: Zooplankton fecal pellets, marine snow and sink-ing phytoplankton blooms, Aquat. Microb. Ecol., 27(1), 57–102, 2002.
Volpe, G., Banzon, V. F., Evans, R. H., and Mariano, A. J.: Satellite observations of the impact of dust in a low nutrient low chloro-phyll region: fertilization or artifact?, submitted, 2009.
Yoon, W. D., Marty, J. C., Sylvain, D., and Nival, P.: Degradation of faecal pellets in Pegea confoederata (Salpidae, Thaliacea) and its implication in the vertical flux of organic matter, J. Exp. Mar. Biol. Ecol., 203(2), 147–177, 1996.
Yoon, W. D., Kim, S. K., and Han, K. N.: Morphology and sinking velocities of fecal pellets of copepod, molluscan, euphasiid, and salp taxa in the northeastern tropical Atlantic, Mar. Biol., 139, 923–928, 2001.
Ziveri, P., Rutten, A., de Lange, G. J., Thomson, J., and Corselli, C.: Present-day coccolith fluxes recorded in central eastern Mediterranean sediment traps and surface sediments, Palaeo-geogr. Palaeocl., 158(3–4), 175–195, 2000.