Disparity in Species Richness among Water Scavenger
Beetle (Hydrophilidae) Lineages
Devin D. Bloom1,2, Martin Fika´cˇek3,4, Andrew E. Z. Short1,2*
1Department of Ecology & Evolutionary Biology, University of Kansas, Lawrence, Kansas, United States of America,2Division of Entomology, Biodiversity Institute, University of Kansas, Lawrence, Kansas, United States of America,3Department of Entomology, National Museum, Prague, Czech Republic,4Department of Zoology, Faculty of Sciences, Charles University, Prague, Czech Republic
Abstract
Explaining the disparity of species richness across the tree of life is one of the great challenges in evolutionary biology. Some lineages are exceptionally species rich, while others are relatively species poor. One explanation for heterogeneity among clade richness is that older clades are more species rich because they have had more time to accrue diversity than younger clades. Alternatively, disparity in species richness may be due to among-lineage diversification rate variation. Here we investigate diversification in water scavenger beetles (Hydrophilidae), which vary in species richness among major lineages by as much as 20 fold. Using a time-calibrated phylogeny and comparative methods, we test for a relationship between clade age and species richness and for shifts in diversification rate in hydrophilids. We detected a single diversification rate increase in Megasternini, a relatively young and species rich clade whose diversity might be explained by the stunning diversity of ecological niches occupied by this clade. We find that Amphiopini, an old clade, is significantly more species poor than expected, possibly due to its restricted geographic range. The remaining lineages show a correlation between species richness and clade age, suggesting that both clade age and variation in diversification rates explain the disparity in species richness in hydrophilids. We find little evidence that transitions between aquatic, semiaquatic, and terrestrial habitats are linked to shifts in diversification rates.
Citation:Bloom DD, Fika´cˇek M, Short AEZ (2014) Clade Age and Diversification Rate Variation Explain Disparity in Species Richness among Water Scavenger Beetle (Hydrophilidae) Lineages. PLoS ONE 9(6): e98430. doi:10.1371/journal.pone.0098430
Editor:Diego Fontaneto, Consiglio Nazionale delle Ricerche (CNR), Italy
ReceivedMarch 20, 2014;AcceptedApril 28, 2014;PublishedJune 2, 2014
Copyright:ß2014 Bloom et al. This is an open-access article distributed under the terms of the Creative Commons Attribution License, which permits unrestricted use, distribution, and reproduction in any medium, provided the original author and source are credited.
Data Availability:The authors confirm that all data underlying the findings are fully available without restriction. All data are included within the manuscript and Genbank accession numbers are listed in the supporting information files.
Funding:MF received funding from the Czech Science Foundation grant P506/12/P096 and from the Ministry of Culture of the Czech Republic (DKRVO 2014/13, National Museum, 00023272). The funders had no role in study design, data collection and analysis, decision to publish, or preparation of the manuscript.
Competing Interests:The authors have declared that no competing interests exist.
* E-mail: aezshort@ku.edu
Introduction
One of the most remarkable and pervasive patterns on Earth is the uneven distribution of species richness among clades. Indeed, some clades such as beetles are astoundingly species rich, while others such as monotremes are species poor. While there has long been interest in the disparity of species richness across the tree of life [1–3], recent advances in comparative methods have made investigating the underlying causes tractable [4]. However, the causes of disparity in species richness among lineages remain controversial [5,6].
One intuitive explanation for disparity in species richness is that species rich clades are older, and thus have had more time to accumulate diversity than younger clades [7]. This scenario assumes that constant rates of lineage diversification over time result in a predictive positive relationship between clade age and species richness. Disparity in species richness among clades may also result from differences in net diversification rates (speciation minus extinction) among lineages [8]. Diversification rate differ-ences can result from both intrinsic factors (e.g., key innovations) and extrinsic factors (e.g., habitat shifts), or ecological limits (density-dependence) on clade diversity [9,10]. Widely varying net
diversification rates are expected to weaken a clade age-species richness relationship [10], or even decouple age-diversity corre-lations completely [11].
clade age species relationship did not hold [5]. The generality of this pattern within Coleoptera remains unknown because there have been few studies explicitly investigating the roles of clade age and diversification rates in determining species richness patterns within diverse beetle groups.
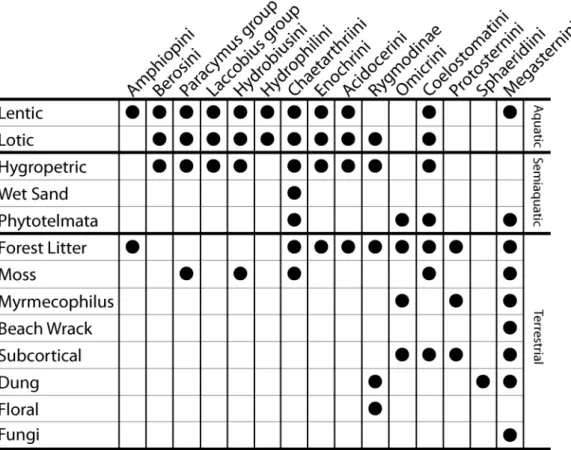
Here we investigate clade age and diversification rate in water scavenger beetles (Hydrophilidae). Hydrophilids are an excellent group for investigating the processes that determine species richness patterns because they are a diverse group with over 3000 described species and a nearly global distribution [19], and they show a huge disparity in species richness across major lineages. As their name implies, many hydrophilid species occupy aquatic habitats, such as small ponds, stream margins, and wetlands. However, hydrophilids have also diversified across a remarkable array of semiaquatic (or ‘‘intermediate’’) habitats including waterfalls and seeps, and terrestrial habitats such as dung, flowers, and forest litter (Figs. 1 and 2). Hydrophilids are thought to have repeatedly transitioned between these varied habitats [19–21], however the relative number and frequency of habitat transitions is largely unknown.
Habitat has previously been show to influence diversification rates in aquatic beetles, although most studies have focused on microhabitat differences such as lotic and lentic environments [22,23]. Macrohabitat transitions in beetles have received far less attention, but studies on other taxonomic groups have demon-strated that macrohabitat and ecological dynamics in general can influence diversification rates [24–29]. Thus transitions between aquatic and terrestrial habitats may play an important role in determining diversity patterns in hydrophilids. Indeed, the largest terrestrial clade (Sphaeridiinae+Rygmodinae) contains approxi-mately 35% of all hydrophilid species, suggesting that a shift
between aquatic and terrestrial habitats may have been a key event [sensu 30,31] that promoted an increase in diversification rates. However, investigations of aquatic-terrestrial habitat shifts across major lineages of insects and the role of these habitat transitions in determining diversity patterns remain understudied.
The absence of a comprehensive time-calibrated phylogeny for hydrophilids has precluded efforts to disentangle the evolutionary processes that explain species richness patterns in this group. Here we use an extensive set of recently revised fossil taxa and relaxed molecular clock analyses to estimate diversification times for water scavenger beetles. We integrate our phylogeny with data on species diversity based on detailed taxonomic expertise of the group and data on habitat preferences of particular taxa largely based on our direct observations in the field. We use comparative methods to investigate the roles of clade age and among-lineage diversification rate variation in determining patterns of species richness in water scavenger beetles, and explore the influence of transitions between aquatic and terrestrial habitats in driving diversification rates.
Methods
To determine divergence times for hydrophilids we used a six-gene molecular data set of 151 species that included all major lineages of Hydrophilidae [19], and ran a Bayesian relaxed clock analysis with eight fossil calibrations in the program BEAST v1.7.2 [32]. We used the following fossils to calibrate the tree (see online supplementary material for more details on fossil ages and the calibration schemes):Protochares brevipalpis(Late Jurassic, Australia) andBaissalarva hydrobioides(Early Cretaceous, Russia) [33]Hydrobius titan (actually belonging to the genus Sperchopsis, Late Eocene,
Figure 1. Distribution of habitat types across the major clades of water scavenger beetles. doi:10.1371/journal.pone.0098430.g001
USA; Fika´cˇek et al., unpubl. data); Limnoxenus olenus (Latest Oligocene, France) [34]; Anacaena paleodominica from Dominican amber (Early Miocene, Dominican Republic) [35], Helochares
(Hydrobaticus) sp. and Cercyon sp. from Baltic amber (Eocene, Europe) (Fika´cˇek, unpubl. data and [36]), andHelophorus paleosibir-icus (Early Cretaceous, Russia) [37]. We used an uncorrelated lognormal tree prior and a birth-death prior for rates of cladogenesis. The dataset was partitioned by gene with partitions unlinked and a GTR model with gamma-distributed rate heterogeneity used for each partition. We ran two analyses for 100 million generations, sampling every 1,000th generation. We verified convergence of parameter estimates and that effective sample sizes were.200 for all parameters using Tracer 1.5 [38]. We combined runs using LogCombiner v1.6.1 [38] and the maximum credibility tree was generated in TreeAnnotator v1.6.1 [38].
To identify shifts in diversification rate we used MEDUSA [39], a comparative method that combines taxonomic and phylogenetic information to fit diversification models using stepwise addition and Akaike Information Criterion (AIC). We accounted for missing species by incorporating our species richness estimates for each major hydrophilid lineage, and pruned the tree to the
most terminal clade for which species richness could be confidently estimated (see electronic supplementary material). MEDUSA uses maximum likelihood to fit birth-death, Yule, or a mixed (both birth-death and Yule) diversification models beginning with a single rate model, and using stepwise addition to add models with increasing complexity (i.e. additional rate shifts). Rate shift models are compared using AICc, with more complex models being added until the AICc threshold is no longer met and the single most likely model is selected. Due to the difficulty of estimating extinction rates from molecular data [40], we implemented all three options (birth-death, Yule, and mixed models).
We determined the expected species richness of a clade given a net diversification rate (using background rate from MEDUSA), a relative extinction rate, and clade age [13] using the R package Geiger [41]. We determined the 95% confidence intervals (CI) for models incorporating high (e = 0.90) and low (e = 0.0) extinction rates. The estimated number of species for clades was plotted with the expected diversity estimates to identify clades that have significantly high or low richness given their respective ages.
We used phylogenetic generalized least-squares regression and standard linear regression to test for a relationship between clade age and log-transformed species richness values using the stem Figure 2. A selection of habitat diversity within the Hydrophilidae.A) Lentic habitat in a vegetated marsh, B) Lotic habitat along a mountain stream, C) Coastal dune pond, D) Detrital forest pool, E)Anacaenasp. (Chaetarthriinae) inside a drained bromeliad tank, F)Oocyclussp. (Laccobiini:
Laccobiusgroup) on a wall seepage, G)Pelosomasp. (Megasternini) emerging from aHeliconiainflorescence, H) wet sand habitat along a creek, I)
Dactylosternumsp. (Coelostomatini) under the bark of a freshly cut tree, J)Chimaearocyon shimadai(Megasternini) in the brood chamber ofPheidole
ants, photo credit: Taku Shimada, K)Rygmodussp. (Rygmodinae) on flowers, photo credit Richard Leschen, L)Nitidulodessp. (Megasternini) on an aroid inflorescence. All photos by A.E.Z. Short unless otherwise indicated.
clade ages (some clades were represented by a single representative preventing the use of crown ages) from our hydrophilid time tree and current figures for species richness for each major lineage compiled from literature. It is well known that species-rich lineages of insects harbor much greater diversity than is presently described [42]. To account for this undescribed diversity, we combined our taxonomic expertise to estimate expected species richness values for each major lineage and repeated the analyses (see Table S1 in File S1).
To explore the relative number of transitions between aquatic, semiaquatic and terrestrial habitats we conducted ancestral character reconstruction. Our taxon sampling does not allow us to determine the absolute number of transitions between these macrohabitats, but we can assess where across the entire hydrophilid tree transitions have occurred, and couple this with MEDUSA determined diversification rate shifts to explore a possible relationship between habitat type and diversification rates. We coded aquatic, semiaquatic, and terrestrial habitats as discrete, unordered character states. All character reconstructions were conducted on the maximum clade credibility tree from our BEAST analyses. We used maximum likelihood (ML) in Mesquite v2.6 [43] to reconstruct ancestral character states under the Mk model [44].
Results
We recovered a topology for Hydrophilidae in our relaxed clock analysis that is consistent with Short & Fika´cˇek [19] (Fig. 3, Figures S1, S2, and S3, and Table S2 in File S1). Our divergence time analyses indicate a Late Triassic origin of modern Hydrophilidae (214.1 Ma). Divergence of most major clades (subfamilies and tribes) took place in the Jurassic, with only the two youngest tribes (Megasternini and Sphaeridiini) diverging in the Early Cretaceous (127.5 Ma). Strikingly, one of the youngest clades, Megasternini, is the most speciose major clade of Hydrophilidae.
Our MEDUSA analyses selected a Yule (pure birth) model as the best-fit diversification model. We found a single net diversification rate increase that occurred within the exceptionally diverse Megasternini (r = 0.053) relative to the background rate for hydrophilids (r = 0.032) (Fig. 4). We did not detect any rate decreases across the hydrophilid tree. However, we found that Amphiopini had fewer species than expected (95% CI) under both high and low extinction rate models (Fig. 4). Meanwhile, Megasternini had higher than expected diversity under a model with low extinction rates, but was within the 95% confidence interval of expected species richness under a high extinction rate. Using phylogenetic least squares regression and standard linear regression we found no relationship between clade age and (estimated) species richness across the full hydrophilid tree (PGLS p = 0.603, linear regression p = 0.520, Fig. 4). However, the removal of Megasternini and Amphiopini (see above) from the dataset results in a significant positive relationship between clade age and species richness (PGLS p = 0.017, linear regression p = 0.009, Fig. 4). We repeated the same analyses using the number of currently described hydrophilids for each major lineage; our major findings were consistent regardless of which species richness values we used (Tables S3, S4, S5 in File S1), therefore we report and discuss the results from the estimated values.
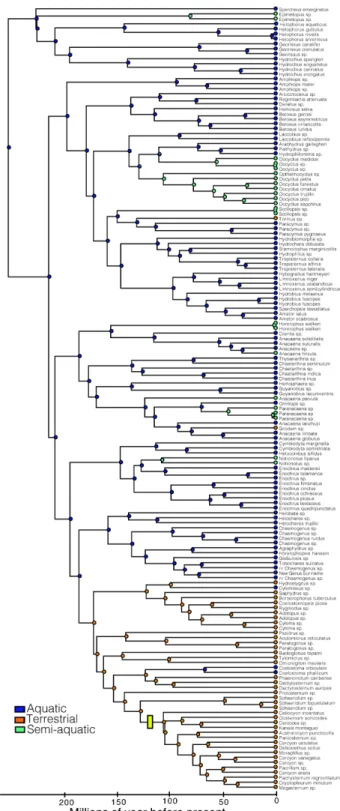
Our ancestral character reconstructions indicate that hydro-philids were ancestrally aquatic (Fig. 5). We infer at least three independent transitions from aquatic to terrestrial habitats, and eight independent transitions from aquatic to intermediate (or semiaquatic) habitats. We infer two secondary returns of terrestrial
lineages to aquatic environment. Terrestrial lineages evolved relatively early in the hydrophilid tree, the first instance occurring approximately 171 Ma (Rygmodinae + Sphaeridiinae) and the most recent 80 Ma (Grodum-lineage of Anacaena). We did not recover any instances where intermediate habitats were a transitional step between aquatic and terrestrial environments.
Discussion
Triassic Origins of the Hydrophilidae
Our results show that the origin of Hydrophilidae (214 Ma) considerably predates the estimate found by Hunt et al. [45] for the entire superfamily Hydrophiloidea (175623.4 Ma), and is more congruent with age estimates for the Hydrophiloidea found by McKenna & Farrell [46] (229–225 Ma). Our molecular age estimates for Early-Middle Jurassic origins of most major hydrophilid clades are consistent with the fossil record because several modern hydrophiloid families were already well established by the Late Jurassic [21,47] and Hydrophilidae was worldwide in distribution by the Late Jurassic [48]. Thus, our study provides the most robust temporal framework to date for interpreting the diversification of hydrophiloid water beetles.
Is Disparity in Species Richness Explained by Clade Age or Diversification Rate?
Our study suggests that both clade age and among lineage diversification rate differences explain the disparity of species richness among hydrophilid clades. Our MEDUSA analyses revealed a single increase in diversification rate that occurred in Megasternini. We also found that Amphiopini has fewer species that expected (95% CI) under both high and low extinction rate models given a constant diversification rate (Fig. 4), suggesting this group has unusually low diversity for its relatively old age. However, detecting only a single rate increase suggests that diversification rate variation alone does not explain the disparity in species richness. Our regression analyses show that when hydrophilids are analyzed as a whole, there is a positive, but non-significant relationship between clade age and species richness. When Amphiopini and Megasternini are excluded from the regression analyses (PGLS and standard linear regression), the remaining clades show a significant positive relationship between clade age and species richness (Fig. 4). Thus only two clades, Amphiopini, a relatively old species poor clade, and Megasternini, a relatively young species rich clade, account for the lack of a positive relationship between clade age and species richness. The remaining diversity of hydrophilids shows that species richness can be predicted by clade age; older clades have more species due to greater amounts of time to accumulate lineage diversity.
richness. It is possible that, much like our results, the latter outcome is driven by a few young exceptionally species rich clades, a few old exceptionally species poor clades, or a combination of the two. If this is the case then beetle diversity may be largely explained by low extinction rates [49] and the ability persisted for a remarkably long time [7,45].
Macroecological Shifts and Diversification Rate
Our results support the hypothesis that water scavenger beetles were ancestrally aquatic and have repeatedly shifted between
aquatic and terrestrial habitats [20]. However, our results do not support so-called intermediate (semiaquatic) habitats as a transi-tional step between terrestrial and aquatic states (Fig. 5). Interestingly, transitions from fully aquatic to semiaquatic habitats seem to occur more frequently (eight transitions) than transitions between fully aquatic and terrestrial habitats (five transitions), or between terrestrial habitats and intermediate habitats (zero transitions). This suggests that some transitions such as aquatic to semiaquatic habitats are relatively easy for hydrophilids, but that there are much stronger constraints [50–53] on other types of Figure 3. Time-calibrated phylogeny for major lineages of Hydrophilidae, along with estimated species richness values.The star indicates the location of the diversification rate increase determined by our MEDUSA analysis.
transitions such as re-invading fully aquatic habitats from either semiaquatic or terrestrial habitats. Ribera [54] argued that lentic habitats (e.g., ponds & lakes) select for generalists that are pre-adapted to invade other niches, whereas lotic habitats (e.g., rivers and streams) select for specialists that are unlikely to undergo habitat transitions. Our results suggest that semiaquatic habitats (e.g. seeps, waterfalls, and phytotelmata) also represent highly specialized adaptive peaks, rather than an intermediate stage between aquatic and terrestrial environment. Once a lineage invades this specialized niche it is difficult leave for other regions of the adaptive landscape [55,56].
We did not detect a diversification rate shift directly associated with any transition between major habitat types (Figs. 3 & 5). Instead, the single rate shift we detected by our MEDUSA analyses followed a major shift from an aquatic-dominant to a terrestrial-dominant lineage by nearly 45 million years (Fig. 5). Furthermore, terrestriality evolved at least two other times (and likely many more in lineages not sampled) in hydrophilid clades that did not experience a diversification rate shift (Fig. 5). This suggests that transitioning into terrestrial habitats did not immediately trigger rapid diversification. However, it is possible that the transition to a terrestrial environment may not immediately spur an increase in diversification, but it sets the stage for a diversification rate shift to occur [57–59] by providing the opportunity for rapid diversification in some clades but not
others. This might explain the lag time between the origin of terrestriality and the diversification rate shift and why not all terrestrial lineages experienced a rate shift. Whether a trait or evolutionary transition spurs diversification is contingent on interactions with other organisms, traits and the environment [57]. Thus, invading terrestrial habitats may promote diversifica-tion, but only in conjunction with other factors. It is also possible that macrohabitat differences do not directly influence net diversification rates to the degree that the use of microhabitats do. If this is the case, it will be necessary to take a more fine scale approach to delineate which terrestrial niches confer elevated rates of diversification.
Why is Megasternini so Diverse?
With over 540 described species and an estimated 870 species, the Megasternini is remarkably diverse compared to other major hydrophilid clades. This diversity is ultimately the result of an exceptional increase in net diversification rates compared to other hydrophilids (Figs. 3 & 4, supplementary materials). It is difficult to determine if the diversification rate shift is due to an increase in speciation, a decrease in extinction, or both. However, the observed diversity of Megasternini was within the expected diversity for a clade of that age with a high rate of extinction (Fig. 4). One interpretation of this result is that extinction simply has not had enough time to reduce the diversity of this clade (i.e., Figure 4. Relationship between clade age and estimated species richness in Hydrophilidae.The shaded regions show 95% confidence interval of the expected diversity under a low (e = 0, solid lines) and high (e = 0.9, dashed lines) extinction.
doi:10.1371/journal.pone.0098430.g004
the pull of the present). However, the selection of a (Yule) pure-birth model suggests extinction rates may not be the driving factor, and that the increase in net diversification is due to increased speciation rates.
Though our results do not implicate a transition from aquatic to terrestrial environments as a cause for explosive diversification within the family, the exceptional species diversity of Megasternini may have an ecological explanation. Megasternini occupies a remarkable diversity of niches within the terrestrial environment and are found in a broader array of habitats than most other hydrophilid lineages (Figs. 2 & 5), such asHeliconiainflorescences, leaf litter, ant nests, and mammal dung. For example, the tribe is the only lineage to have significant radiations of myrmecophilous or beach wrack taxa [60,61]. As habitat has been shown to play an important role in lineage diversification [22,25,50], it is possible that the increase in net diversification rate in Megasternini (either a decrease in extinction rate, increase in speciation rate, or both) is linked to the broad spectrum of habitats found in this lineage. Habitats can differ in diversification rates due to various parameters that are associated with that habitat such as the relative presence of barriers, corresponding geographic range size, or some other property linked to habitat [25,62–64]. Alternatively, repeated habitat shifts may have circumvented diversity-depen-dent regulations of clade growth. The primary mechanism behind diversity-dependence is interspecific competition [11]; the basic concept is that closely related species will compete for limited resources, which in turn reduces speciation and increases extinction and results in a characteristic slowing of lineage accumulation over time [11]. It is possible that repeated transitions between microhabitats allowed Megasternini to escape diversity-dependence by repeatedly presenting ecological opportunity for diversification [9,65–70]. Disentangling which of these mecha-nisms best explains the remarkable species richness in Mega-sternini will require dense taxonomic sampling of this clade and to utilize diversification models that explicitly estimate speciation and extinction rates for particular habitats (character states) [71], and to fit diversity dependent diversification models [11,72].
Why is Amphiopini Species Poor?
Despite its early Jurassic origin, the Amphiopini is significantly more species-poor than expected under both high and low extinction scenarios given a constant rate (Fig. 4). Our MEDUSA analysis does not detect an exceptional slowdown in diversification rate, and thus begs the question of why the tribe has so few species. One explanation may be that just as the Megasternini exhibits remarkable niche breadth, the ecological diversity within the Amphiopini is atypically narrow for the family. Amphiopini is commonly found in lentic habitats in Africa, Asia, and northern Australia [73–75], and represented by a single species found in leaf litter from Madagascar [76]. Lentic habitats are frequently more isolated and more temporary over evolutionary time scales than lotic habitats [54]; these traits have been shown to convey higher rates of dispersal and lower rates of diversification compared to lotic habitats in other aquatic beetle lineages [22]. Thus Amphiopini’s principal specialization in lentic niches may partly explain its relatively low diversity.
Another factor contributing to low species richness in Amphiopini may be its relatively restricted geographic range. Amphiopini is notable in being one of only two major lineages of Hydrophilidae to be absent from the New World. Interestingly, the only tribe that is less diverse (though younger) than the Amphiopini–the Protosternini–also has a relatively restricted geographic range compared to other hydrophilid lineages. It may be that while the diversification rate of Amphiopini has remained similar to the rest of the family, the smaller geographical scale over which it has diversified has limited its absolute species richness.
Figure 5. Ancestral character reconstructions of habitat transitions on the time-calibrated phylogeny of Hydrophilidae. The pie charts at nodes indicate maximum likelihood support for ancestral states. A yellow bar indicates the location of the diversification rate shift determined by MEDUSA.
Supporting Information
Figure S1 Hydrophilidae time tree uniform priors.
(PDF)
Figure S2 Hydrophilidae time tree exponential priors.
(PDF)
Figure S3 Hydrophilidae time tree with posterior support values.
(PDF)
File S1 Supplementary materials.
(DOCX)
File S2 Genbank vouchers.
(DOCX)
Acknowledgments
We thank Matt Davis for providing R scripts and analytical advice. Tiffany Schriever provided statistical advice and help with R. Joseph Brown graciously offered guidance using MEDUSA. Richard Glor, Matt Davis, Leo Smith, Daniel Rabosky, and Ignacio Ribera provided critical feedback that greatly improved this study.
Author Contributions
Conceived and designed the experiments: DDB MF AEZS. Performed the experiments: DDB. Analyzed the data: DDB. Contributed reagents/ materials/analysis tools: DDB MF AEZS. Contributed to the writing of the manuscript: DDB MF AEZS.
References
1. Farrell BD (1998) ‘‘Inordinate Fondness’’ Explained: Why Are There So Many Beetles? Science 281: 555–559.
2. Hutchinson GE (1959) Homage to Santa Rosalia or Why Are There So Many Kinds of Animals? The American Naturalist 93: 145–159.
3. Fisher AG (1960) Latitudinal variations in organic diversity. Evolution 14: 64– 81.
4. Pyron RA, Burbrink FT (2013) Phylogenetic estimates of speciation and extinction rates for testing ecological and evolutionary hypotheses. Trends in ecology & evolution (Personal edition) 28: 729–736.
5. Rabosky DL, Slater GJ, Alfaro ME (2012) Clade Age and Species Richness Are Decoupled Across the Eukaryotic Tree of Life. PLOS Biol 10: e1001381. 6. Wiens BJohn J (2011) The Causes Of Species Richness Patterns Across Space,
Time, And Clades And The Role Of ‘‘Ecological Limits’’. The Quarterly Review of Biology 86: 75–96.
7. McPeek MA, Brown JM (2007) Clade age and not diversification rate explains species richness among animal taxa. The American Naturalist 169: E97–E106. 8. Rabosky DL, Donnellan SC, Talaba AL, Lovette IJ (2007) Exceptional among-lineage variation in diversification rates during the radiation of Australia’s most diverse vertebrate clade. Proceedings of the Royal Society B-Biological Sciences 274: 2915–2923.
9. Rabosky DL (2009) Ecological limits and diversification rate: alternative paradigms to explain the variation in species richness among clades and regions. Ecology Letters 12: 735–743.
10. Rabosky DL (2010) Primary Controls on Species Richness in Higher Taxa. Systematic Biology 59: 634–645.
11. Rabosky DL (2013) Diversity-Dependence, Ecological Speciation, and the Role of Competition in Macroevolution. Annual Review of Ecology, Evolution, and Systematics 44: null.
12. Ricklefs RE, Schwarzbach AE, Renner SS (2006) Rate of lineage origin explains the diversity anomaly in the world’s mangrove vegetation. American Naturalist 168: 805–810.
13. Magallon S, Sanderson MJ (2001) Absolute diversificatoin rates in Angiosperm clades. Evolution 55: 1762–1780.
14. Ricklefs RE (2003) Global diversification rates of passerine birds. Proceedings of the Royal Society of London Series B: Biological Sciences 270: 2285–2291. 15. Ricklefs RE, Losos JB, Townsend TM (2007) Evolutionary diversification of
clades of squamate reptiles. Journal of Evolutionary Biology 20: 1751–1762. 16. Stephens PR, Wiens JJ (2003) Explaining Species Richness from Continents to
Communities: The Time-for-Speciation Effect in Emydid Turtles. The American Naturalist 161: 112–128.
17. Gamble T, Bauer AM, Colli GR, Greenbaum E, Jackman TR, et al. (2011) Coming to America: multiple origins of New World geckos. Journal of Evolutionary Biology 24: 231–244.
18. Ribera I, Vogler AP, Balke M (2008) Phylogeny and diversification of diving beetles (Coleoptera: Dytiscidae). Cladistics 24: 563–590.
19. Short AEZ, Fika´cˇek M (2013) Molecular Phylogeny, Evolution, and Classifica-tion of the Hydrophilidae (Coleoptera). Systematic Entomology 38: 723–752. 20. Bernhard D, Schmidt C, Korte A, Fritzsch G, Beutel RG (2006) From terrestrial
to aquatic habitats and back again – molecular insights into the evolution and phylogeny of Hydrophiloidea (Coleoptera) using multigene analyses. Zoologica Scripta 35: 597–606.
21. Fika´cˇek M, Prokin AA, Angus RB, Ponomarenko AG, Yue Y, et al. (2012) Phylogeny and the fossil record of the Helophoridae reveal Jurassic origin of modern hydrophiloid lineages (Coleoptera: Polyphaga). Systematic Entomology 37: 420–447.
22. Ribera I, Barraclough TG, Vogler AP (2001) The effect of habitat type on speciation rates and range movements in aquatic beetles: inferences from species-level phylogenies. Molecular Ecology 10: 721–735.
23. Ribera I, Foster GN, Vogler AP (2003) Does habitat use explain large scale species richness patterns of aquatic beetles in Europe? Ecography 26: 145–152. 24. Vrba ES (1987) Ecology in relation to speciation rates: some case histories of
Miocene-Recent mammal clades. Evolutionary Ecology 1: 283–300.
25. Bloom DD, Weir JT, Piller KR, Lovejoy NR (2013) Do freshwater fishes diversify faster than marine fishes? A test using state-dependent diversification analyses and molecular phylogenetics of New World Silversides (Atherinopsi-dae). Evolution 67: 2040–2057.
26. Benton MJ (2009) The Red Queen and the Court Jester: Species diversity and the role of biotic and abiotic factors through time. Science 323: 728–732. 27. Alfaro ME, Santini F, Brock CD (2007) Do reefs drive diversification in marine
teleosts? Evidence from the pufferfish and their allies (Order Tetraodontiformes). Evolution 61: 2104–2126.
28. Sequeira AS, Lanteri AA, Albelo R, Bhattacharya S, Sijapati M (2008) Colonization history, ecological shifts and diversification in the evolution of endemic Galapagos weevils. Molecular Ecology 17: 1089–1107.
29. McPeek MA (2007) The macroevolutionary consequences of ecological differences among species. Palaeontology 50: 111–129.
30. Moore BR, Donoghue MJ (2009) A Bayesian approach for evaluating the impact of historical events on rates of diversification. Proceedings of the National Academy of Sciences of the United States of America 106: 4307–4312. 31. Donoghue MJ (2008) A phylogenetic perspective on the distribution of plant
diversity. Proceedings of the National Academy of Sciences 105: 11549–11555. 32. Drummond AJ, Suchard MA, Xie D, Rambaut A (2012) Bayesian phylogenetics
with BEAUti and the BEAST 1.7. Molecular Biology and Evolution. 33. Fika´cˇek M, Prokin A, Yan E, Yue Y, Wang B, et al. (2014) Modern hydrophilid
clades present and widespread in the Late Jurassic and Early Cretaceous (Coleoptera: Hydrophiloidea: Hydrophilidae). Zoological Journal of the Linnean Society 170: 710–734.
34. Fika´cˇek M, Prokop J, Nel A (2010) Fossil water scavenger beetles of the subtribe Hydrobiusina (Coleoptera: Hydrophilidae) from the Upper Oligocene locality of Aix-en-Provence. Acta Entomologica Musei Nationalis Pragae 50: 445–458. 35. Fika´cˇek M, Engel MS (2011) An aquatic water scavenger beetle in Early
Miocene amber from the Dominican Republic (Coleoptera: Hydrophilidae). Annales Zoologici 61: 621–628.
36. Kubisz D (2000) Fossil beetles (Coleoptera) from Baltic amber in the collection of the Museum of Natural History of ISEA in Krako´w. Polish Journal of Entomology 69: 225–230.
37. Fika´cˇek M, Prokin AA, Angus RB, Ponomarenko AG, Yue Y, et al. (2012) Revision of Mesozoic fossils of the helophorid lineage of the superfamily Hydrophiloidea (Coleoptera: Polyphaga). Acta Entomologica Musei Nationalis Pragae 52: 89–127.
38. Drummond AJ, Rambaut A (2007) BEAST: Bayesian evolutionary analysis by sampling trees. BMC Evolutionary Biology 7: 214.
39. Alfaro ME, Santini F, Brock C, Alamillo H, Dornburg A, et al. (2009) Nine exceptional radiations plus high turnover explain species diversity in jawed vertebrates. Proceedings of the National Academy of Sciences of the United States of America 106: 13410–13414.
40. Rabosky DL (2010) Extinction rates should not be estimated from molecular phylogenies. Evolution 6: 1816–1824.
41. Harmon LJ, Weir JT, Brock CD, Glor RE, Challenger W (2008) GEIGER: investigating evolutionary radiations. Bioinformatics 24: 129–131.
42. Hamilton Andrew J, Basset Y, Benke Kurt K, Grimbacher Peter S, Miller Scott E, et al. (2010) Quantifying Uncertainty in Estimation of Tropical Arthropod Species Richness. The American Naturalist 176: 90–95.
43. Maddison WP, Maddison DR (2011) Mesquite: a modular system for evolutionary analysis. 2.75 ed.
44. Pagel M (1999) The maximum likelihood approach to reconstructing ancestral character states of discrete characters on phylogenies. Systematic Biology 48: 612–622.
45. Hunt T, Bergsten J, Levkanicova Z, Papadopoulou A, John OS, et al. (2007) A comprehensive phylogeny of beetles reveals the evolutionary origins of a superradiation. Science 318: 1913–1916.
46. McKenna D, Farrell B (2009) Beetles (Coleoptera). In: Hedges SB, Kumar S, editors. The Timetree of Life: Oxford University Press. 278–289.
47. Prokin AA (2009) New water scavenger beetles (Coleoptera: Hydrophilidae) from the Mesozoic of Mongolia. Paleontological Journal 43: 660–663. 48. Fika´cˇek M, Prokin A, Yan E, Yue Y, Wang B, et al. (in press) Modern
hydrophilid clades present and widespread in the Late Jurassic and Early Cretaceous (Coleoptera: Hydrophiloidea: Hydrophilidae). Zoological Journal of the Linnean Society.
49. Labandeira CC, Sepkoski JJ (1993) Insect diversity in the fossil record. Science 261: 310–315.
50. Betancur-R R, Ortı´ G, Stein AM, Marceniuk AP, Alexander Pyron R (2012) Apparent signal of competition limiting diversification after ecological transitions from marine to freshwater habitats. Ecology Letters 15: 822–830.
51. Bloom DD, Lovejoy NR (2012) Molecular phylogenetics reveals a pattern of biome conservatism in New World anchovies (Family Engraulidae). Journal of Evolutionary Biology 25: 701–715.
52. Crisp MD, Arroyo MTK, Cook LG, Gandolfo MA, Jordan GJ, et al. (2009) Phylogenetic biome conservatism on a global scale. Nature 458: 754–U790. 53. Vermeij GJ, Dudley R (2000) Why are there so few evolutionary transitions
between aquatic and terrestrial ecosystems? Biological Journal of the Linnean Society 70: 541–554.
54. Ribera I (2008) Habitat constraints and the generation of diversity in freshwater macroinvertebrates. In: Lancaster J, Briers RA, editors. Aquatic Insects: Challenges to Populations. UK: CAB International. 289–311.
55. Martin CH, Wainwright PC (2013) Multiple Fitness Peaks on the Adaptive Landscape Drive Adaptive Radiation in the Wild. Science 339: 208–211. 56. Svensson EI, Calsbeek R (2012) The Adaptive Landscape in Evolutionary
Biology. Oxford: Oxford University Press.
57. de Queiroz A (2002) Contingent Predictability in Evolution: Key Traits and Diversification. Systematic Biology 51: 917–929.
58. Bininda-Emonds ORP, Cardillo M, Jones KE, MacPhee RDE, Beck RMD, et al. (2007) The delayed rise of present-day mammals. Nature 446: 507–512. 59. Wainwright PC, Smith WL, Price SA, Tang KL, Sparks JS, et al. (2012) The
Evolution of Pharyngognathy: A Phylogenetic and Functional Appraisal of the Pharyngeal Jaw Key Innovation in Labroid Fishes and Beyond. Systematic Biology 61: 1001–1027.
60. Fika´cˇek M, Short AEZ (2010) A revision of the Neotropical genus Sacosternum Hansen (Coleoptera: Hydrophilidae: Sphaeridiinae). Zootaxa 2538: 1–37.
61. Smetana A (1978) Revision of the subfamily Sphaeridiinae of America north of Mexico (Coleoptera: Hydrophilidae). Memoirs of the Entomological Society of Canada 105: 1–292.
62. Jablonski D (2008) Species selection: Theory and data. Annual Review of Ecology, Evolution, and Systematics 39: 501–524.
63. Jablonski D, Hunt G (2006) Larval ecology, geographic range, and species survivorship in Cretaceous mollusks: Organismic versus species-level explana-tions. American Naturalist 168: 556–564.
64. Rabosky DL, McCune AR (2010) Reinventing species selection with molecular phylogenies. Trends in Ecology & Evolution 25: 68–74.
65. Rabosky DL (2009) Ecological limits on clade diversification in higher taxa. American Naturalist 173: 662–674.
66. Schluter D (2000) The Ecology of Adaptive Radations: Oxford University Press. 67. Yoder JB, Clancey E, Roches SD, Eastman JM, Gentry L, et al. (2010) Ecological opportunity and the origin of adaptive radiations. Journal of Evolutionary Biology 23: 1581–1596.
68. Burbrink FT, Pyron RA (2010) How Does Ecological Opportunity Influence Rates of Speciation, Extinction, and Morphological Diversification in New World Ratsnakes (Tribe Lampropeltini)? Evolution 64: 934–943.
69. Pyron RA, Burbrink FT (2012) Extinction, ecological opportunity, and the origins of global snake diversity. Evolution 66: 163–178.
70. Parent CE, Crespi BJ (2009) Ecological Opportunity in Adaptive Radiation of Galapagos Endemic Land Snails. The American Naturalist 174: 898–905. 71. Maddison WP, Midford PE, Otto SP (2007) Estimating a binary character’s
effect on speciation and extinction. Systematic Biology 56: 701–710. 72. Rabosky DL, Lovette IJ (2008) Density-dependent diversification in North
American wood warblers. Proceedings of the Royal Society B: Biological Sciences 275: 2363–2371.
73. Minoshima Y, Hayashi M (2012) The first instar larva of Hydrobius pauper Sharp (Coleoptera, Hydrophilidae). Elytra, NS 2: 279–284.
74. Short AEZ, Fika´cˇek M (2011) World catalogue of the Hydrophiloidea (Coleoptera): additions and corrections II (2006–2010). Acta Entomologica Musei Nationalis Pragae 51: 83–122.
75. Watts CHS (1998) Revision of Australian Amphiops Erichson, Allocotocerus Kraatz and Regimbartia Zaitzev (Coleoptera: Hydrophilidae). Records of the South Australian Museum 30: 93–106.