Emissões otoacústicas: produto de distorção em lactentes até
dois meses de idade***
Distortion product otoacoustic emissions in infants from birth to two
months
*Fonoaudióloga. Mestre em Fonoaudiologia pela Pontificia Universidade Católica de São Paulo. Endereço para correspondência: Rua Arlindo Veiga dos Santos, 25 Apto 203A Jardim Marajoara São Paulo -SP - CEP 04671-300
([email protected]). **Fonoaudióloga. Doutora em Saúde Pública e Docente do Curso de Graduação e Pós-Graduação em Fonoaudiologia da Pontifícia Universidade Católica de São Paulo. ***Pesquisa Realizada na Pontifícia Universidade Católica de São Paulo -Divisão de Ensino e Reabilitação dos Distúrbios da Comunicação (Derdic).
Artigo de Pesquisa
Artigo Submetido a Avaliação por Pares Conflito de Interesse: não
Recebido em 20.12.2005.
Revisado em 11.04.2006; 31.08.2006; 11.05.2007.
Aceito para Publicação em 11.05.2007. Vanessa Sinelli Pinto* Doris Ruthy Lewis**
Abstract
Background: there is a need to determine parameters for the analyses of the distortion product otoacoustic emissions (DPOAE) of infants so that it can be used as a clinical criterion in auditory assessment. Aim: to describe the DPOAE records of infants from birth to two months, considering the response level, noise level and the signal to noise ratio in all frequencies; the analysis of response level according to the variables of gender, timpanometry pressure peak, state of infant during the test and distribution of the response percentile level. Method: 138 infants were evaluated, all of which presented no risk indicators for hearing loss and passed the hearing screening test. The parameters used were: L1 = 65dB SPL and L2 = 50dB SPL in the equipment ILO292 - Otodynamics. Results: 70 male and 68 female were evaluated, with ages between 6 to 65 days. The medians for DPOAE level for each frequency (f2) varied between 6.0dB SPL and 16.3dB SPL.The medians for the noise level for each frequency (f2) varied between -12.5dB SPL and -2.1dB SPL. The medians for the signal to noise ratio for each frequency (f2) varied between 10.5dB SPL and 25.5dB SPL. Conclusions: there was no statistically significant difference between genders and between ears for the response level. The timpanometry pression peak determined by three groups (between -50 and +50daPa; < -50daPa and > +50daPa) indicated no influence on records of the response level. For clinical interpretation, percentile 5 can suggest hearing loss and percentile 95 can suggest normal hearing. Studies with infants who present hearing loss are considered important in order to complement the clinical criterion in case of presence of DPOAE and hearing loss.
Key Words: Hearing Tests; Infant; Early Diagnosis. R e s u m o
Tema: na Audiologia clínica há uma necessidade de se estabelecer parâmetros para análise da emissão otoacústica - produto de distorção (EOAPD) em lactentes, com a finalidade de utilizá-los como critério clínico na avaliação audiológica. Objetivo: descrever os achados do registro das EOAPD em lactentes até dois meses de idade por meio da análise do nível de resposta, do nível de ruído e da relação sinal/ruído em todas as bandas de freqüências; da análise do nível de resposta em relação às variáveis: gênero, pico de pressão na timpanometria e estado do lactente durante o exame e da distribuição do percentil do nível de resposta. Método: foram avaliados 138 lactentes sem indicadores de risco para perda auditiva e que passaram na triagem auditiva. Os parâmetros foram: L1 = 65dBNPS e L2 = 50dBNPS no equipamento ILO292 - Otodynamics. Resultados: Foram avaliados 70 lactentes do gênero masculino e 68 do feminino. As medianas do nível de resposta das EOAPD por freqüência (f2) variaram entre 6,0dB NPS e 16,3dBNPS. As medianas do nível de ruído das EOAPD por freqüência (f2) variaram entre -12,5dB NPS e -2,1dBNPS. As medianas da relação sinal/ruído das EOAPD por freqüência (f2) variaram entre 10,5dBNPS e 25,5dBNPS. Conclusões: Não houve diferença estatisticamente significante entre gêneros e entre orelhas para o nível de resposta. O pico de pressão na timpanometria definido por três grupos (entre -50 e +50daPa; < -50daPa e > +50daPa) não influenciou no registro do nível de resposta. Para uma interpretação clínica, o percentil 5 pode sugerir perda auditiva e o percentil 95 pode sugerir audição dentro da normalidade. É importante a realização de estudos com lactentes com perda auditiva para que se possa complementar o critério clínico no caso de presença de EOAPD e perda auditiva.
Palavras-Chave: Testes Auditivos; Lactente; Diagnóstico Precoce.
Referenciar este material como:
Introduction
Early detection of hearing loss is nowadays considered an essential factor for better results in the therapeutic process. Furthermore, the adequate hearing development is critical for the speech and language acquisition allowing the child's social, psychic and educational development.
Deafness in children is considered a real Public Health problem due not only to its high prevalence, but also to its multiple consequences (Oliveira et al. 2002).
A battery of tests is recommended for the diagnosis of hearing loss, using behavioral and electrophysiological evaluations, such as behavioral observation audiometry (BOA - Behavioral Observation Audiometry), acoustic immitance measures, otoacoustic emissions (OAE), auditory brainstem response (ABR). This battery of tests is suggested to determine the type, the degree and the configuration of the hearing loss in order to achieve the differential diagnosis, the intervention and the hearing aid fitting in sensory neural, mixed and conductive disorders (Gravel & Hood, 2001).
It is important to consider that no audiological evaluation technique is considered better than the other. In fact, the use of a battery of procedures is the best way to evaluate the child's hearing correlating all findings. Despite the contribution of technology for the improvement of children's testing, no measure should be used isolated to evaluate a child's hearing (Gravel & Hood, 2001; Jacobson & Jacobson 2004).
The otoacoustic emission has been known for several reasons. One of them is for representing the inner ear skill to create its own sound vibrations, that is the existence of a cochlear activity; before this, it was believed that the cochlea was passive. Another reason is due to the technological development of the OAEs, which allowed its use in both early identification of hearing loss (neonatal hearing screening) and audiological assessment, having a crucial role within the battery of tests (Kemp, 2002).
One of the advantages of using the OAEs as a clinical test is the simple, non invasive and quick way of being measured in the external acoustic meatus. The OAEs are useful in the differential diagnosis of sensory neural hearing loss, in the screening of cochlear function in children or other patients hard to be tested, and in the monitoring of outer hair cells (OHC) in patients exposed to ototoxic drugs, noise, or with progressive hearing pathology (Lonsbury-Martin et al., 2001).
In Brazil, the otoacoustic emission evoked by transient stimulus (TEOAE) is more commonly used either in neonatal hearing screening or in the audiological evaluation, once it presents better defined recording parameters than the distortion product otoacoustic emission (DPOAE). This fact may be evidenced by the existence of a great number of studies with TEOAE in hearing screening (Denzin et al., 2002; Bassetto et al., 2003; Pachoal & Azevedo, 2004; Speri & Pratesi, 2004; Durante et al., 2005; Saitoh et al., 2006).
The distortion product otoacoustic emission has specific characteristics of evaluating high frequency bands and of early detecting hearing loss, being essential in the neonatal hearing screening and in the composition of the battery of tests involving children's audiological assessment (Dell'Aringa et al., 2004). Therefore, there is a need to establish parameters for the analysis of DPOAE findings in children, aiming to use them as clinical criteria in the audiological assessment, once the great majority of studies is performed with adults. These parameters may allow the DPOAE to help in the differential diagnosis of children with and without hearing loss. Thus, according to Sininger (2003), there is an improvement in the diagnosis of children's hearing losses allowing the examination as early as possible and, consequently interventions that provide the oral language development of those children.
The authors observed that the DPOAE response level, noise level and signal to noise ratio were similar for all neonates with and without risk and for those in intensive care units. There was a tendency for response levels greater in 1,5 and 2 kHz, compared with 3 and 4 kHz. Nevertheless, the noise levels decreased while frequency increased, resulting in a more favorable signal to noise ratio in 3 and 4 kHz. For the frequency of 1 kHz, the response level was lower and the noise level, higher. Except for the body activity and the crying of neonates, the state had little influence in the DPOAE results. However, the noise, and consequently the signal to noise ratio were related to the neonate state. The test environment had little influence in the DPOAE recordings, except in the functioning isoletes suggesting that the primary noise source is internal to the neonate (breathing, movements, etc.). There were a few subtle effects of the age in the response level of DPOAE, and the premature neonates produced lower responses.
It's important for the relevance of this study to consider that DPOAE may be present in normal hearing individuals and in individuals with hearing loss (from 30 to 50 dBHL). Therefore, a study that demonstrates the DPOAE response level in individuals with and without a hearing loss, in different age groups using the percentile, is necessary in order for it to be used as an instrument for the differential diagnosis of hearing loss. In the present study neonates from 0 to 2 months of age without hearing loss were evaluated, once most of the studies found in the literature are conducted with adults or with a broad age group.
Thus, the aim of this study was to describe the distortion product otoacoustic emission findings in infants up to two months of age.
The specific aims were:
. to analyze the response level, the noise level and the signal to noise ratio in all frequency bands; . to analyze the response level according to the variables gender, tympanometric peak pressure and neonate state during the exam;
. to establish the percentile distribution of the response level.
Method
This research was carried out in the Clinical Audiology Section of the Communication Disorders Education and Rehabilitation Division (DERDIC - PUC/SP). It is included in the Research Line "Children's hearing" of the Post Graduation
Studies in Speech and Hearing Disorders of Pontifical Catholic University of São Paulo, and it was approved by the University's Ethics Commission - process nº 0165/2003 and by the DERDIC's Research Committee.
One hundred and thirty eight infants (70 male and 68 female, ranging in age from 6 to 65 days of life),coming from the hearing screening service of DERDIC were evaluated from May to December 2004. All infants were invited to take part in the study and those whose parents accepted were included. These parents were informed about the research and signed the informed consent term.
The following procedures were adopted for the inclusion of the infants:
. parental interview in order to verify the possible inclusion of the infant in the research;
. examination of external acoustic meatus for verifying the presence, or not, of earwax or objects that would hinder the exam;
. tympanometry for verifying the tympanometric curve type "A", with a maximum peak compliance at around 0 daPa, with a variation not greater than -100 daPa;
. presence of TEOAE, that is, responses with 50% of general reproducibility with OAEs in 4 consecutive frequency bands, signal to noise ratio of 3 dBSPL in the first two bands and 6 dBSPL in the three last ones including 4000Hz, and probe stability 75% (Prieve, 2002).
The following procedures were adopted for data collecting:
1. the DPOAE recordings were performed in infants placing the probe in the external acoustic meatus. The infants state was described during the test, which were light sleep, deep sleep, and alert without body activity. If the infant was awake moving or crying, the test was not performed until one of the states described above were reached. 2. parameters used for the DPOAE recordings were adapted from Gorga et al. (2000):
. L1= 65 dBSPL and L2= 50 dBSPL;
. frequencies (f2): 1001, 1257, 1587, 2002, 2515, 3174, 4004, 5042 and 6348 Hz;
institution for adequate diagnosis and follow up.
The material used in this study was: otoscope Mini-Heine 2000; middle ear analyzer GSI 33; TEOAE ILO292 Otodynamics; DPOAE ILO292 -Otodynamics.
The following parameters were used in data analysis: frequencies ploted in f2, response level (2f1-f2), noise level (2º standard deviation), and the signal to noise ratio (difference between the noise and the response level). The data set was established from the numeric analysis of DPOAE. For the data analysis, a dependent variable (response level) and the following independent variables were used:
. gender: male and female
. tympanometric pressure peak: the findings were divided into three groups with the purpose to compare the response level medians within the three groups defined by the tympanometry (group 1: between -50 and 50 daPa , group 2: <-50 daPa and group 3: >+50 daPa). Groups constitution defined by the tympanometry is not the same for both ears. For example, an infant whose right ear is in group 1, may have the left ear in group 2 or 3. For this reason, the medians of the three groups were compared, considering each ear separately. . state of the infant during the exam: three groups were constituted aiming to compare the response level medians in the three states (light sleep, deep sleep, and alert without body activity).
This analysis was also performed by ear, once the infant may not be in the same state when being examined in the right and in the left ear.
Statistical analysis
Inferential analysis1
In this part of the analysis, hypothesis tests were performed in order to compare the response level medians at each frequency (f2) according to gender, group defined by the tympanometry and state of infant.
The adopted approach was the Kruskal- Wallis test for the equality of medians of two or more populations. One of the assumptions for the use of this technique is that the observations in
different groups that will be compared, are independent.
Percentile
Percentile p (0<p<1) is the variable value that leaves px100%of the observations below it. For example: p=0,25 (25% of observations are below this value).
In this study, the percentiles 5, 25 (first quartile), 50 (median), 75 (third quartile) and 95 of the response level at each frequency (f2) for both ears were adopted, based on studies of Gorga et al. (1997).
The aim of percentiles is to help the interpretation of the DPOAE recordings of infants up to two months of age. Therefore, a DPOAE may be interpreted by the percentile, considering results below percentile 5 as possible cochlear dysfunction, and results above percentile 95 as within normality patterns.
Results
One hundred and thirty eight infants were evaluated, 70 male and 68 female, all full term babies without risk indicators for hearing loss, and that had passed the hearing screening with TEOAE.
Of the 138 infants, 133 right ears and 132 left ears were assessed (totalizing 265 ears), since it was not possible to register DPOAE in both ears of all infants due to crying or to excessive movements. The age varied from 6 to 65 days of life; the mean age was 21,5 days of life.
Comparison of response level medians in male and female infants: as there is concordance between observations of both ears of the same infant, we considered for each infant the response levels median in the right and left ears (Table 1). We obtained p>0,05 in all frequencies, concluding thus, that there is no gender effect in the response level median (Table 1).
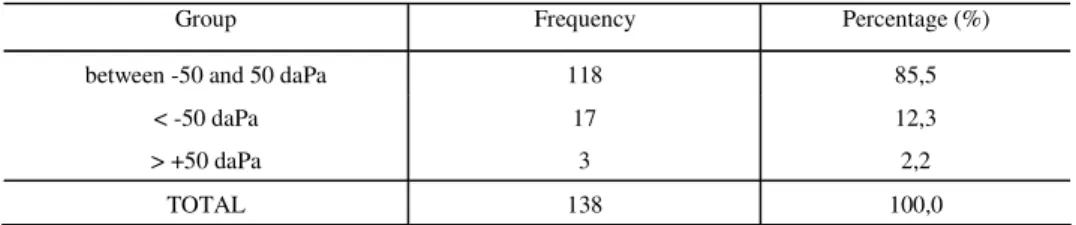
Comparison of response level medians in the three groups defined by tympanometry: the frequencies and the percentage of infants in each group are presented in Tables 2 and 3. The p-values obtained in the Kruskal-Wallis test in each ear and frequency (f2) are presented in Table 4. No differences between the medians in the three groups were detected.
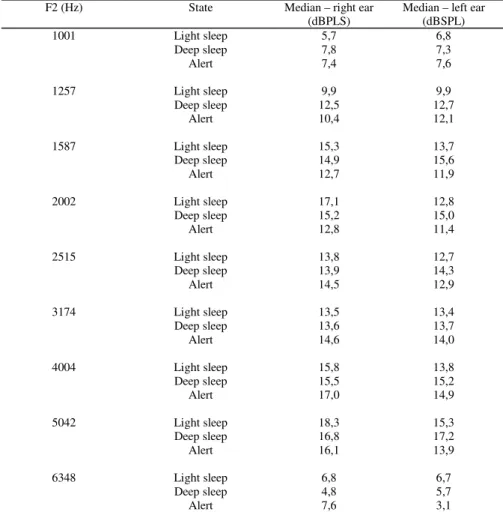
Comparison of response level medians in the three groups defined by the state of the infant: in Table 5, the p-values of the response level medians obtained according to state of each infant in the right and in the left ears will be presented.
The frequencies and the percentage of infants in each state are presented in Tables 6 and 7.
The p-values obtained in the Kruskal-Wallis test are presented in Table 8. No differences between the response level medians were detected in the three states at each frequency (f2), in both right and left ears.
Descriptive analysis of the noise level and of the signal to noise ratio: Table 9 presents the median values of the noise level observed in both ears in different frequencies (f2). It can be observed that medians were higher in lower frequencies (f2), such as 1001, 1257 and 1587 Hz.
Percentile
Next, the response level percentiles 5, 25, 50, 75 and 95 at each frequency (f2) for both ears will be presented, based on Gorga and col (1997).
TABLE 1. Response level medians (dBSPL) and p-values obtained in the Kruskal-Wallis test for the comparison of medians
observed in infants of both genders in both ears
F2 (Hz) Gender Median – right ear (dBSPL)
Median – left ear (dBSPL)
p-value
1001 Male 6,7 9,3 0,191
Female 5,8 5,0
1257 Male 11,8 13,0 0,137
Female 10,4 10,2
1587 Male 14,6 15,4 0,188
Female 13,4 13,1
2002 Male 15,7 14,2 0,318
Female 14,4 12,4
2515 Male 14,3 12,9 0,964
Female 13,9 13,8
3174 Male 13,5 13,0 0,756
Female 14,3 14,0
4004 Male 16,2 14,1 0,833
Female 16,2 15,6
5042 Male 16,6 15,4 0,777
Female 17,5 15,8
6348 Male 6,8 5,4 0,632
Female 6,4 5,7
TABLE 2. Frequencies and percentages of infants in each group defined by tympanometry – right ear
Group Frequency Percentage (%)
between -50 and 50 daPa 118 85,5
< -50 daPa 17 12,3
> +50 daPa 3 2,2
TABLE 3. Frequencies and percentages of infants in each group defined by tympanometry – left ear
Group Frequency Percentage (%)
between -50 and 50 daPa 125 90,6
< -50 daPa 10 7,2
> +50 daPa 3 2,2
TOTAL 138 100,0
TABLE 4. p-values obtained in the Kruskal-Wallis test for the comparison of the response level medians in infants from the three
groups defined by tympanometry
p-value
F2 (Hz) Right ear Left ear
1001 0,680 0,643
1257 0,508 0,290
1587 0,461 0,356
2002 0,564 0,577
2515 0,594 0,724
3174 0,597 0,053
4004 0,466 0,085
5042 0,853 0,787
6348 0,405 0,612
TABLE 5. Response level medians (dBSPL) observed according to the state of the infant in both ears
F2 (Hz) State Median – right ear (dBPLS)
Median – left ear (dBSPL)
1001 Light sleep 5,7 6,8
Deep sleep 7,8 7,3
Alert 7,4 7,6
1257 Light sleep 9,9 9,9
Deep sleep 12,5 12,7
Alert 10,4 12,1
1587 Light sleep 15,3 13,7
Deep sleep 14,9 15,6
Alert 12,7 11,9
2002 Light sleep 17,1 12,8
Deep sleep 15,2 15,0
Alert 12,8 11,4
2515 Light sleep 13,8 12,7
Deep sleep 13,9 14,3
Alert 14,5 12,9
3174 Light sleep 13,5 13,4
Deep sleep 13,6 13,7
Alert 14,6 14,0
4004 Light sleep 15,8 13,8
Deep sleep 15,5 15,2
Alert 17,0 14,9
5042 Light sleep 18,3 15,3
Deep sleep 16,8 17,2
Alert 16,1 13,9
6348 Light sleep 6,8 6,7
Deep sleep 4,8 5,7
TABLE 6. Frequencies and percentages of infants in each state – right ear
State Frequency Percentage (%)
Light sleep 49 36,8
Deep sleep 39 29,3
Alert without body activity 45 33,9
TOTAL 133 100,0
TABLE 7. Frequencies and percentages of infants in each state – left ear
State Frequency Percentage (%)
Light sleep 54 40,9
Deep sleep 37 28,0
Alert without body activity 41 31,1
TOTAL 132 100,0
TABLE 8. p-values obtained in the Kruskal-Wallis test for the comparison of the response level medians in infants in the three states
p-value
f2 (Hz) Right ear Left ear
1001 0,936 0,946
1257 0,753 0,628
1587 0,656 0,136
2002 0,346 0,161
2515 0,978 0,360
3174 0,437 0,742
4004 0,852 0,279
5042 0,801 0,155
6348 0,420 0,269
TABLE 9. Medians of the noise level (dBSPL) observed in infants in both ears in different frequencies F2 (Hz) Median – right ear
(dBSPL)
Median – left ear (dBSPL)
1001 4,7 5,25
1257 6,30 5,60
1587 6,10 6,05
2002 -2,40 -1,85
2515 -5,90 -6,60
3174 -5,20 -6,0
4004 -8,70 -9,25
5042 -9,80 -9,30
TABLE 10 . Signal to noise ratio medians (dBSPL) observed in the infants’ both ears in different frequencies
f2 (Hz) Median – right ear (dBSPL)
Median – left ear (dBSPL)
1001 1,40 1,60
1257 5,40 5,50
1587 8,10 7,40
2002 17,10 15,80
2515 19,90 17,95
3174 19,50 19,10
4004 24,0 24,50
5042 26,10 25,0
6348 11,20 9,90
TABLE 11. Averages, standard - deviation, minimum and maximum values and response level percentiles (dBSPL) in both ears in
different frequencies (f2)
f2 (Hz) N Average Standard
Deviation
Minimum Percentile 5 Percentile 25 Percentile 50 Percentile 75 Percentile 95 Maximum
1001 265 6,64 8,55 -34,7 -6,75 1,4 6,7 12,9 20,45 24,8
1257 265 10,77 8,03 -18,5 -3,46 5,7 11,5 16,5 23,6 28,4
1587 265 13,36 7,96 -8,5 -1,32 8,05 14,2 19,4 25,21 30,5
2002 265 13,40 8,51 -24,4 -3,54 9,1 14,2 19,4 25,85 31,6
2515 265 13,27 7,56 -13,6 0,69 8,85 13,7 18,2 25,24 29,4
3174 265 13,10 6,95 -12,1 0,36 9,4 13,7 17,3 23,47 30,1
4004 265 15,00 7,14 -12,9 2,19 11,05 15,5 20,25 25,88 30,0
5042 265 15,85 7,23 -12,8 3,32 11,5 16,3 20,55 27,3 32,4
FIGURE 1. Response level percentiles 5, 25, 50, 75 e 95 at each frequency (f2) for both ears
-15 -10 -5 0 5 10 15 20 25 30
1001 1257 1587 2002 2515 3174 4004 5042 6348 f2 (Hz)
re
sp
on
se
le
ve
l (
dB
SP
L
)
Discussion
Response level
Concerning the ear effect, there was no statistical difference between right and left for the DPOAE response level. It can be observed that there is a moderate concordance between response levels in the ears of the same infant, that is the observation of both ears of a normal hearing infant are similar. This agrees with the study of Raineri et al. (2001).
Concerning the DPOAE response level median, there was no gender effect. In all frequencies (f2) the p-value was p>0,05: 1001 Hz (p=0,191), 1257 Hz (p=0,137), 1587 Hz (p=0,188), 2002 Hz (p=0,318) 2515 Hz (p=0,964), 3174 Hz (p=0,756), 4004 Hz (p=0,8333), 5042 Hz (p=0,777) and 6348 Hz (p=0,632). This data corroborates the study of Hall III and Mueller III (1997) and Raineri et al. (2001).
No differences between the DPOAE response level medians were detected in the three groups defined by tympanometry (between -50 and +50 daPa; <-50 daPa and >+50 daPa). That is, the tympanometric pressure peak established for these three groups did not influence the DPOAE response level recording in the sample.
As regards to the infant's state during the test, no differences between the DPOAE response level median were detected in the three states (light sleep, deep sleep and alert without body activity), that is, the infant's state did not influence the test result. This data corroborates the study of Gorga et al. (2000) who observed that, except for the neonate's body activity and crying, the state had little influence in the DPOAE results.
Noise level
It can be affirmed that the response level median was higher in lower frequencies (f2), such as 1001 Hz (RE:4,7 dBSPL / LE:5,25 dBSPL); 1257 Hz (RE:6,30 dBSPL / LE:5,60 dBSPL) and 1587 Hz (RE:6,10 dBSPL / LE:6,05 dBSPL). This data agrees with Hall III and Mueller III (1997), who affirmed that the noise affects the identification and the analysis of the DPOAE, specially in frequencies lower than 2 kHz. This finding was also observed in other studies such as Cerruti (2000), Gorga et al. (2000), Raineri et al. (2001) and Balatsouras et al. (2006).
Cerruti (2000) observed difficulty to record DPOAE in lower frequencies because the primary noise source was breathing and movements of the
neonates.
Gorga et al. (2000) observed that the test environment had little influence in the DPOAE recording, except in functioning isoletes, suggesting that the primary noise source is internal to the neonate (breathing and movements).
The higher the frequencies, the lower the average of noise level. This data corroborates Cerruti's (2000) findings.
Signal to noise ratio
Analyzing the DPOAE recording it was possible to observe that noise levels decreased while frequencies increased, resulting in a signal to noise ratio more favorable in 2515 Hz (RE:19,90 dBSPL / LE:17,95 dBSPL) 3174 Hz (RE:19,50 dBSPL/ LE:19,10 dBSPL), 4004 Hz (RE:24,0 dBSPL / LE:24,50 dBSPL) and 5042 Hz (RE:26,10 dBSPL /LE:25,0 dBPL). This data agrees with the study of Gorga et al. (2000), in which more favorable signal to noise ratio were found in 3 and 4 kHz.
Therefore, the higher the signal to noise ratio, the higher the frequencies, agreeing with Cerruti (2000).
It was observed a discrete decrease of the mean response level at the frequency (f2) of 6348 Hz and, consequently a decrease of the mean signal to noise ratio. This data was also observed by Cerruti (2000).
Percentile
The description of the response level values distribution was made through the percentiles. This description allows the construction of a panorama of what is expected concerning the DPOAE response level of infants in this age group (from 0 to 2 months of age).
The response level should be used in the interpretation on DPOAE recordings and not only the signal to noise ratio, since this one depends on the noise level. Therefore, a positive signal to noise ratio may occur due to a higher response level or to a lower noise level.
amplitude. Similarly, response levels below percentile 10% or 5% may be interpreted as indicative of hearing loss, once a few normal hearing ears produce responses with such small amplitudes. Response levels between these two conditions (normal ears and with hearing loss) are more difficult to be interpreted, representing a region where responses of both groups, with and without hearing loss, are superposed.
From the percentiles obtained in this study, based on Gorga et al. (1997), it can be suggested their use for the interpretation of DPOAE in infants up to two months of age, considering a possible alteration of the cochlear function results below percentile 5, and possible normal hearing, results above percentile 95. Results between these percentiles (5 and 95) should be better investigated in order to be interpreted.
Further studies with infants of the same age with hearing loss are necessary in order to complement the interpretation criterion of DPOAE using percentile.
Conclusions
From the results obtained and considering the aims of this research, it is possible to conclude that:
. there was no significant statistical difference between genders and ears for the DPOAE response level.
. the tympanometric pressure peak defined by three groups (between -50 and +50 daPa; <-50 daPa and >+50 daPa) did not influence the recording of the DPOAE response level of the group of infants up to two months of age of this study.
. the infant's state (light sleep, deep sleep and alert without body activity) did not influence the recording of the DPOAE response level.
. the background noise influenced the identification and the analysis of DPOAE at frequencies (f2) below 2002 Hz.
. the response level may be used in the interpretation of the DPOAE and not only the signal to noise ratio, once it depends on the noise level. Using the percentile, a DPOAE recording of an infants up to two months of age may be interpreted, considering a possible alteration of the cochlear function the result below percentile 5, and a possible normal hearing results above percentile 95.
. further studies demonstrating the DPOAE response level of infants with hearing loss using the percentile are necessary in order to complement the clinical criterion in cases of presence of DPOAE and hearing loss.
References
BALATSOURAS, D. G.; KABEROS, A.; KLOUTSOS, G.; ECONOMOU, N. C.; SAKELLARIADIS, V.; FASSOLIS, A.; KORRES, S. G. Correlation of transiently evoke to distortion-product otoacoustic emission measures in healthy children. Int. J. Pediatr. Otorhinolaryngol., Amsterdam, v. 70, n. 1, p. 89-93, jan. 2006.
BASSETO, M. C. A.; CHIARI, B. M.; AZEVEDO, M. F. Emissões otoacústicas evocadas transientes (EOAET): amplitude de resposta em recém-nascidos a termo e pré-termo. R. Bras. Otorrinolaringol., São Paulo, v. 69, n. 1, p. 84-92, jan.-fev. 2003.
CERRUTI, V. Q. Estudo das emissões otoacústicas evocadas em neonatos: transiente e produto de distorção.
2000. 121 f. Tese (Doutorado em Neurociências e Comportamento) - Instituto de Psicologia, Universidade de São Paulo, São Paulo.
DENZIN, P.; CARVALLO, R. M. M.; MATAS, C. G. Análises das emissões otoacústicas transitórias em lactentes com e sem indicador de risco para deficiência auditiva. R. Bras. Otorrinolaringol., São Paulo, v. 68, n. 6, p. 874-881, nov.-dez. 2002.
DELL'ARINGA, A. R.; DELL'ARINGA, A. H. B.; JUARES, A. J. C. Emissões otoacústicas por produto de distorção em crianças de 2 a 7 anos. R. Bras. Otorrinolaringol., São Paulo, v. 70, n. 3, p. 380-384, maio-jun. 2004.
DURANTE, A. S.; CARVALLO, R. M. M.; COSTA, F. S. Características das emissões otoacústicas por transientes em programa de triagem auditiva neonatal. Pró-Fono R. Atual. Cient., Barueri (SP), v. 17, n. 2, p. 133-140,
maio-ago. 2005.
GORGA, M. P.; NEELY, S. T.; OHLRICH, B.; HOOVER, B.; REDNER, J.; PETERS, J. From laboratory to clinic: a large scale study of distortion product otoacoustic emissions in ears with normal hearing and ears with hearing loss. Ear Hear., Baltimore, v. 18, n. 6, p. 440-455, dec. 1997.
GRAVEL, J. S.; HOOD, L. J. Avaliação audiológica infantil. In: MUSIEK, F. E.; RINTELMANN, W. F. Perspectivas atuais em avaliação auditiva. São Paulo: Manole, 2001.
p. 301-322.
HALL III, J. W.; MUELLER III, H. G. Otoacuoustic emissions. In: ____ Audiologists' desk reference: diagnostic audiology principles and procedures. San Diego: Singular Publishing Group, 1997. p. 235-288.
JACOBSON, J; JACOBSON, C. Evaluation of hearing loss in infants and young children. Pediatr. Ann., New York, v. 33, n. 12, p. 811-821, dec. 2004.
KEMP, D. T. Exploring cochlear status with otoacoustic emissions. In: ROBINETTE M. S.; GLATTKE, T. J.
Otoacoustic emissions: clinical applications. 2. ed. New York: Thieme, 2002. cap. 1, p. 01-47.
LONSBURY-MARTIN, B. L.; MARTIN, G. K; TELISCHI, F. F. Emissões otoacústicas na prática clínica. In: MUSIEK, F. E.; RINTELMANN, W. F. Perspectivas atuais em avaliação auditiva. São Paulo: Manole, 2001. p.
163-192.
OLIVEIRA, P.; CASTRO, F.; RIBEIRO, A. Surdez infantil.
R. Bras. Otorrinolaringol., São Paulo, v. 68, n. 3, p. 417-423, mai. 2002.
PASCHOAL, C. P.; AZEVEDO, M. F. Emissões otoacústicas transientes em crianças de mães diabéticas.
Pró-Fono R. Atual. Cient., Barueri (SP), v. 16, n. 2, p.
197-202, mai.-ago. 2004.
PRIEVE, B. A. Otoacoustic emissions in neonatal hearing screening. In: ROBINETTE, M. S.; GLATTKE, T. J.
Otoacoustic emissions: clinical applications. 2. ed. New
York: Thieme, 2002. cap. 14, p. 348-374.
RAINERI, G. G.; COUBE, C. Z. V.; COSTA FILHO, O. A.; ALVARENGA, K. F. Emissões otoacústicas evocadas-produto de distorção em neonatos audiologicamente normais. R. Bras. Otorrinolaringol., São Paulo, v. 65, n. 5, p. 644-648, set.-out. 2001.
SAITOH, Y; SAKODA T.; HAZAMA, M.; FUNAKOSHI, H.; IKEDA, H.; SHIBANO, A.; YAJIN, S.; YODA, S.; DAKE, Y.; ENOMOTO, T.; KITANO, H. Transient evoked otoacoustic emissions in newborn infants: effects of ear asymmetry, gender, and age. J. Otolaryngol.,
Toronto, v. 35, n. 2, p. 133-138, mar. 2006.
SININGER, Y. S. Audiologic assessment in infants. Curr. Opin. Otolaryngol. Head. Neck. Surg., Philadelphia, v. 11, p. 378-382, 2003.