CLIMATE OF BRAZIL’S NORDESTE AND TROPICAL ATLANTIC SECTOR: PREFERRED
TIME SCALES OF VARIABILITY
DIERK POLZIN, STEFAN HASTENRATH
University of Wisconsin-Madison, Atmospheric and Oceanic Sciences, Madison, Wisconsin, USA
[email protected], [email protected]
Received September 2013 - Accepted January 2014
ABSTRACT
Resuming earlier research, this study explores rainfall variability in Brazil’s Nordeste and underlying circulation mechanisms. The semi-arid northern Nordeste has its short rainy season centered around March-April-May, when temperature maximum, low pressure trough and wind conluence reach their southernmost position. Interannual variability can be understood as departures from the average annual cycle. Based on novel long-term datasets, the present study explores the preferred time scales of variability. In Nordeste rainfall and pertinent circulation indices in the tropical Atlantic sector most prominent are frequencies of 13.2, 9.9 and 5.6 years. Frequency peak of 13.1 years appears also in the record of Southern Oscillation, and of 5.6 years in North Atlantic Oscillation, indicative of causality chain.
Keywords: Nordeste, tropical Atlantic, rainfall, climate variability, time scales, spectral analysis.
RESUMO: CLIMA DO NORDESTE DE BRASIL E DO SETOR ATLÂNTICO TROPIACAL; ESCALAS DE TEMPO DAS VARIABILIDADES PREFERENCIAIS
Retomando pesquisas anteriores, este estudo explora a variabilidade da precipitação no Nordeste de Brasil e os correspondentes mecanismos circulatórios. O semiárido da região Norte do Nordeste tem curta estação chuvosa concentrada em torno de marco-abril-maio, quando o máximo de temperatura, cavado de baixa pressão, e conluência de ventos alcançam sua posição mais ao sul. A variabilidade interanual é entendida como sendo o desvio da média do ciclo anual. Baseado em novos arquivos de dados de longo prazo, o presente estudo explora as escalas de tempo das variabilidades preferenciais. A precipitação no Nordeste e os pertinentes índices da circulação no setor do Atlântico Tropical são mais suscetíveis às frequências de 13.2, 9.9 e 5.6 anos. Um pico de frequência de 13.1 anos também aparece nos registros da oscilação austral, e de 5.6 anos na oscilação de Atlântico Norte, indicativo de uma cadeia de causalidades.
Palavras-chave: Nordeste, Atlântico Tropical, precipitação, variabilidade climática, escalas de tempo, análise espectral.
1. INTRODUCTION
This communication complements our earlier explorations. The semi-arid northern Nordeste has a short rainy season, precipitation fails in some years, and droughts have severe human impact. Research in the course of the past century has progressively led to understanding of pertinent circulation mechanisms. The Intertropical Convergence Zone, ITCZ, is the rainbearing system; in the course of the annual cycle it reaches its southernmost position around March-April-May, the core of
analysis is to explore the preferred time scales of variability of Nordeste rainfall and underlying circulation mechanisms. Section 2 describes the data, section 3 gives some background, section 4 deals with correlation of Nordeste rainfall with large-scale circulation, section 5 explores preferred time large-scales of variability, section 6 evaluates the long Fortaleza raingauge series, section 7 explores associations with Southern Oscillation and North Atlantic Oscillation, and a synopsis is offered in the closing section 8.
2. DATA
Most important is an index NEB of March-April-May-June rainfall in the northern Nordeste of Brazil for the years 1921-99, available from earlier work (Hastenrath et al. 2009). For the station Fortaleza in Brazil’s Nordeste raingauge data were obtained of 1849-2012; from these a series March-April-May-June totals was compiled, here denoted FLZ.
Fields of sea surface temperature (SST) are available from the Extended Reconstructed Sea Surface Temperature (ERSST.v3) dataset (Smith et al., 2008), with a spatial resolution of 2° latitude-longitude squares, for the years 1901-2012. Fields of 1000 mb height Z and U and V wind components with a 2° latitude longitude resolution for the years 1901-2012 were obtained from the 20th Century Reanalysis V2 dataset provided by the NOAA/OAR/ESRL/PSD, Boulder, Colorado, USA, from their website at http://www.esrl.noaa.gov/psd/ (Compo et al., 2006, 2011). The ields of SST, Z and wind were analyzed for March-April-May (MAM). Interannual variability was explored with correlation, presented in Section 4.
Archives of the Southern Oscillation (SOI) are accessible at www.reg.bom.au/climate/current/soihtml.shtml and of the North Atlantic Oscillation (NAO) at www.cru.uea.ak.uk/cru/ data/nao.htm. From these, MAM series were compiled of SOI and NAO.
3. BACKGROUND
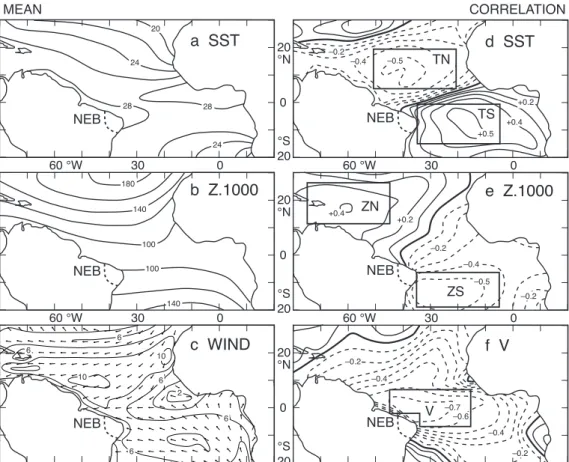
The semi-arid northern Nordeste of Brazil has its short rainy season centered around March-April-May, when temperature maximum, low pressure trough and wind conluence reach their southernmost position in the course of the annual cycle. The circulation in the tropical Atlantic sector has been comprehensively documented in our atlas (Hastenrath and Lamb, 1977). For the present purposes Figures 1a-1c sketches the essentials of the March-April-May mean ield based on the 1921-99 dataset used in the subsequent evaluations. Figure 1a shows a band of warmest surface waters extending from the coast of West Africa to Brazil. Overlying the SST maximum is the hydrostatically controlled low pressure trough (Figure 1b),
in which the tradewinds from the two hemispheres meet along a line of conluence (Figure 1c). The Intertropical Convergence Zone, ITCZ, is the rainbearing system for the northern Nordeste.
The Nordeste experiences great interannual variability of rainfall, and droughts have severe human impact. The mechanisms of interannual variability can in large part be understood as reduction/enhancement of the average annual cycle (Hastenrath and Heller, 1977; Hastenrath and Lamb, 1977; Moura and Shukla, 1981; Hastenrath, 1990; Ward and Folland, 1991; Hastenrath and Greischar, 1993; Hastenrath, 1995, p. 302-309; Greischar and Hastenrath, 2000; Druyan et al. 2002; Moura and Hastenrath, 2004). Thus in dry years waters are anomalously warm and pressure low in the North, waters are cold and pressure high in the South, Northeast tradewinds are weak, cross-equatorial low from the southern hemisphere strong, so the wind conluence stays far North; the opposite departures being characteristic for wet years. Apart from such circulation departures in the tropical Atlantic sector, waters in the equatorial Paciic tend to be anomalously warm during Nordeste dry years, with causality chain understood from teleconnection mechanisms (Kucharski et al., 2008). Preferred time scales of variability in diverse indices have been noted in previous studies, as summarized in Table 1.
4. CORRELATIONS
An overall orientation is given in Figures 1d-1f, by ields of correlation with the Nordeste rainfall index NEB. The maps of Figures 1d-1f should be viewed in context with the long-term mean maps in Figures 1a-1c, which show band of warmest SST, low pressure trough and wind conluence, extending broadly from Brazil to the coast of West Africa. Thus, Figure 1d indicates for abundant rainfall colder/warmer waters to the North/South of the band of warmest waters in the long-term mean in Figure 1a. The Figure 1e shows for abundant rainfall higher/lower pressure in the North/South. The Figure 1f compared to Figure 1c gives for abundant rainfall reduced/ enhanced southerly/northerly wind component over most of the map area, especially near the coast of Brazil. Overall the maps in Figures 1d-1f are plausibly consistent with the known circulation diagnostics of interannual variability (Hastenrath and Heller, 1977; Hastenrath and Lamb, 1977; Hastenrath, 1995, p. 302-309; Kucharski et al., 2008). Index series are compiled for the rectangular domains indicated in Figures 1d-1f, namely TN (tropical North Atlantic SST), TS (tropical South Atlantic SST), dT = TN - TS (SST gradient), ZN (tropical North Atlantic Z), ZS (tropical South Atlantic Z), dZ = ZN - ZS (Z gradient), and V meridional wind component.
correlations, negative with meridional wind component V, positive with positive pressure gradient dZ, negative with positive temperature gradient dT; V has strong correlations, negative with dZ, positive with dT; hydrostatic control is apparent in the negative correlations between TN versus ZN, and TS
versus ZS. The SOI has moderate positive correlation with NEB, and corresponding positive/negative correlations with dZ/dT, and positive/negative with ZN/TN. Correlations with NAO are weak.
FLZ and NEB are correlated at +0.76. Complementing the 1921-1999 series of NEB, results are included in Table 2 0
60 °W 30
0 60 °W 30
28
100 100
10
10 6
6
6 6
6
2 140 140 180
28
24 24
20
a SST
b Z.1000
c WIND
NEB NEB NEB
MEAN CORRELATION
20
0
0 20
60 °W 30 °N
°S
20
0
0 20
60 °W 30 °N
°S
20
0
20 °N
°S
+0.5 +0.2 +0.4 –0.5
–0.2 –0.4
d SST
TN
ZN
ZS
V
TS
e Z.1000
f V
NEB
–0.5 –0.2
–0.2 –0.4
+0.4
+0.2
–0.6 –0.7
–0.2 –0.4 –0.4
–0.2
NEB
NEB
Figura 1 - Maps of 1921-1999 March-April-May. In the left column are the mean ields of (a) SST in °C, (b) Z 1000 mb height in m, (c) resultant
wind isopleths in ms-1 and wind direction. In the right column are the correlations of NEB versus (d) SST, (e) Z.1000, (f) meridional wind component V; solid-line rectangles indicate domains of indices TN, TS, ZN, ZS, V.
1. 13
2. 20-10 5-3 3-2
3. 13, 10 5
4. 14.9-12.7 4.9-4.5 2.4-2.2
5. 23.4 23.0 22.5
13.7-12.6 13.2 13.1 12.7 11.5
9.9 5.6 4.9
3.6 3.5
for the 1921-1999 and 1921-2012 series of FLZ. Overall, the correlations are similar, albeit for FLZ somewhat weaker than for the NEB series. This is plausible, as NEB is a more robust index than the single station FLZ series.
5. TIME SCALES
Preferred time scales of climate variability differ between key regions in the tropical Atlantic sector (Hastenrath, 1995, p. 327-328). An early study (Markham, 1974) found for the long (1849-1971) raingauge series of Fortaleza in Brazil’s Nordeste a preferred frequency of variability around 13 years. Later evaluations of other Nordeste precipitation records and indicative circulation indices (Kousky and Chu, 1978; Hastenrath and Kaczmarczyk, 1981; Chu, 1984) corroborated the early indings. With this history, spectral characteristics were evaluated over the 1921-99 time span for the Nordeste rainfall index NEB and circulation indices in the tropical Atlantic identiied in section 3.
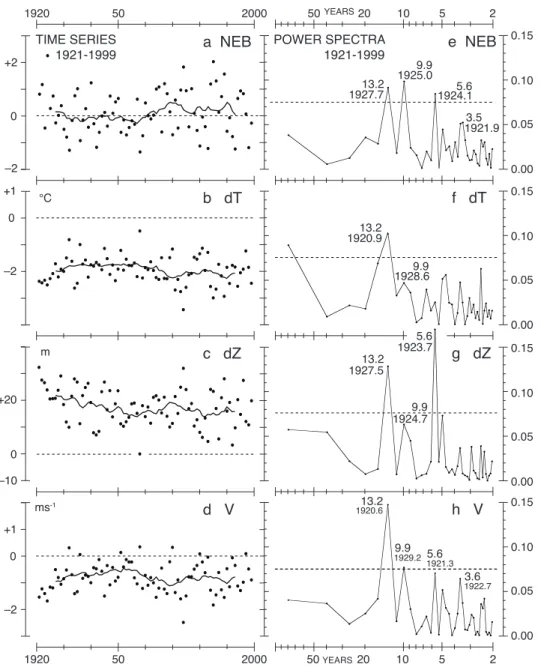
Time series are presented in Figure 2a-2d, for Nordeste rainfall NEB and the indices dT, dZ and V identiied in section 4. The 13 year running mean line shows patterns broadly consistent with the correlation matrix in Table 2: compared to NEB in Figure 2a the lines run broadly parallel of dZ in Figure 2c, and inverse of dT and V in Figures. 2b and 2d.
The time series as a whole contain an ensemble of frequencies, to be sorted out in spectral analysis with results summarized in Figures 2e-2h. NEB in Figure 2e shows most
prominent extrema for 13.2, 9.9 and 5.6 years. These appear also in the other index series, Figures 2f-2h, but 5.6 years is absent in dT. Particularly prominent is 13.2 years in all indices, Figures 2e-2h, and the strong 5.6 year peak for dZ in Figure 2g. It is noted that the frequency 9.9 years in dT and dZ, of 5.6 years in V, and of 3.6 years in all four indices, do not reach the ive percent signiicance level. The timing of the irst maximum of spectral peaks should be appreciated along with the diagnostics of circulation mechanisms in sections 3 and 4 and Table 2. Thus, for the frequency 13.2 years the timing of the irst maximum of NEB is 1927.7, broadly in phase with 1927.5 of the positively correlated dZ, and in about opposite phase with 1920.9 of dT and 1920.6 of V, which are strongly negatively correlated. For the frequency 9.9 years the timing of the irst maximum of NEB at 1925.0 is broadly in phase with 1924.7 of dZ and in about opposite phase with 1928.6 of dT and 1929.2 of V. For the frequency 5.6 years, the timing of the irst maximum of NEB is 1924.1, broadly in phase with 1923.7 of the positively correlated dZ, and about opposite phase with 1921.2 of V, which are strongly negatively correlated. Combining the time series of frequencies 13.2, 9.9, and 5.6 years, we reconstructed a 1921-1999 series of NEB, and this reconstructed series has a correlation of +0.71 with the original NEB series. It should be recognized however, that less prominent frequencies may also be real. In particular, the weak spectral peak of 3.5-3.6 years in NEB and V (Figure 2 e and h) appears prominently in other indices to be considered in the following sections 6 and 7. Preferred frequencies apparent in
(FLZ) FLZ NEB TN TS dT ZN ZS dZ V NAO
TN –30 –34 –48
TS +48 +50 +49 +09
dT –59 –59 –71 +81 –51
ZN +22 +25 +39 –63 –03 –52
ZS –51 –50 –53 +14 –46 +39 +04
dZ +51 +52 +66 –58 +28 –66 +76 –62
V –65 –65 –80 +65 –51 +86 –54 +53 –77
NAO +08 +07 –06 –06 –10 +01 +00 +05 –03 +03
SOI +08 +08 +22 –36 –06 –28 +37 –28 +47 –34 –11
Figures 2 and 3 are also summarized in Table 1, in comparison with results of previous studies.
6. FORTELEZA SERIES 1849-2012
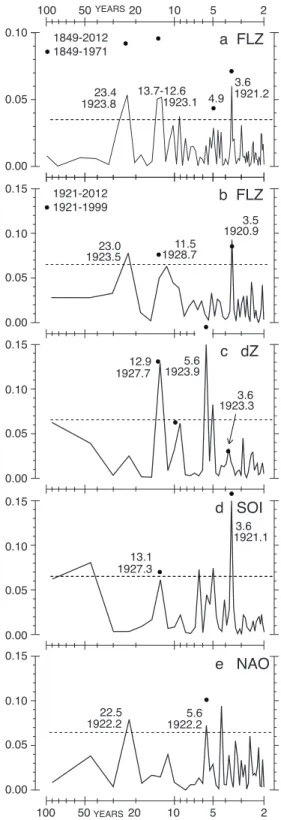
Particularly precious is the Fortaleza raingauge series 1849-2012. Of this Markham (1974) had 1849-1971 available for his pioneering study. The long series offers opportunity to compare spectral characteristics between different time spans. Thus, Figure 3a displays analysis for the total period 1849-2012 and the 1849-1971 used by Markham (1974). Figure 3b
presents results for 1921-2012 and for the 1921-1999 period used in section 5 and Figure 2.
Spectral characteristics over the four time spans 1849-2012, 1849-1971, 1921-1999, 1921-1849-2012, have similarities and differences. Figure 3a shows same but sharper spectral peaks for the 1849-1971 period used by Markham (1974) than for the entire 1849-2012 record. Figure 3b shows the 3.5 year peak pronounced in both 1921-1999 and 1921-2012; the 5.6 year peak is absent, while pronounced in NEB (Figure 2e) and a 4.9 year peak is present in the 1849-1971 FLZ (Figure 3a); the 9.9 year peak is absent; and around 13 years there are differences
1920 50 2000
1920 50 2000
a NEB TIME SERIES
1921-1999
POWER SPECTRA 1921-1999
b dT
c dZ
d V
+2
–2 0
+1
–2 0
°C
m
ms-1 +20
–10 0
+1
–2 0
e NEB
f dT
g dZ
h V
50YEARS
13.2 1927.7
1925.0
1924.1
1921.9 9.9
13.2 1920.9
1928.6
13.2 1927.5
1920.6
1929.2 1921.3
1924.7 1923.7
13.2
9.9
9.9
9.9 5.6
5.6
1922.73.6
5.6
3.5
YEARS
20 10 5 2
50 20 10 5 2
0.15
0.10
0.05
0.00 0.15
0.10
0.05
0.00 0.15
0.10
0.05
0.00 0.15
0.10
0.05
0.00
Figura 2 - Indices of 1921-1999. In the left column are time series plots of (a) NEB dimensionless, (b) dT in °C, (c) dZ in m, (d) V in ms-1; solid
compared to Figures 2e and 3a. Such diversities in the FLZ series should be appreciated in the appraisal of circulation indices in Figure 3.
7. CIRCULATION INDICES SOI AND NAO
Complementing the spectral characteristics of Nordeste rainfall and circulation indices in the tropical Atlantic sector in section 6 and Figure 2, it seems appropriate to explore possible relations to the large-scale circulation indices SOI and NAO. Findings are presented in Figures 3b-3e.
SOI of March-April-May has a peak at 13.1 years with irst maximum at 1927.3 and a very high peak at 3.6 years with irst maximum at 1921.1. The timing of the 13.1 year peak is close to that in dZ and NEB. The timing of the 3.6 year peak is close to that in FLZ; no such peak appears in dT and dZ. Correlations of SOI with NEB and circulation indices in Table 2 are consistent with circulation diagnostics considered in section 2.
NAO of March-April-May has a peak at 5.6 years with irst maximum at 1922.2. This peak is also in NEB and particularly strong in dZ, with irst maximum at 1924.1 and 1923.9, respectively. Noteworthy here is the early work of Namias (1973), pointing out linkages between circulation of midlatitude North Atlantic and Nordeste. With NAO plausibly controlling the pressure rather than the SST ield it is reasonable that the highest peak in dZ is absent in dT. Apart from the 5.6 year peak, overall Table 2 shows no correlation of NAO with other indices.
8. CONCLUSIONS
The rainy season in the northern Nordeste of Brazil is centered around March-April-May, when SST maximum, low pressure trough and wind conluence reach their southernmost position in the course of the annual cycle. The ITCZ is the rainbearing system for the northern Nordeste. Interannual variability can be understood as departures from the average annual cycle. Droughts come with anomalously far northerly ITCZ position, SST warmer and pressure lower in the North, weaker Northeast tradewinds and stronger cross-equatorial low from the southern hemisphere; circulation departures being broadly inverse in years of abundant rainfall. Thus Nordeste rainfall NEB has correlations with indicative circulation indices, strongly negative with southward SST gradient dT, positive with southward pressure gradient dZ, and very strongly negative with meridional wind component V.
Nordeste rainfall NEB and indicative circulation indices have preferred time scales of variability with frequency of 13.2, 9.9, 5.6, and less pronounced 3.6 years. The frequency peak of
b FLZ a FLZ
c dZ
e NAO
23.0 1923.5
11.5 1928.7
3.5 4.9 1849-2012
1849-1971
1920.9
12.9 5.6
3.6 1927.7 1923.9
1923.3
YEARS
100 50YEARS20 10 5 2
100 50 20 10 5 2
0.15
0.10
0.05
0.00 0.15
0.10
0.05
0.00 0.15
0.10
0.05
0.00 0.15
0.10
0.05
0.00
23.4
1923.8 1923.1
13.7-12.6 1921.2 3.6 0.10
0.05
0.00
1922.2 5.6 1922.222.5
d SOI
1927.3
1921.1
13.1
3.6 1921-2012
1921-1999
Figura 3 - Power spectra of time series of indices. Dotted line indicates
the ive percent signiicance level. At spectral peaks, upper numbers are the frequency in years, lower numbers the time of the irst maximum
13.2 years for NEB has its irst maximum at 1927.7, similar for dZ, and in opposite phase for dT and V. The frequency peak of 9.9 years for NEB has its irst maximum at 1925.0, similar for dZ and in opposite phase for dT and V. The frequency peak of 5.6 years for NEB has its irst maximum at 1924.1, for dZ the peak is even stronger, with similar timing; for V the peak is low, with opposite timing; most remarkably, this frequency is absent in dT. The weak frequency peak in NEB of 3.5 years at 1921.9 is accompanied by a similar peak in V of 3.6 years at 1922.7. The timing of frequency peaks in the various indices is overall consistent with the known circulation diagnostics of the tropical Atlantic sector.
Spectral characteristics may change over time, and this is particularly exempliied by the long 1849-2012 FLZ raingauge series. Without claiming ultimate proof we present evidence, that may serve in further exploration. In that spirit, of further interest are possible relations between the large-scale circulation indices NAO and SOI and variability in the Nordeste and tropical Atlantic sector. NAO has a 5.6 year peak as dZ and NEB. We ind that SOI has a 13.1 year peak with timing close to dZ and NEB, and a 3.6 year peak with timing close to FLZ. The long known peak around 13 years in NEB has been found in pertinent circulation characteristics in the tropical Atlantic sector, and further exploration has now led to the Southern Oscillation.
9. ACKNOWLEDGEMENTS
This study was supported by the Variability of Tropical Climate Fund of the University of Wisconsin Foundation. Most important was the effective access to two recent valuable datasets: the Twentieth Century Reanalysis V2 data provided by the NOAA/OAR/ESRL/PSD for the information on pressure and wind, and the ERSST.V3 for data of sea surface temperature. FUNCEME kindly provided the preciously long Fortaleza raingauge series. We appreciate the reviewers feedback.
10. REFERENCES
CHU, P. S. Time and space variability of rainfall and surface circulation in the Northeast Brazil - tropical Atlantic sector. Journal of the Meteorological Society of Japan, v. 62, p.363-370, 1984.
COMPO, G. P.; WHITAKER, J. S.; SARDESHMUKH, P. D. Feasibility of a 100 year reanalysis using only surface pressure data. Bulletin of the American Meteorological Society, v. 87, p. 175-190, 2006.
COMPO, G. P.; WHITAKER, J. S.; SARDESHMUKH, P. D.; MATSUI, N.; ALLAN, R. J.; YIN, X.; GLEASON, B. E.; VOSE, R. S.; RUTLEDGE, G.; BESSEMOULIN, P.;
BRONNIMANN, S.; BRUNET, M.; CROUTHAMEL, R. I.; GRANT, A. N.; GROISMAN, P. Y.; JONES, P. D.; KRUK, M. C.; KRUGERE, A. C; MARSHALL, G. J.; MAUGER, M.; MOK, H. Y.; NORDLY, O.; ROSS, T. F.; ‘ TRIGO, R. M.; WANG, X. L.; WOODRUFF, S. D.; WORLEY, S. J. The Twentieth Century Reanalysis Project. Quarterly Journal of the Royal Meteorological Society, v. 137, p. 1-28, 2011.
DRUYAN, L. D.; FUKALEZA, M.; LONBERGAN, P. Dynamic downscaling of seasonal climate predictions over Brazil. Journal of Climate, v. 15, p. 3411-3426, 2002. GREISCHAR, L.; HASTENRATH, S. The rainy season of
the 1990’s in Northeast Brazil: real-time forecasts and veriication. Journal of Climate, v. 13, p. 3821-3826, 2000. HASTENRATH, S. Prediction of Northeast Brazil rainfall
anomalies. Journal of Climate, v. 3, p. 893-904, 1990. HASTENRATH, S. Climate dynamics of the tropics. second
printing, Kluwer, Dordrecht, Boston, London, 488 pp., 1995. HASTENRATH, S.; GREISCHAR, L. Further work on the
prediction of Northeast Brazil rainfall anomalies. Journal of Climate, v. 6, p. 743-758, 1993.
HASTENRATH S.; HELLER, L. Dynamics of climatic hazards in Northeast Brazil. Quarterly Journal of the Royal Meteorological Society, v. 103, p. 77-92, 1977. HASTENRATH, S.; LAMB, P. J. Climatic atlas of the
tropical Atlantic and eastern Paciic Oceans. University
of Wisconsin Press, Madison, 112 pp., 1977.
HASTENRATH, S.; KACZMARCZYK, E. B. On spectra and coherence of tropical climate anomalies. Tellus, v. 33, p. 453-462, 1981.
HASTENRATH, S.; SUN, L.; MOURA, A. D. Climate prediction for Brazil”s Nordeste by empirical and numerical modeling methods. International Journal of Climatology, v. 29, p. 921-925, 2009.
KOUSKY, V. E.; CHU, P. S. Fluctuations in annual rainfall for Northeast Brazil. Journal of the Meteorological Society of Japan, v. 56, p. 457-465, 1978.
KUCHARSKI, F.; POLZIN, D; HASTENRATH, S. Teleconnection mechanisms of Northeast Brazil droughts. Revista Brasileira de Meteorologia, v. 23, n.2, p. 115-125, 2008.
MARKHAM, C. G. Apparent periodicities in rainfall at Fortaleza, Brazil. Journal of Applied Meteorology, v. 13, p. 176-179, 1974.
MOURA, A. D.: SHUKLA, J. On the dynamics of droughts in Northeast Brazil: observations, theory, and numerical experiments with a general circulation model. Journal of the Atmospheric Sciences, v. 38, p. 2653-2675, 1981. MOURA, A. D.; HASTENRATH, S. Climate prediction for
modeling methods. Journal of Climate, v. 17, p. 2667-2672, 2004.
NAMIAS, J. Influence of northern hemisphere general circulation on droughts in Northeast Brazil. Tellus, v. 24, p. 336-343, 1972.
SMITH, T. M.; REYNOLDS, R. W.: PETERSON, T. C.: LAWRIMOTE, J. Improvements to NOAA’s historical merged land-cean temperature analysis. Journal of Climate, v. 21, p. 2283-2296, 2008.