Sandra Roberta Gouvea FerreiraI
Erly Catarina de MouraII,III Deborah Carvalho MaltaIV, V Flávio SarnoVI
I Nutrition Department. School of Public Health. Universidade de São Paulo (USP). São Paulo, SP, Brazil
II Nucleus of Epidemiological Research in Nutrition and Health. USP. São Paulo, SP, Brazil
III Health Sciences Institute. Universidade Federal do Pará. Belém, PA, Brazil IV General Coordination of Chronic
Noncommunicable Diseases. Health Surveillance Department. Ministry of Health. Brasília, DF, Brazil
V Maternal and Child Nursing and Public Health Department. School of Nursing. Universidade Federal de Minas Gerais. Belo Horizonte, MG, Brazil
VI Postgraduate Program in Public Health Nutrition. School of Public Health. USP. São Paulo, SP, Brazil
Correspondence: Sandra Roberta G. Ferreira Departamento de Nutrição Faculdade de Saúde Pública - USP Av. Dr. Arnaldo, 715
01246-904 São Paulo, SP Brasil E-mail: [email protected] Received: 11/28/2008 Revised: 7/27/2009
Frequency of arterial
hypertension and associated
factors: Brazil, 2006
ABSTRACT
OBJECTIVE: To analyze the frequency of self-reported systemic arterial hypertension and associated factors.
METHODS: Study based on data provided by the system of Vigilância de Fatores de Risco e Proteção para Doenças Crônicas por Inquérito Telefônico
(VIGITEL – Telephone-based surveillance of risk and protective factors for chronic diseases), collected in 2006 in Brazil’s capitals and Federal District. The frequency of systemic arterial hypertension was estimated in 54,369 adults, stratifi ed by sex, geographic region, socio-demographic and behavioral variables and self-reported morbidities. Crude odds ratios of hypertension were calculated, as well as odds ratios adjusted for the study’s variables.
RESULTS: The frequency of self-reported hypertension was 21.6%. It was
higher among women (24.4% versus 18.4%), lower in the North and
Central-West regions and higher in the Southeast region. The frequency of hypertension increased with age, decreased with level of schooling, was higher among blacks and widowed subjects, and lower among singles. The chance of hypertension, adjusted for confounding variables, was higher in subjects with overweight, diabetes, dyslipidemia and cardiovascular events.
CONCLUSIONS: Around one fi fth of the population reported suffering from systemic arterial hypertension. The high frequencies of modifi able risk factors indicate the population segments on which intervention should be targeted, aiming to prevent and control hypertension.
Systemic arterial hypertension (SAH) affects approxi-mately 25% of the world’s population, and the fore-cast is that the disease’s cases will increase by 60%
in 2025.7 It is estimated that 62% of cerebrovascular
disease and 49% of ischemic coronary artery disease can be attributed to suboptimal blood pressure, with
a small variation between sexes.19 Besides the impact
on the morbidity and mortality of populations, SAH is
related to high socioeconomic costs.1
Other cardiovascular risk factors are commonly asso-ciated with SAH, like obesity and glucose and lipids metabolism disorders. Others can be causally associ-ated with the increase in blood pressure levels, such as inadequate diet, excess of salt, excessive alcohol con-sumption, physical inactivity, overweight and smok-ing. Based on this knowledge, lifestyle changes have been indicated in SAH prevention and treatment.
According to the World Health Organization (WHO), in the Americas sub-region, SAH is among the three main risk factors that concur to the total disease load.19 In Brazil, the prevalence of SAH in the urban adult
population varied from 20% to 30%.4,11,13,14,a In a
household survey carried out in 15 capitals and the Federal District about risk factors and self-reported morbidity for non-communicable diseases (NCD), the
frequency of SAH varied from 16% to 45%.b
Methodological differences like non-representative sampling, distinct population groups, restricted geo-graphic inclusion, criteria, quality of the diagnosis and different approaches to data analysis hamper the comparison between studies and, consequently, their utilization as a decision tool for public health.
Surveillance of risk factors and diseases enables to detect trends in time and geographic space and to plan preventive actions in public health. Self-reported
morbidity, without the specifi c diagnostic parameter,
represents an alternative to estimate the frequency of diseases in populations.
Telephone-based surveys have proved to be useful tools to monitor aspects related to the population’s
INTRODUCTION
health, like the Behavioral Risk Factor Surveillance System,c in the United States, which monitors risk fac-tors, diabetes and hypertension, among others. Analy-sis of data from another survey, the National Health
and Nutrition Examination Survey III (1988-1991),d
showed good sensitivity (71%) and specifi city (92%)
in the identifi cation of risk factors and health
prob-lems, and it has been suggested that the frequency of SAH in the United States’ population could be quan-tifi ed by that instrument.17 A similar experience was
already reported in Brazil in 2004.8
The aim of this study was to analyze the frequency of self-reported systemic arterial hypertension and as-sociated factors.
METHODS
Cross-sectional study based on data from the system of Telephone-based Surveillance of Risk and
Protec-tive Factors for Chronic Diseases(VIGITEL) carried
out in 2006. The objective of the system is to moni-tor, on a regular basis, the frequency and distribution of risk and protective factors for NCD in the capitals of the 26 Brazilian states and in the Federal District. To perform this, computer-assisted, telephone-based interviews were conducted in probabilistic samples of the adult population living in households served by
fi xed telephone lines of each city.e
The sampling process of VIGITEL was based on the
draw of 5,000 households with fi xed telephone line
per city, followed by the draw of one dweller aged ≥
18 years per household, who had accepted to be
inter-viewed, until the minimum fi gure of 2,000 interviews
per city was obtained. A total of 54,369 interviews were conducted. Further details about the methodolo-gy employed in VIGITEL can be obtained from other
published studies.10,e The questionnaire administered
by VIGITEL included questions about demographic and socioeconomic characteristics, dietary and phys-ical activity pattern associated with NCD, weight and height, use of cigarettes and alcohol, self-rate of the health status and report of medical diagnosis of SAH,
a Ministério da Saúde. Secretaria de Vigilância em Saúde. Saúde Brasil 2005: uma análise da situação de saúde no Brasil. Brasília; 2005.[cited 2009 Oct 01]. Available from: http://bvsms.saude.gov.br/bvs/publicacoes/saude_brasil_2005.pdf
b Ministério da Saúde. Instituto Nacional de Câncer. Coordenação de Prevenção e Vigilância. Inquérito domiciliar sobre comportamentos de risco e morbidade referida de doenças e agravos não transmissíveis: Brasil, 15 capitais e Distrito Federal, 2002-2003. Rio de Janeiro, 2004. [cited 2009 Oct 01]. Available from: http://bvssp.icict.fi ocruz.br/lildbi/docsonline/0/1/410-inquerito_comportamentos.pdf
c National Center for Chronic Disease Prevention and Health Promotion. Centers for Disease Control and Prevention. Behavioral Risk Factor Surveillance System. Atlanta; 2008 [cited 2008 Jan 20]. Available from: http://www.cdc.gov/BRFSS/
d Centers for Disease Control and Prevention. National Center for Health Statistics. National Health and Nutrition Examination Survey. Hyattsville; 2008 [cited 2008 Jan 20]. Available from: http://www.cdc.gov/nchs/about/major/nhanes/nh3data.htm
diabetes mellitus (DM) and high cholesterol.
The analyzed data refer to SAH that was previously diagnosed by a doctor, considered as response vari-able and categorized as yes or no. The independent variables were divided into sociodemographic (age, skin color, level of schooling and marital status), be-havioral (physical activity during leisure time, dietary habits and smoking) and associated diseases (obesity, DM, dyslipidemia and cardiovascular events). Physi-cal activity during leisure time was considered present if it was of light or moderate intensity and practiced for ≥ 30 minutes, on at least fi ve days a week, or the
practice of ≥ 20 minutes of vigorous physical
activ-ity on three or more days a week; walking was also
considered, when practiced for ≥ 30 minutes, at least
fi ve days a week. Smoking was stratifi ed in three cat-egories (never smoked, smoker or ex-smoker); alco-hol consumption, in two (yes for consumption higher
than fi ve doses for men and four doses for women in at
least one occasion in the last 30 days); and addition of
Body mass index (BMI = weight in kilograms divided
by height in meters squared) was classifi ed according
to WHO criteria (eutrophia if BMI < 25 kg/m², pre-obesity if BMI between 25 and 29.9 kg/m², and
obe-sity for BMI ≥ 30 kg/m²).18 All individuals with BMI
≥ 25 kg/m² were considered with excessive weight.
The variables DM, dyslipidemia and cardiovascular events (myocardial infarction or cerebrovascular ac-cident) were analyzed as present or absent.
For continuous variables, means and standard devia-tions were calculated. Frequencies of SAH by point
and 95% confi dence interval were calculated and
stratifi ed by sex, geographic region and the variables
mentioned above. As the VIGITEL sample is limited to adults with home telephone, expansion factors were used to estimate prevalence in the overall population. A weighting factor corresponding to the number of adults and the inverse of the number of telephone lines of the household was employed. Then, a factor was used to correct possible sociodemographic differences
Table 1. Standardized frequenciesa of arterial hypertension, stratifi ed by sex according to sociodemographic characteristics.
Brazil, 2006. (N=54,369)
Variable Total Men Women
N = 54,369 N = 25,064 N = 29,305 Age (years)
18 to 24 5.7 (5.3;6.1) 4.5 (4.0;5.1) 6.8 (6.2;7.5)
25 to 34 10.4 (9.9;10.9) 9.7 (9.0;10.4) 11.1 (10.4;11.9) 35 to 44 18.1 (17.4;18.8) 16.2 (15.2;17.2) 19.8 (18.8;20.8) 45 to 54 31.7 (30.7;32.7) 30.0 (28.5;31.5) 33.1 (31.7;34.5) 55 to 64 48.1 (46.7;49.5) 38.4 (36.3;40.5) 55.7 (53.8;57.6) ≥65 57.7 (56.3;59.1) 51.7 (49.4;54.0) 61.5 (59.7;63.3) Skin color
White 21.1 (20.6;21.6) 19.0 (18.2;19.8) 22.7 (22.0;23.4) Mixed-ethnicity 21.1 (20.6;21.5) 17.0 (16.4;17.6) 24.9 (24.2;25.6) Black 27.7 (26.2;29.2) 24.0 (21.9;26.2) 30.7 (28.7;32.8)
Others 29.0 (24.6;33.7) 33.8 (27.3;40.9) 24.4 (18.7;30.9) Years of schooling
0 to 4 35.1 (34.2;36.0) 26.2 (24.9;27.5) 41.8 (40.5;43.1) 5 to 8 20.4 (19.8;21.0) 16.3 (15.5;17.1) 24.5 (23.6;25.4)
9 to 11 15.1 (14.5;15.7) 14.9 (14.1;15.8) 15.2 (14.5;16.0) ≥ 12 16.0 (15.3;16.8) 18.7 (17.5;19.9) 13.6 (12.7;14.6) Marital status
Single 10.6 (10.2;11.0) 7.5 (7.0;8.0) 13.5 (12.8;14.2) Married 25.4 (24.9;25.9) 24.9 (24.2;25.6) 26.0 (25.3;26.7)
Separated/divorced 26.9 (25.3;28.5) 21.6 (19.3;24.0) 30.0 (28.0;32.1) Widowed 54.4 (52.5;56.3) 45.3 (40.0;50.7) 55.8 (53.8;57.8) Total 21.6 (21.3;21.9) 18.4 (17.9;18.9) 24.4 (23.9;24.9)
a Sociodemographic distribution of the sample of VIGITEL adjusted to that of the adult population of each city in the 2000
the overall population of the municipality according to the 2000 census.10,a
Logistic regression models provided the odds ratio (OR) of SAH, adjusted for possible confounding variables. Three adjustment models were considered: 1) for age, skin color, level of schooling and mari-tal status; 2) for age, skin color, level of schooling, marital status, leisure physical activity, smoking, al-cohol consumption and addition of salt to prepared meals; and 3) for age, skin color, level of schooling, marital status, leisure physical activity, smoking, alcohol consumption, addition of salt to prepared meals, overweight, diabetes and dyslipidemia. The SPSS software, version 12.0, and Stata, version 8.02, were used and p values < 0.05 were considered sig-nifi cant.
As we used telephone-based interviews, the signed consent document was replaced by the verbal con-sent provided during the telephone contacts with the
interviewees. VIGITEL was approved by the Comitê
Nacional de Ética em Pesquisa para Seres Humanos
(National Committee for Ethics in Research with Hu-man Beings) of the Ministry of Health.
RESULTS
Stratifying by the Brazilian capitals, the lowest
fre-quency of self-reported SAH was verifi ed in Palmas
(Central-West region of Brazil) (15.1%; CI 95% 10.1;21.7) and the highest in Recife (Northeast re-gion) (24.9%; CI 95% 23.0;26.9).
The distribution of the SAH frequencies across geo-graphic regions shows that the report of medical di-agnosis of SAH was lower in the North (18.9%) and Central-West (19.4%) regions and higher in the South (20.9%) and Southeast (22.8%) regions.
Of the 54,369 interviewees, 46.1% were men. The mean age of the studied sample was 39.1 years (sd=16.0). Mixed-ethnicity individuals predominated (52.0%), followed by white (40.6%) and black (6.6%) individu-als. The yellow and red skin colors were reported with frequencies of 0.6% and 0.1%, respectively, and were grouped into the category “others”. The majority of the individuals (53%) reported having between zero and eight years of schooling (data not shown).
The frequency of self-reported SAH was 21.6% (CI 95% 20.9;22.4), adjusted for the population of the 27 cities. Women reported SAH more frequently than
Table 2. Standardized frequenciesa of arterial hypertension, stratifi ed by sex according to behavioral characteristics. Brazil,
2006. (N=54,369)
Variable Total Men Women
Active in leisure time
No 21.8 (21.4;22.2) 18.7 (18.2;19.2) 24.2 (23.7;24.7) Yes 20.7 (19.8;21.6) 16.9 (15.8;18.0) 25.7 (24.3;27.2)
Active walking in leisure
No 19.9 (19.6;20.3) 16.3 (15.8;16.8) 23.3 (22.8;23.8) Yes 30.3 (29.3;31.3) 32.2 (30.6;33.9) 29.2 (27.9;30.4) Habit of smoking
Never smoked 19.5 (19.1;19.9) 15.0 (14.4;15.6) 22.5 (21.9;23.1) Smoker 18.9 (18.1;19.7) 16.6 (15.6;17.6) 22.1 (20.8;23.5) Ex-smoker 29.5 (28.6;30.3) 26.6 (25.5;27.7) 32.9 (31.7;34.2) Signifi cant alcohol consumption
No 22.7 (22.3;23.1) 19.3 (18.7;19.9) 25.1 (24.6;25.6)
Yes 15.8 (15.0;16.6) 15.7 (14.8;16.6) 15.9 (14.4;17.4) Addition of salt to meals
No 22.4 (21.9;22.9) 18.7 (17.9;19.5) 25.4 (24.6;26.2) Yes, sometimes 22.1 (21.6;22.6) 19.0 (18.3;19.7) 24.8 (24.1;25.5)
Yes 14.2 (13.2;15.3) 13.8 (12.4;15.2) 14.8 (13.2;16.4)
a Sociodemographic distribution of the sample of VIGITEL adjusted to that of the adult population of each city in the 2000
Demographic Census, considering the population weight of each city.
men (24.4% versus 18.4%), resulting in a prevalence ratio of 1.33. SAH frequency increased with age, de-creased with level of schooling, was higher among black individuals and in widowed subjects and was
lower among singles (Table 1). These fi ndings were
the basis for the adjustments in the analysis of the as-sociations with SAH.
Table 2 shows SAH frequencies according to sex and behavioral characteristics. Among men, SAH was more frequent in individuals who did not practice physical activity during leisure time. A statistically
signifi cant association was found between the
pres-ence of SAH and the practice of walking for both sexes. Higher SAH frequency was found among ex-smokers and among the subjects who did not consume alcohol. Among individuals who added salt to the meals, the frequency of SAH was lower.
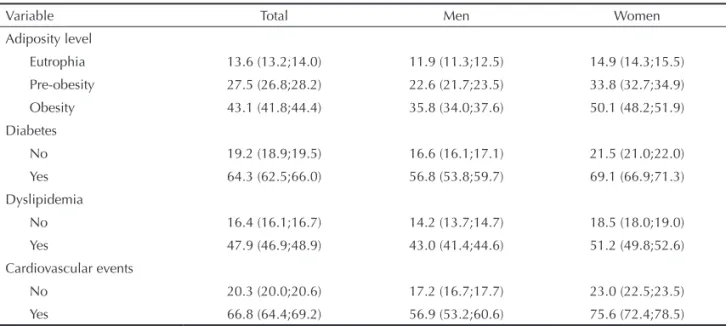
SAH frequency increased as BMI increased, occur-ring in approximately half of the obese women (Table 3). The prevalence ratio of SAH between obese and normal weight individuals, independently of the sex, was 3.18 (CI 95% 3.05;3.32) (data not shown).
As for association with other diseases, it was observed that the frequency of SAH was higher among individ-uals who reported diagnosis of DM and dyslipidemia. Similarly, cardiovascular events (myocardial infarc-tion and stroke) were more frequent among individu-als with self-reported SAH (Table 3).
Table 4 shows crude and adjusted OR of SAH. In the block of the behavioral variables, it was verifi ed that the OR of SAH was higher among individuals who
smokers and men who reported excessive consumption of alcohol. On the other hand, this ratio was lower for those who added salt to prepared meals. It was found that there was association of SAH with the variables overweight, DM, dyslipidemia and cardiovascular events. Even after adjustment for other cardiovascu-lar risk factors, like overweight, DM and dyslipidemia (model 3), SAH remained independently associated with the presence of cardiovascular events.
DISCUSSION
The present study estimated that the frequency of self-reported hypertension was 21.6%, being higher
among women (24.4% versus 18.4%), lower in the
North and Central-West regions and higher in the Southeast region. The frequency of hypertension in-creased with age, dein-creased with level of schooling, was higher among black and widowed individuals and lower among singles. The chance of hypertension, ad-justed for confounding variables, was higher for indi-viduals with overweight, diabetes, dyslipidemia and cardiovascular events.
The comparison between SAH frequencies based on self-reported information and those provided by studies with blood pressure measurement shows that the subjects have a high degree of knowledge of their hypertensive state, meaning that the initiatives of health organs and professionals concerning SAH de-tection have produced the desired result. However, knowledge of health status does not imply change in behavior and the present study does not inform the level of blood pressure control of these Brazilians.
Table 3. Standardized frequenciesa of arterial hypertension, stratifi ed by sex according to the presence of self-reported morbidities.
Brazil, 2006. (N=54,369)
Variable Total Men Women
Adiposity level
Eutrophia 13.6 (13.2;14.0) 11.9 (11.3;12.5) 14.9 (14.3;15.5) Pre-obesity 27.5 (26.8;28.2) 22.6 (21.7;23.5) 33.8 (32.7;34.9)
Obesity 43.1 (41.8;44.4) 35.8 (34.0;37.6) 50.1 (48.2;51.9) Diabetes
No 19.2 (18.9;19.5) 16.6 (16.1;17.1) 21.5 (21.0;22.0) Yes 64.3 (62.5;66.0) 56.8 (53.8;59.7) 69.1 (66.9;71.3)
Dyslipidemia
No 16.4 (16.1;16.7) 14.2 (13.7;14.7) 18.5 (18.0;19.0) Yes 47.9 (46.9;48.9) 43.0 (41.4;44.6) 51.2 (49.8;52.6) Cardiovascular events
No 20.3 (20.0;20.6) 17.2 (16.7;17.7) 23.0 (22.5;23.5)
Yes 66.8 (64.4;69.2) 56.9 (53.2;60.6) 75.6 (72.4;78.5)
a Sociodemographic distribution of the sample of VIGITEL adjusted to that of the adult population of each city in the 2000
Table 4. Crude and adjusted odds ratios of arterial hypertension, stratifi ed by sex, according to behavioral characteristics and associated diseases (N=54,369)
Variable Men Women
OR 95% CI OR 95% CI
Behavioral
Active in leisure time
No 1 1
Yes 0.89 0.81;0.96 1.08 1.00;1.17
Model 1 1.06 0.97;1.17 1.20 1.10;1.32
Active walking in leisure
No 1 1
Yes 2.44 2.25;2.65 1.36 1.27;1.45
Model 1 1.48 1.35;1.62 1.22 1.13;1.31
Habit of smoking
Never smoked 1 1
Smoker 1.12 1.03;1.23 0.98 0.90;1.07
Ex-smoker 2.05 1.91;2.21 1.69 1.58;1.81
Model 1
Smoker 0.89 0.81;1.00 0.94 0.85;1.03
Ex-smoker 1.09 1.00;1.18 1.34 1.24;1.45
Alcohol consumption
No 1 1
Yes 0.78 0.72;0.84 0.56 0.50;0.63
Model 1 1.19 1.09;1.29 1.03 0.91;1.16
Addition of salt to meals
No 1 1
Yes, sometimes 1.02 0.95;1.09 0.97 0.92;1.02
Yes 0.69 0.61;0.79 0.51 0.45;0.58
Model 1
Yes, sometimes 0.93 0.86;1.00 0.86 0.80;0.91
Yes 0.67 0.59;0.77 0.66 0.57;0.77
Morbidity Overweight
Eutrophia 1 1
Pre-obesity 2.91 2.72;3.11 2.16 2.01;2.33
Obesity 5.72 5.25;6.24 4.13 3.76;4.54
Model 1
Pre-obesity 1.84 1.70;1.99 1.92 1.78;2.07
Obesity 3.67 3.30;4.08 3.73 3.38;4.10
Model 2
Pre-obesity 1.82 1.67;1.97 1.89 1.75;2.04
Obesity 3.57 3.21;3.97 3.64 3.30;4.01
Diabetes
No 1 1
Yes 6.61 5.84;7.48 8.14 7.33;9.05
Model 1 3.48 3.04;3.99 3.62 3.20;4.08
Model 2 3.37 2.94;3.87 3.56 3.15;4.02
access to the healthcare services and to the diagno-sis of the disease in these regions. The proportion of primary healthcare services per inhabitant is lower in the North and Central-West regions and higher in the
Southeast region,a coinciding with the values of SAH
frequency obtained in these regions of Brazil.
SAH has been pointed as being more frequent among
men up to 50 years of age.7 However, in the present
study, SAH frequency was higher among women, probably because the study deals with self-reported fre-quency, which is compatible with the fact that women attend more the healthcare services, resulting in a high-er proportion of medical diagnoses in this gendhigh-er.8,15,b
The present study confi rmed the increase in SAH
frequency with age, with alarming percentages in younger age groups. Although cross-sectional stud-ies do not allow to establish cause-effect relations, it is reasonable to suppose that this fi nding is due to the increasing role of the weight gain of the Brazilian
population.c The association of SAH with the BMI
categories corroborates this hypothesis. Obesity is
considered a risk factor for SAH5 and its genesis
im-plies environmental factors, such as inadequate di-etary habits and physical inactivity.
Information collected by VIGITEL enabled to inves-tigate some associations between SAH and other vari-ables, which may be of causal nature. Associations
with skin color could represent a genetic predisposi-tion, while the excessive consumption of certain foods
or inactivity might refl ect previous habits that favor
the increase in blood pressure. On the other hand, as-sociations with DM and dyslipidemia might express a
common physiopathological mechanism. Finally, fi
nd-ing a greater chance of cardiovascular events among hypertensive subjects would indicate predisposition to the main complication of SAH: thromboembolic phe-nomena in the atherosclerotic disease.
Results of the present study showed that SAH fre-quency was higher among black individuals, followed by those of mixed-ethnicity, and among subjects with
low level of schooling. Stratifi cation according to
skin color, similarly to the majority of the studies conducted in Brazil, presents some degree of inaccu-racy, and it should be seen with caution. To eliminate
the possible infl uence of the level of schooling on
the frequency of SAH among African descendants, the estimates were adjusted, and the differences re-mained signifi cant. These results confi rmed fi ndings in other populations.13
In relation to physical activity during leisure time, smoking (ex-smokers) and salt consumption, the as-sociations found in the present study were opposed to the ones that would be expected in longitudinal stud-ies. This effect possibly derives from reverse causali-ty, i.e., individuals diagnosed as hypertensive reported
Table 4 continuation
Variable Men Women
OR 95% CI OR 95% CI
Dyslipidemia
No 1 1
Yes 4.58 4.24;4.94 4.63 4.35;4.94
Model 1 3.24 2.98;3.53 2.44 2.27;2.63
Model 2 3.14 2.88;3.41 2.40 2.23;2.58
Cardiovascular events
No 1 1
Yes 6.35 5.46;.39 10.41 8.83;12.28
Model 1 3.86 3.24;4.61 5.78 4.78;6.99
Model 2 3.89 3.25;4.66 6.05 4.99;7.33
Model 3 3.30 2.73;4 5.11 4.15;6.31
Model 1: OR adjusted for: age, skin color, level of schooling and marital status
Model 2: model 1 plus adjustments for walking during leisure time, habit of smoking, excessive alcohol consumption and addition of salt.
Model 3: model 1 plus model 2 plus adjustment for overweight, diabetes and dyslipidemia.
a Ministério da Saúde. Saúde Brasil 2006: uma análise da desigualdade em saúde. Brasília; 2006 [cited 2009 Oct 01]. Available from: http:// portal.saude.gov.br/portal/arquivos/pdf/saude_brasil_2006.pdf
b Centers for Disease Control and Prevention. National Center for Health Statistics. National Health and Nutrition Examination Survey. Hyattsville; 2008 [cited 2008 Jan 20]. Available from: http://www.cdc.gov/nchs/about/major/nhanes/nh3data.htm
more frequently that they practice exercises, stopped smoking and reduced the amount of salt added to
pre-pared meals. This fi nding may refl ect effective
com-munication about the importance of improving life habits in order to minimize the cardiovascular risk.
As for alcohol consumption, the hypothesis of reverse causality remained for the female sex, but not for the men. In this sense, it is possible that women are more compliant than men regarding changes in life habits.
In the present study, SAH was associated with DM and dyslipidemia. These three diseases are among the
main cardiovascular risk factors. Therefore, fi nding
that hypertensive individuals presented higher fre-quency of myocardial infarction and cerebrovascular
disease was expected, confi rming results of studies
conducted in Brazil and in other countries.2,6,9,15
Despite the limitations deriving from self-reported morbidity data, self-reported SAH has proved to be an adequate indicator to estimate its frequency in popula-tions, with the advantage that the information is quick-ly obtained at a low cost.8,a Another criticism regard-ing the use of self-reported morbidity is related to the infl uence of the access to the medical services; there-fore, it may be underestimated. However, the SAH frequency observed in the present study (21.6%) was close to those obtained in prevalence studies involving
blood pressure measures4,13 and was similar to the one
observed in the 2003 national survey, which also used self-reported information.b On the other hand, it is also
found in the literature a percentage of self-reported SAH that is higher than the one found in the present study, which can be attributed, at least in part, to the
higher mean age of the studied population.16
Another limitation of this study is the representative-ness of the sample, which is restricted to individuals who own a fi xed telephone line. The frequency of fi xed telephone line varies across Brazil’s regions (40% to 85%), being lower in the Northeast region and higher
in the Southeast region.10,c However, this bias was
minimized through the utilization of expansion factors to represent the overall adult population of the studied cities, according to the sociodemographic distribution of the 2000 census.
Another limitation was the utilization of self-reported weight and height for the BMI calculation;
neverthe-less, studies have confi rmed the validity of this kind
of measure.3,12
In conclusion, 21.6% of the Brazilian population of the cities included in VIGITEL reported suffering from SAH. VIGITEL proved to be a useful tool in the monitoring of this disease and of its associated
factors. The high frequencies of modifi able risk
fac-tors reveal potential intervention targets, aiming at the prevention and control of SAH. The continuity of data collection about SAH by the VIGITEL system will enable to assess trends and to provide subsidies to evaluate the impact of detection and intervention public policies on SAH.
a Centers for Disease Control and Prevention. National Center for Health Statistics. National Health and Nutrition Examination Survey. Hyattsville; 2008 [cited 2008 Jan 20]. Available from: http://www.cdc.gov/nchs/about/major/nhanes/nh3data.htm
b Ministério da Saúde. Instituto Nacional de Câncer. Coordenação de Prevenção e Vigilância. Inquérito domiciliar sobre comportamentos de risco e morbidade referida de doenças e agravos não transmissíveis: Brasil, 15 capitais e Distrito Federal, 2002-2003. Rio de Janeiro, 2004[cited 2009 Oct 01]. Available from: http://bvssp.icict.fi ocruz.br/lildbi/docsonline/0/1/410-inquerito_comportamentos.pdf
This article underwent the peer review process adopted for any other manuscript submitted to this journal, with anonymity guaranteed for both authors and reviewers. Editors and reviewers declare that there are no confl icts of interest that could affect their judgment with respect to this article.
The authors declare that there are no confl icts of interest. 1. Balu S, Thomas J 3rd. Incremental expenditure
of treating hypertension in the United States. Am J Hypertens. 2006;19(8):810-6. DOI:10.1016/j. amjhyper.2005.12.013
2. Barreto SM, Passos VM, Firmo JO, Guerra HL, Vidigal PG, Lima-Costa MF. Hypertension and clustering of cardiovascular risk factors in a community in Southeast Brazil. The Bambui Health and Ageing Study. Arq Bras Cardiol. 2000;77(6):576-81. DOI:10.1590/S0066-782X2001001200008
3. Fonseca M de J, Faerstein E, Chor D, Lopes CS. Validade de peso e estatura informados e índice de massa corporal: estudo pró-saúde. Rev Saude Publica. 2004;38(3):392-8. DOI:10.1590/S0034-89102004000300009
4. Fuchs FD, Moreira LB, Moraes RS, Bredemeier M, Cardozo SC. Prevalência de hipertensão arterial sistêmica e fatores associados na região urbana de Porto Alegre. Estudo de base populacional. Populational-based study. Arq Bras Cardiol. 1994;63(6):473-9.
5. Jordan J, Engeli S, Redon J, Sharma AM, Luft FC, Narkiewicz K, et al. European Society of Hypertension Working Group on Obesity: background, aims and perspectives. J Hypertens. 2007;25(4):897-900. DOI:10.1097/HJH.0b013e328051b510
6. Kannel WB. Risk stratifi cation in hypertension: new insights from the Framingham Study. Am J Hypertens. 2000;13(1 Pt 2):3-10. DOI:10.1016/S0895-7061(99)00252-6
7. Kearney PM, Whelton M, Reynolds K, Muntner P, Whelton PK, He J. Global burden of
hypertension: analysis of worldwide data. Lancet. 2005;365(9455):217-23.
8. Lima-Costa MF, Peixoto SV, Firmo JO. Validade da hipertensão arterial autoreferida e seus determinantes (Projeto Bambuí). Rev Saude Publica. 2004;38(5):637-42. DOI:10.1590/S0034-89102004000500004
9. Mancia G, Backer G, Dominiczak A, Cifkova R, Fagard R, Germano G, et al. 2007 Guidelines for the Management of Arterial Hypertension: The Task Force for the Management of Arterial Hypertension of the European Society of Hypertension (ESH) and the European Society of Cardiology (ESC). Eur Heart J. 2007;28(12):1462-536. DOI:10.1093/eurheartj/ehm236
10. Moura EC, Morais Neto OL, Malta DC, Moura L, Silva NN, Bernal R, et al. Vigilância de Fatores de Risco para Doenças Crônicas por Inquérito Telefônico nas capitais dos 26 estados brasileiros e no Distrito Federal (2006). Rev Bras Epidemiol. 2008; 11(Supl.1):20-37 DOI:10.1590/S1415-790X2008000500003
11. Passos VMA, Assis TD, Barreto SM. Hipertensão arterial no Brasil: estimativa de prevalência a partir de estudos de base populacional. Epidemiol Serv Saude. 2006;15(1):35-45.
12. Peixoto MR, Benício MH, Jardim PC. Validade do peso e da altura auto-referidos: o estudo de Goiânia. Rev Saude Publica. 2006;40(6):1065-72. DOI:10.1590/ S0034-89102006000700015
13. Piccini RX, Victora CG. Hipertensão arterial sistêmica em área urbana no sul do Brasil: prevalência e fatores de risco. Rev Saude Publica. 1994;28(4):261-7. DOI:10.1590/S0034-89101994000400004
14. Ribeiro AB, Plavnik FL. Atualização em Hipertensão Arterial – Clínica, Diagnóstica e Terapêutica. São Paulo: Atheneu; 2007.
15. Silva LC, Ordúñez P, Paz Rodríguez M, Robles S. Metodología para valorar la utilidad de estudios de prevalencia realizados con miras a la vigilancia: el ejemplo de la hipertensión. Rev Panam Salud Publica. 2001;10(3):152-60. DOI:10.1590/S1020-49892001000900002
16. Sparrenberger F, Fuchs SC, Moreira LB, Fuchs FD. Stressful life events and current psychological distress are associated with self-reported hypertension but not with true hypertension: results from a cross-sectional population-based study. BMC Public Health. 2008;8:357. DOI:10.1186/1471-2458-8-357
17. Vargas CM, Burt VL, Gillum RF, Pamuk ER. Validity of self-reported hypertension in the National Health and Nutrition Examination Survey III, 1988-1991. Prev Med. 1997;26(5 Pt 1):678-85. DOI:10.1006/pmed.1997.0190
18. World Health Organization. Global Database on Body Mass Index. Geneva; 2002 [citado 2008 jan 22]. Disponível em: http://www.who.int/bmi/index. jsp?introPage=intro_3.html
19. World Health Organization. The World Health Report 2002: Reducing risks, promoting healthy life. Geneva; 2002 [citado 2008 maio 10]. Disponível em: http:// www.who.int/whr/2002/en/whr02_en.pdf