Printed in Brazil - ©2006 Sociedade Brasileira de Química 0103 - 5053 $6.00+0.00
Article
* e-mail: [email protected]; [email protected]
Optimization of Mobile Phase for Separation of Carbohydrates in Honey by High
Performance Liquid Chromatography using a Mixture Design
Cristiane B. Cano,*,a Maria L. Felsner,b Roy E. Bruns,*,c Jivaldo R. Matosb and Lígia B. Almeida-Muradiand
a
Seção de Bebidas, Instituto Adolfo Lutz, Av. Dr. Arnaldo 355, 01246-902 São Paulo – SP, Brazil
b
Instituto de Química, Universidade de São Paulo, Av. Prof. Lineu Prestes, 748 - Bloco 8, 05508900 São Paulo - SP, Brazil
c
Instituto de Química, Universidade Estadual de Campinas, CP 6154, 13083-970 Campinas – SP, Brazil
d
Faculdade de Ciências Farmacêuticas, Universidade de São Paulo, Av. Prof. Lineu Prestes 580 – Bloco 14, 05508-900 São Paulo – SP, Brazil
Um planejamento de misturas foi usado para otimizar a composição da fase móvel para a separação dos carboidratos em mel por Cromatografia Líquida de Alta Eficiência. Nove fases móveis ternárias de acetonitrila, água e acetato de etila, correspondendo a um planejamento centróide simplex com pontos axiais foram testadas para separar os carboidratos mais freqüentemente encontrados em amostras de mel. Os resultados sugerem que um modelo cúbico especial descreve precisamente as mudanças nas proporções destes solventes na fase móvel próxima a região ótima da separação dos picos. A adição de um terceiro solvente, acetato de etila, à fase móvel binária de água e acetonitrila permitiu uma melhora significativa na separação dos carboidratos que pode ser aplicada à análise quantitativa destes compostos em mel.
A mixture design was used to optimize the mobile phase composition for separation of carbohydrates in honey by High Performance Liquid Chromatography. Nine ternary acetronitrile, water and ethyl acetate mobile phases corresponding to a simplex centroid design with axial points were test to separate those carbohydrates most frequently encountered in honey samples. The results suggest that a special cubic model accurately describes changes in the proportions of these solvents in the mobile phase close to the region of optimal peak separation. The addition of a third solvent, ethyl acetate, to binary mobile phase of water and acetonitrile permitted a significant improvement in carbohydrate separation that can be applied to the quantitative analysis of these compounds in honey.
Keywords: mobile phase optimization, HPLC, carbohydrates, mixture design, honey
Introduction
Honey is an important nutritional product, consisting principally of carbohydrates, water and other compounds.1-3
It is characterized by high contents of monossacharides such as glucose (23-38%) and fructose (32-40%). However, the presence and proportions of several di- and trissacharides, like sucrose, turanose, maltose, isomaltose, trehalose, erlose, melizitose and raffinose, all in less than 10%, vary considerably in honeys from different floral sources.1,4-14
The carbohydrates in honey are normally separated by high performance liquid chromatography (HPLC) using special columns with substrates such as amines bound to silica and mobile phase made up of binary mixtures of acetonitrile and water with refractive index detector.9,15-20
Many methods have been developed to optimize chromatographic parameters (mobile phase composition, column length, temperature and composition of stationary phase).21-26 The optimization of the mobile phase to
improve separation in HPLC can be done using multivariate statistical designs.21-23,26-29 One of the most
commonly used methods is presented by Glajch et al.30
This method is based on modeling retention time and resolution of the seven chromatograms corresponding to simplex centroid design by a second order polynomial in three mobile phase solvent proportions. Here similar statistical mixture designs are used to improve the quality of HPLC-RI peak separation for carbohydrates commonly present in honey samples.
Experimental
Chemicals and reagents
The carbohydrate standards (glucose, fructose, ribose, xylose, arabinose, mannose, galactose, sucrose, melibiose, maltose, trehalose, turanose, erlose and melizitose) were acquired from Sigma (St. Louis, MO, USA). The organic solvents used in the mobile phase, HPLC grade, acetonitrile and ethyl acetate, were obtained from EM Science (Gibbstown, NJ, USA) and ultrapure water was produced by the Millipore Milli-Q System (Bedford, MA, USA).
HPLC system
The liquid chromatograph used was purchased from Shimadzu. The apparatus consisted of a pump module LC-10A, a degasser DGU-12A, an oven CTO-LC-10A, a refractive index detector RID-10A, and chromatography data station CLASS-LC10 software Version 1.61.Shimadzu.
Chromatographic conditions
HPLC separation was performed on a 15 cm x 4.5 mm, i.d., stainless steel column packed with NH2 (aminopropyl) stationary phase (5µm spherical particles) Shim-pack-NH2 (M) and a 4.0 cm x 10 mm guard column with the same stationary phase, both from Shimadzu. The column was thermostatted at 32 ºC during all experiments. The flow rate of the mobile phase was 1.2 mL min-1. Solvents were filtered with membrane HA and
FP Millipore (20 µm, φ = 47 cm), sonicated for 20 min, degassed with Helium gas and on-line degasser during all experiments. Sample injections (20 µL) were made using a loop injection valve. Detection was performed at 35.5 ºC with a refractive index detector. All chromatographic data were obtained using CLASS-LC10 software Data Station.
Standard preparation
Carbohydrate standard solutions were prepared in ultra pure water. The standard solutions were sonicated for 15 min at ambient temperature and it was filtered through Hv millex (0.45 µm) membrane (Millipore) in 2.0 mL vials.
Mixture design study
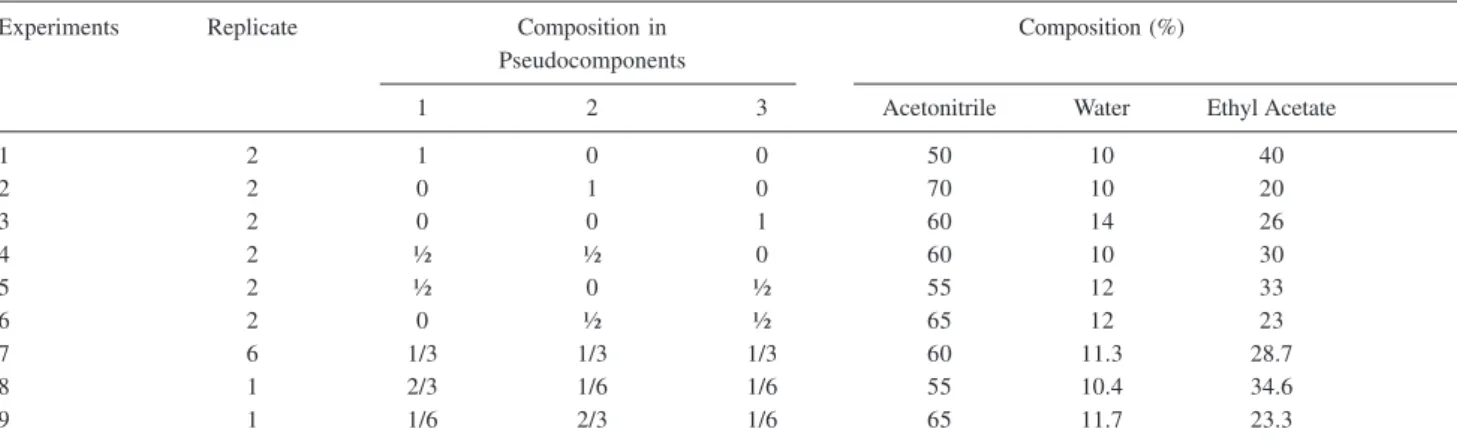
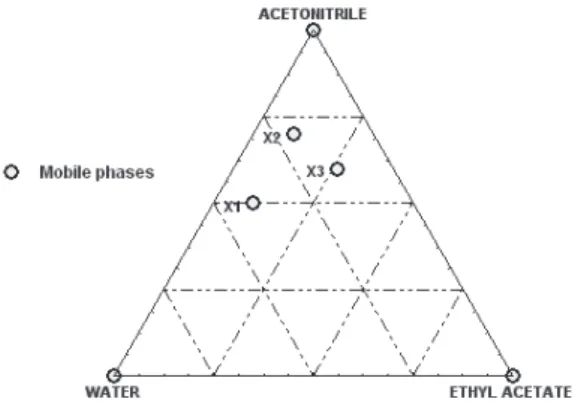
A simplex centroid design with axial points in a pseudocomponent representation was generated from the pure mixture components, acetonitrile, water and ethyl acetate. The pseudo-components are given by X1 (50:10:40), X2 (70:10:20) and X3 (60:14:26) proportions of acetonitrile, water and ethyl acetate, respectively, and are shown in Figure 1. Additional binary and ternary combinations of these pseudocomponents were prepared as shown in Table 1.31-33
Table 1. Solvent compositions used in the mixture design
Experiments Replicate Composition in Composition (%)
Pseudocomponents
1 2 3 Acetonitrile Water Ethyl Acetate
1 2 1 0 0 50 10 40
2 2 0 1 0 70 10 20
3 2 0 0 1 60 14 26
4 2 ½ ½ 0 60 10 30
5 2 ½ 0 ½ 55 12 33
6 2 0 ½ ½ 65 12 23
7 6 1/3 1/3 1/3 60 11.3 28.7
8 1 2/3 1/6 1/6 55 10.4 34.6
Statistical analysis
Chromatographic response functions, ΠRs and COF, defined later and here represented by y were used to adjust linear, quadratic and special cubic models in the pseudocomponent proportions, xi (equation 1)
yi=b1X1+b2X2+b3X3+b12X1X2+b13X1X3+b23X2X3+b123X1X2X3 (1)
The bi (i= 1, 2 and 3) represent linear blending effects between the pseudocomponents whereas the bij (i,j = 1,2,3;
i ≠ j) are interpreted as binary synergic and antagonistic interactions. The bijkcoefficient describes a ternary interaction effect between all pseudocomponents. An Analysis of Variance (ANOVA) was performed to test for lack of fit and model significance as recommended by Cornell31 and Barros
Neto et al.33 The actual calculations were carried out using
the Statistica and Statistica Industrial System.34
Results and Discussion
To improve the HPLC-RI peak separation of the complex carbohydrate mixture present in honey samples, a third solvent, ethyl acetate, was added to the binary acetonitrile – water mixture normally used for this purpose. Ethyl acetate was chosen as the additional solvent since its selectivity is close to that of acetonitrile (group VI) by Snyder.22 The solvent strength that characterizes the isocratic
ternary mixtures tested was adjusted obtaining k’ values in the acceptable retention range of 0.5 < k’ < 20.22,24,25,30
To optimize the mobile phase composition a simplex centroid design with axial points was used. The design permits the determination of linear, quadratic and special cubic models. One of the axial points of our original design (1/6, 1/6, 2/3) was not tested since previous analysis with this ternary mixture of solvents suggested that it was necessary to restrict the proportion
of these solvents to avoid problems of miscibility.31,33
This way the experiments in Table 1 were used to construct models and test their lack of fit and statistical significance levels.
Two chromatographic functions were adopted to evaluate peak separation quality and model analysis, the
ΠRs function proposed by Schoenmakers et al.25 and
Drouen et al.24 and the COF defined por Glajch
et al.30
In optimization studies these response functions are adequate to evaluate the quality of peak separation for multicomponent mixtures, since they furnish a unique numerical value to describe the chromatogram of each miscible phase mixture.30 The values of ΠRs and COF
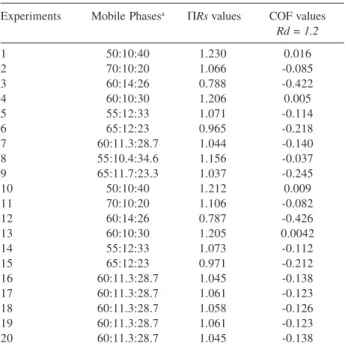
functions for the chromatograms of the nine mixtures and their replicates are given in Table 2.
Optimization of mobile phase of COF and functions
The COF function defined by Glajch et al.30 is given
by equation 2:
(2)
where Ri is the resolution for the i, i+1 pair of adjacent peaks, Rd the desired resolution for each pair of peaks, k
is the number of peak pairs to be resolved (in our case, twelve), B and Ai are weighting factors for each pair of peaks of interest, tMis the maximum acceptable analysis time and tL is the experimental retention time. COF values close to zero are used to indicate the optimal mobile phase compositions.
To obtain significant results and identify the optimal composition of the mobile phase three values of Rd were chosen: 1.2, 1.8 and 2.4. On comparing the three sets of results, no significant differences were found. So only the statistical analysis for the COF data obtained with Rd=1.2 are reported here, Table 2.
The ΠRs values were obtained from equation 3 as proposed by Schoenmakers et al.25 and Drouen et al.:24
(3)
where ki is the capacity factor for the ithpeak, k
i+1is the factor for the next adjacent peak, and n is the number of peaks in the chromatograms. Maximum values of ΠRs
obtained from the chromatograms correspond to optimum compositions of the mobile phases. The ΠRs
values for the nine mobile phases and their replicates were included in Table 2.
Table 2 shows the COF and ΠRs values for the twenty chromatograms of the statistical design applied to the carbohydrate analyses by HPLC.
The COF (Rd= 1.2) and values listed in Table 2 were adjusted to linear, quadratic and special cubic mixture models. Special cubic provided better fits than the other models for both COF and ΠRs data. The ΠRs response function data showed in Table 3 provide a very similar ANOVA to the COF function. The analysis of variance for the special cubic model fitted to the mixture design results is given in Table 3.
These results suggest that both response functions may be used for optimization of the carbohydrate separation. So, in this work only the statistical analysis of COF function was presented. A mean square lack of fit to pure error ratio of 2.63 is not significant when compared with Fcrit table value of 3.98. Furthermore, the regression result for the special cubic model is very significant with mean square regression to residual ratio (Fobs) of 1,024.6 compared to the tabled Fcrit (6.13.0.05) value of 2.92. A normal probability plot (not shown) showed no systematic residual
behavior confirming the statistical quality of the special cubic model. Figure 2 shows a graph of predicted versus observed COF values showing that the special cubic model accurately predicts the COF values. The multiple correlation coefficient of 0.999 confirms the excellent fit of the special cubic model to the mixture design results. An analogous statistical analysis using the values yielded very similar results to the ones for the COF values.
The special cubic model for the COF response functions is shown in the equation 4:
COF1.2= +0.012X1 - 0.086X2 - 0.424X3 + 0.159X1X2 +
(±0.005) (±0.005) (±0.005) (±0.023)
0.372X1X3 + 0.154X2X3 - 1.159X1X2X3 (4) (±0.023) (±0.023) (±0.126)
Standard errors are given in parenthesis below their corresponding coefficients in equation 4. All binary and ternary coefficients are seen to be significant well above the 95% confidence level as are differences between the linear blending coefficients. Figure 3 contains a response surface graph with COF contour curves showing how this response changes with mobile phase composition. Results of the ΠRs function provide almost identical contour line profiles and for this reason are not shown here. Predicted COF values close to zero (and maximum ΠRs values) are found for (50:10:40) and (60:10:30) acetonitrile, water and ethyl acetate (experiments 1 and 4, Table 2), in the region of optimal mobile phase composition.
Table 2. COF and values for the mixture design experiments for the mo-bile phase of the HPLC carbohydrate analysis
Experiments Mobile Phasesa ΠRs values COF values Rd = 1.2
1 50:10:40 1.230 0.016
2 70:10:20 1.066 -0.085
3 60:14:26 0.788 -0.422
4 60:10:30 1.206 0.005
5 55:12:33 1.071 -0.114
6 65:12:23 0.965 -0.218
7 60:11.3:28.7 1.044 -0.140
8 55:10.4:34.6 1.156 -0.037
9 65:11.7:23.3 1.037 -0.245
10 50:10:40 1.212 0.009
11 70:10:20 1.106 -0.082
12 60:14:26 0.787 -0.426
13 60:10:30 1.205 0.0042
14 55:12:33 1.073 -0.112
15 65:12:23 0.971 -0.212
16 60:11.3:28.7 1.045 -0.138
17 60:11.3:28.7 1.061 -0.123
18 60:11.3:28.7 1.058 -0.126
19 60:11.3:28.7 1.061 -0.123
20 60:11.3:28.7 1.045 -0.138
a acetonitrile, water and ethyl acetate, respectively.
Figure 2. Probability graph of observed vs. predicted COF values.
Table 3. Analysis of variance for special cubic model and adjusted to the COF with Rd = 1.2 and response function to the mixture design results reported in Table 2
Variance COF – 1.2 ΠRs
source Fobs p R
2 R2
adj Fobs p R
2 R2
adj
Regression 1,024.57 0.000 0.999 0.997 899.95 0.000 0.999 0.997
Lack of fit 2.634 0.116 2.472 0.129
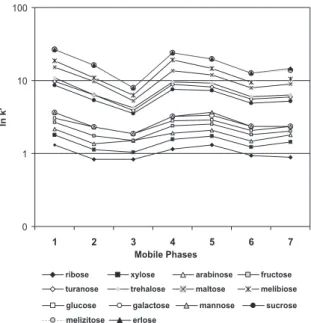
The analysis of the ln k’ of the individual carbohydrates for the mobile phases of the simplex centroid points of the mixture design are shown in Table 2. The results are shown in Figure 4.
The largest values ln k’ are observed on using 50:10:40 (v:v:v) and 60:10:30 (v:v:v) mobile phases. This indicates that besides separating a larger number of carbohydrates these compositions result in a higher quality of peak separation. On the other hand smallest values of the ln k’ were observed for the 60:14:26 (v:v:v) and 65:12:23 (v:v:v) phases. Similar profiles are found for the ΠRs and COF values shown in Table 2 and Figure 4.
It is interesting to note that an increase in the proportion of ethyl acetate in the mobile phase results in an increase in the ΠRs values and decrease in the COF values while
an increase in the water proportion has the opposite effect. This fact could be related to the increase in solvent strength obtained by applying similar proportions of acetronitrile and ethyl acetate, resulting in an increase in the retention time that favors the separation of a larger number of carbohydrates as well as improving the separation quality.22
Owing to the necessity of restricting the solvent proportions, pseudocomponents were very convenient to use and permitted working close to the optimum region. Even though the ΠRs and COF values varied by small amounts in this region, their values are highly correlated and result in predictions of the same optimum mobile phase close to the 50:10:40 (v:v:v) acetronitrile, water, ethyl acetate mixture.
The use of this ternary mixture instead of the acetronitrile and water binary mixture of the HPLC– RI official method allows higher quality of peak separation with more resolved carbohydrate peaks. The co-elution problems for sucrose and turanose and of
Figure 3. Mixture response surface of predicted COF values with Rd = 1.2. The forms of the COF contour curves is almost exactly the same as those for predicted ΠRs values.
Figure 5. Chromatograms of individual carbohydrates by HPLC-RI. (a)-Proposed method with optimum (50:10:40:v:v:v) acetonitrile, water, ethyl acetate mobile phase composition (b) - official method (from reference 8) from Harmonized Methods of European Honey Commission (1997).3-ribose; 4--xylose; 5-arabinose; 6-fructose; 7-glucose; 8- mannose/galac tose; 9-sucrose; 10-turanose; 11-maltose; 12-threalose; 13-melibiose;14-erlose/melizitose. Condition Analysis: Mobile Phase (50:10:40; v:v:v; acetronitrile: water: ethyl acetate). Aminopropyl column - 15 cm x 4.5 mm with temperature of 32 ºC; flux rate 1.2 mL min-1; and refractive index detector temperature of 35.5 ºC.
maltose and trehalose, which occur using the official method, are avoided. However, this ternary mixture does not permit the separation of the mannose and galactose peaks although these peaks are separated from the glucose peak whereas they are severely overlapped using the binary mixture. This can be seen comparing the chromatograms obtained with the 80:20 (v:v) acetronitrile – water binary phase and the 50:10:40 (v:v:v) acetronitrile, water, ethyl acetate ternary mobile phase shown in Figure 5 (a and b).
Conclusions
The results of mixture design permitted to determine the region close to the optimum mobile phase composition. The addition of ethyl acetate to the binary acetronitrile-water mobile phase increases the solvent strength and improves the quality of the peak separations in carbohydrates mixtures. A mobile phase 50:10:40 (v:v:v) acetronitrile, water, ethyl acetate ternary mixture is recommended for the separation of carbohydrate peaks in honey samples.
References
1. Anklam, E.;Food Chem.1998, 63, 549.
2. Crane, E.; Honey: A Comprehensive Survey, Heinemann: London, 1975.
3. Crane, E.; Bees and beekeeping: Sciences Practice and World Resources, Cornell University Press: New York, 1990. 4. Costa Leite, J.M.; Trugo, L.C.; Costa, L.S.M.; Quinteiro,
L.M.C.; Barth, O.M.; Dutra, V.M.L.; de Maria, C.A.B.; Food
Chem.2000, 70, 93.
5. Low, N.H.; Nelson, D. L.; Sporns, P.; J. Apic. Res.1988, 27, 245.
6. Low, N.H.; Sporns, P.; J. Food Sci. 1988, 53, 558.
7. Mateo, R.; Bosch-Reig, F.; J. Agric. Food Chem.1998, 46, 393.
8. Bogdanov, S.; Martin, P.; Lullman, C.; Apidologie 1997, Special Issue, 1.
9. Bogdanov, S.; Vit, P.; Kllchenmann, V.; Apidologie1996, 27, 445.
10. Goodall, I.; Dennis, M. J.; Parker, I.; Sharman, M.; J. Chromatogr. A. 1995, 706, 353.
11. Corradini, C.; Canali, G.; Cogliandro, E.; Nicoletti, I.J.; J. Chromatogr. A. 1997, 791, 343.
12. Sabatini, G.; Persano, L.; Piazza, M.; Accorti, M.; Nanetti, A.; Apicoltura1989, 5, 35.
13. Swallow, K.W.; Low, N.H.; J. AOAC Int.1994, 77, 695. 14. Swallow, K.W.; Low, N.H.; J. Agric. Food Chem. 1990, 38,
1828.
15. Serra, J.; Ventura, F.; J. Agric. Food Chem.1995, 43, 2053. 16. Khadem, H.S.; Carbohydrates Chemistry: Monossacharides
and their Oligomers, Academic Press: London, 1988. 17. Macrae, R.; HPLC in Food Analysis, Academic Press:
London,1982.
18. Birch, G.G.; Analysis of Food Carbohydrates, Elsevier: London,1985.
19. Honda, S.; Anal. Biochem.1984, 140, 1. 20. Fóldhazi, G.; Acta Alimentaria1994, 23, 299.
21. Siouffi, A.M.; Phan–Tan-Luu, R.; J. Chromatogr. A. 2000, 892, 75.
22. Snyder, L.R.; Pratical HPLC Method Development, 2nd ed., John Wiley: New York, 1997.
23. Berrigde, J.C.; Techniques for the Automated Optimization of HPLCSeparations, John Wiley: New York, 1985.
24. Droeun, A.C.J.H.; Billet, H.A.H.; Schoenmakers, P.J.; De Galan, L.; Chromatographia1982, 16, 48.
25. Schoenmarkes, P.J.; Drouen, A.C.J.H.; Billiet, H.A.H.; Galan, L.A.; Chromatographia1982, 15, 688.
26. Klein, E.J.; Riveira, S. L. A.; J. Liq. Chrom. Rel. Tecnol.2000, 23, 2097.
27. Wielinski, S.; Olszanowski, A.; J. Liq. Chrom. Rel. Tecnol.1999, 22, 3115.
28. Matsuada, R.; Hayashi, Y.; Chromatographia1990, 30, 371. 29. Pasadakis, N.; Varotsis, N.; Fuel2000, 79, 1455.
30. Glajch, J.L.; Kirkland, J.J.; Squire, K.M.; J. Chromatogr. 1980, 199, 57.
31. Cornell, J. A.; Experiments with Mixtures: Designs, Models, and the Analysis of Mixture Data, 2nd ed., Wiley: New York, 1990.
32. Khuri, A. I.; Cornell, J. A.; Response Surfaces: Designs and
Analyses, M. Dekker:New York, 1987.
33. Barros Neto, B. de; Scarminio, I.S.; Bruns, R.E.; Como Fazer
Experimentos, Editora da Unicamp:Campinas, Brazil, 2002. 34.STATSOFT INC., Statistica for Windows, Version 6.0, 2300
East 14th Street, Tulsa, OK, 74104, USA, 1998.
Received: June 2, 2005
Published on the web: April 12, 2006