Authors
Denise Sbrissia e Silva Gouveia 1
Alexandre Tortoza Bignelli 2
Silvia Regina Hokazono 2
Itamara Danucalov 2
Tobias August Siemens 2
Fernando Meyer 1,2
Luiz Sergio Santos 2
Ziliane Caetano Lopes Martins 2
Tiago César Mierzwa 1
Raquel Furquim 2
1 Hospital Nossa Senhora
das Graças.
2 Hospital Universitário
Cajuru.
Submitted on: 8/8/2016. Approved on: 9/26/2016.
Correspondence to: Fernando Meyer.
Hospital Universitário Cajuru. Rua Portugal, nº 307, Curitiba, PR, Brazil.
CEP: 80510-280
E-mail: fmeyer@urocentro. com
I
NTRODUCTIONChronic kidney disease (CKD) is a serious public health problem worldwide, and it is considered an “epidemic” of alarming growth. Recent data indicate that 10% of the adult population have some degree of renal dysfunction, and about 70% are unaware of having such disorder.1,2
Analysis of economic impact among modalities of renal
replacement therapy
Análise do impacto econômico entre as modalidades de terapia
renal substitutiva
DOI: 10.5935/0101-2800.20170019
Introduction: Chronic kidney disease
(CKD) is a major health problem, deter-mining the reduction in life expectancy and an increased risk of cardiovascular disease.
Method: An observational, cohort,
ret-rospective, based on patient's medical re-cords data with CKD under hemodialysis, peritoneal dialysis and kidney transplanta-tion in the city of Curitiba, in the period from January to June 2014, evacuativo the financial impact on the Unified Health Sys-tem (SUS) and the supplementary health.
Results: The lowest cost of a kidney
trans-plant in the first year was R$ 40,743.03 when cyclosporine was used and the high-est was R$ 48,388.17 with the use of tacro-limus. In the second year post-transplant, hemodialysis and peritoneal dialysis have a higher cost compared to kidney transplant. Transplantation with deceased donor, treated with tacrolimus: R$ 67,023.39; Hemodialysis R$ 71,717.51 and auto-mated peritoneal dialysis automatic R$ 69,527.03. Conclusions: After the first two
years of renal replacement therapy, trans-plantation demonstrates lower costs to the system when compared to other modalities evaluated. Based on that, this therapy justi-fies improvements in government policies in this sector.
ABSTRACT
Keywords: kidney transplantation; renal di-alysis; renal insufficiency, chronic; suppple-mentary health; Unified Health System.
Introdução: A doença renal crônica
(DRC) é um grande problema de saúde, determina redução na expectativa de vida e aumento dos riscos de doenças cardio-vasculares. Método: Estudo observacio-nal, de coorte, retrospectivo, baseado em dados de prontuários de pacientes com DRC em hemodiálise, diálise peritoneal e transplante renal na cidade de Curitiba, no período de janeiro a junho de 2014, avaliando o impacto financeiro no Siste-ma Único de Saúde (SUS) e na saúde su-plementar. Resultados: O menor custo de um transplante renal no primeiro ano foi de R$ 40.743,03, quando utilizada a ci-closporina, e o maior de R$ 48.388,17, com a utilização do tacrolimo. Já no se-gundo ano pós-transplante, a hemodi-álise e a dihemodi-álise peritoneal têm valor su-perior ao transplante renal. Transplante com doador falecido, com tacrolimo: R$ 67.023,39; hemodiálise R$ 71.717,51 e diálise peritoneal automática R$ 69.527,03. Conclusões: Após os dois pri-meiros anos da terapia renal substitutiva, o transplante demonstra menores custos ao sistema, quando comparado às outras modalidades avaliadas. Baseado nisso, esta terapia justifica melhorias nas políti-cas governamentais nesse setor.
R
ESUMOPalavras-chave: diálise renal; insuficiência renal crônica; saúde suplementar; Sistema Único de Saúde; transplante de rim.
have diabetes mellitus, 18% are smokers and 50% are overweight. The most alarming CKD outcomes are early mortality from cardiovascular disease and progression to chronic end-stage renal disease, and a need for RRT.4
RRT consists of hemodialysis, peritoneal dialysis and transplantation. In Brazil, current data indicate that more than 100,000 people are dependent on this therapy, and 30% are over 65 years of age. Still, according to data from the Brazilian Society of Nephrology (SBN), around 90% of the patients are on hemodialysis, with 85% of this treatment being financed by the Public Healthcare System (SUS), with an estimated annual expenditure of R$ 2.2 billion.5
Despite treatment, the mortality of these patients is around 15% per year, being higher upon treatment onset due to the late diagnosis. Thus, early diagnosis is essential.6
The SBN has been working with the Ministry of Health to add CKD to healthcare programs, with the goals of stimulating and supporting the adoption of effective measures regarding surveillance, prevention, treatment and control for this disease.5
Thus, the present study aims to evaluate the costs of renal transplantation in the Public Healthcare System (SUS) and in the supplementary healthcare system (SHC) through the analysis of hospital bills, comparing costs associated with RRT modalities, in order to justify renal transplantation as a cost-effective treatment modality, and to stress its importance as a RRT, as well as to characterize the precariousness of an effective system of reimbursement of renal transplant procedures in the SHC, creating a basis for proposing negotiations with the HMOs.
M
ETHODSThis study adopts the cost-procedure analysis to evaluate renal replacement therapy interventions for CKD (hemodialysis, peritoneal dialysis and renal transplantation), as well as its impact on the SUS and SHC. It is an observational, cohort, retrospective study based on data from patients’ records of referral services in renal transplantation, hemodialysis (in the hospital setting) and peritoneal dialysis, in the city of Curitiba, PR, from January to June 2014. The values were extrapolated to annuals, since there is no price raise policy based on a given period or inflation.
Healthcare cost assessments were not based on the values of the procedures, because they did not capture all the variables relevant to CKD. We also considered
the hospitalizations related to the underlying disease and the RRT mode in question, as well as the use of medications needed for treatment maintenance.
The analysis of this study adopts the perspectives of the SUS and the SHC. Thus, only direct costs are included in this model, inferring hospitalization data and medication. The comparative analysis of RRT modalities is descriptive statistical data.
The costs associated with renal transplantation were divided into two categories. The first concerns the cost of the transplant itself, which consists of the surgical procedure for both the donor and the recipient. For this, we used the SUS procedures cost spreadsheet (Table 1). Payment is made by procedure, varying whether the donor is alive or deceased. The number of medical visits, examinations, hospitalizations and prescribed medications - especially immunosuppressants, were factored in. In this study, no costs were recorded for the donation of deceased donor organ and/or for the nephroureterectomy of the living donor. However, we added 30% increase applied to isolated kidney transplantation services, using data from results from every two years.
Kidney transplant (organ from deceased donor)
Values
Hospital Care: R$ 19,333.11
Medical Care: R$ 8,289.56 Total Hospital Cost: R$ 27,622.67
Kidney transplant (live donor organ)
Values
Hospital Care: R$ 14,865.05 Medical Care: R$ 6,373.77 Total Hospital Cost: R$ 21,238.82 TABLE 1 COSTOFRENALTRANSPLANTATIONFROM
LIVINGANDDECEASEDDONORSINTHE SUS
Ordinance No. 436, dated November 14, 2000, provides for the medical procedures paid by the SUS regarding the monitoring of patients over time. In the first year of transplantation, the Public Health Care system allows monthly payments for post-transplant patient follow-up visits, through the Authorization for High Cost/Complexity Procedures (APAC). In the following years, this billing happens every two months.
consultation per month. The cost of introducing an intravenous catheter was also included (about 70% of patients are unaware of the disease and have the option of placing a temporary catheter, called double or triple lumen catheter, to start hemodialysis) and an arteriovenous fistula - the first route in patients who already have knowledge of the disease and its evolution, since it is the best option of access for hemodialysis. The arteriovenous fistula requires, after its preparation, approximately 40 days of maturation for use.
The costs related to peritoneal dialysis were differentiated as being continuous or automatic. We considered a monthly medical consultation per patient and the cost of intraperitoneal catheter implantation.
The costs of medications and hospitalizations were also estimated. Obtaining prices for hemodialysis and peritoneal dialysis followed the same routine as that used for transplants.
R
ESULTSA hemodialysis unit is paid for the sessions performed on end-stage CKD patients. These patients usually attend clinics three times a week, at pre-scheduled periods, being universal on Mondays, Wednesdays and Fridays or on Tuesdays, Thursdays and Saturdays.
This is the pattern followed by virtually the entire industry. Eventually, patients miss sessions or perform fewer weekly sessions depending on their residual kidney function. They can also be submitted to more sessions for shorter periods, to adjust the treatment, regardless of whether they belong to the SUS or SHC. In this way, the average number of sessions of a dialysis treatment unit is 11 to 14 monthly sessions.
Peritoneal dialysis clinics are paid a monthly income per patient, regardless of the number of peritoneal changes, varying only in the modality: continuous outpatient peritoneal dialysis (CPD) and automatic peritoneal dialysis (APD).
All proposed treatments have direct and indirect costs in their maintenance phase, regarding hospitalizations, directly related to the underlying disease, current treatment and morbidities associated with the use of high cost medications inherent to each treatment. It is evident that all the values attributed to the treatment of RRT are considered as a source of revenue for clinics, and represent expenditures for the SUS or SHC.
Initially, we present data collected from a hemodialysis clinic inside a hospital. Updated metrics
indicate a mortality rate of 10.85%; hospitalization rate of 3.3 patients/month - 78.78% for infectious reasons and 12.12% related to cardiovascular disease; the rate of patients leaving the program is 18%, because of: 46% deaths, 25% transplants, 28% migration to the peritoneal modality.
The patients were divided into SUS and SHC, and the SUS were further divided into HIV seropositive and seronegative patients. In HIV-negative patients, the annual sessions totaled R$ 25,780.32. These values, as well as the others described, are in agreement with the basic pay, without increment, referenced by the SIGTAP table (Table of Procedures Management System, Medications and OPM of SUS) (Table 2).
Hemodialysis (maximum of 3 sessions per week)
High Complexity: FAEC fund Maximum 14/month
Outpatient Care: R$ 179.03
Hemodialysis in HIV patients (maximum of 3 sessions per week)
Outpatient Care: R$ 265.41 TABLE 2 COSTPERHEMODIALYSISSESSIONINTHE
SUS
Laboratory costs totaled R$ 539.76 per year. Annual values with medications (Table 3) are around R$ 7,829.89 (this value makes up a standard basic package of medications common to end-stage chronic renal disease in hemodialysis, considering the use of iron saccharate, erythropoietin, calcium carbonate, Calcitriol and sevelamer). The total value could be much higher if the patient were to use paracalcitol as an alternative for bone renal disease and it would be a little lower if the use of any of the mentioned drugs was disregarded.
Additionally, venous access (considered a central puncture with placement of a double lumen catheter and, subsequently, the creation of an arteriovenous fistula) was considered. The total mean values were R $ 817.57 per procedure. However, this value does not predict failures both in the placement of temporary (double lumen catheter) or permanent (fistula) access.
Hemodialysis Mean dose % patient in use Individual cost Year total
Iron saccharate 100 mg 2 vials/month 91.20% 3.72/vial R$ 89.28 Erythropoietin 1,000 UI 14,000 UI/week 96.70% 4.17/vial R$ 3,035.76 Calcium carbonate 500 mg 9 pills/day 93.40% 0.08/pill R$ 262.80 Calcitriol 0.25 mcg/pill 1 pill/day 43.00% 0.29/pill R$ 105.85 Sevelamer 800 mg 6 pills/day 72% 1.98/pill R$ 4,336.20 Paracalcitol 5 mcg/ml 3 vials/week 1.3% 48.62/vial R$ 7,584.72 TABLE 3 COMMONLYUSEDMEDICATIONSINHEMODIALYSIS
Thus, the annual total expenses with a non-HIV hemodialysis patient was R$ 36,267.54 on average. The HIV-positive patient presented a cost difference of R$ 12,270.68 in sessions, with the cost per session being of R$ 265.41; the laboratory having a cost of R$ 372.12, of which the monthly mean value is of R$ 31.01. The other costs: medications, accesses, consultations and hospitalizations were considered similar to those from HIV-negative patients. Therefore, the total expenses with one HIV patient, in hemodialysis, in the first year were R$ 48,538.22. In both types of patients, HIV-positive or HIV-negative, the venous access was deducted as of the second year of treatment (Tables 4 and 5).
The dialysis patients from the SHC belong to the Unimed Curitiba and Unimed Intercâmbio HMOs, had mean costs of R$ 47,877.12 in one year. The estimated annual cost in tests was R$ 1,158.00. The drugs used were the same as those described in Tables 3 and 4, totaling R$ 7,829.89/year. The cost of a double lumen catheter implant and, subsequently, the making of an arteriovenous fistula, was R$ 897.00. Nephrologist consultations and fees, per session, were R$ 60.00 (totaling R$ 8,640.00 in the year). The average cost of hospitalization was approximately R$ 3,865.41. Adding up the entire process, the first year in hemodialysis of a patient with the standard healthcare plan totaled R$ 70,267.42. From the second year, venous access was subtracted, totaling R$ 69,370.42.
The peritoneal dialysis modality, represented by a unit with a total of 179 patients, presented the following updated indicators: mortality rate of 11.4%; rate of exit of the program of 18%, being 46% death, 25% transplantation and 28% migration to modality hemodialysis.
The annual values paid by SUS, on average, for each patient in CPD was R$ 21,498.72. To this value, R$ 549.75 was added, referring to the catheter implant. The annual cost of the tests was R$ 607.76
and for medications it was R$ 4,642.30 (a calculation consisting of a standard basic package of the usual medications prescribed for end-stage chronic renal disease in dialysis - the use of Iron, erythropoietin, calcium carbonate, calcitriol and sevelamer at standard doses was considered in most patients, similar to hemodialysis patients) (Table 6).
The annual cost in consultations with a nephrologist totaled R$ 660.00. In relation to hospitalization, the average value was R$ 464.86. Finally, the annual cost of a patient in the CPD modality, for the SUS, was R$ 28,423.39. From the second year (disregarding the catheter implant already performed the first year), the value was R$ 27,873.64.
The patient in APD had an annual cost of R$ 28,113.72. The mean costs of tests, medications, peritoneal access, consultations and hospitalizations were similar to those from patients in CPD. Thus, the annual cost of a SUS patient in APD was R$ 35,038.39 and R$ 34,488.64, in the first and second years, respectively. This difference was due to the catheter implantation required in the first year.
The annual amount paid by the reference HMO plan was R$ 45,796.92 for CPD and R$ 56,417.16 for APD. In both modalities, the annual cost of tests totaled R$ 1,382.00 and R$ 4,642.30 in medicines. The peritoneal catheter implant had a cost of R$ 793.00. Annual costs in consultations totaled R$ 5,184.00. The average cost of hospitalization was R$ 2,324.31. Accordingly, the annual cost, for the reference HMO healthcare plan, for the CPD modality was R$ 60,123.33 and for APD it was R$ 70,743.57. From the second year, the costs related to the peritoneal catheter implantation were subtracted, totaling R$ 59,329.53 for CPD and R$ 69,949.77 for APD (Tables 7 and 8).
HD SUS
HD SS
HIV - HIV +
Sessions R$ 25,780.32 R$ 38,219.04 R$ 47,877.12
Tests R$ 539.76 R$ 372.12 R$ 1,158.00
Medication R$ 7,829.89 R$ 7,829.89 R$ 7,829.89
Vascular access R$ 817.57 R$ 817.17 R$ 897.00
Medical visits R$ 120.00 R$ 120.00 R$ 8,640.00
Hospitalization R$ 1,180.00 R$ 1,180.00 R$ 3,865.41
Total R$ 36,267.54 R$ 48,538.22 R$ 70,267.42
TABLE 4 HEMODIALYSISTREATMENTCOSTINTHE 1STYEAR
HD SUS: hemodialysis patients treated in the Public Healthcare System (SUS); HD SHC: hemodialysis patients treated in the supplementary healthcare system.
HD SUS
HD SHC
HIV - HIV +
Sessions R$ 25,780.32 R$ 38,219.04 R$ 47,877.12
Tests R$ 539.76 R$ 372.12 R$ 1,158.00
Medications R$ 7,829.89 R$ 7,829.89 R$ 7,829.89
Vascular access
Medical visits R$ 120.00 R$ 120.00 R$ 8,640.00
Hospitalização R$ 1,180.00 R$ 1,180.00 R$ 3,865.41
Total R$ 35,449.97 R$ 47,721.05 R$ 69,370.42
TABLE 5 HEMODIALYSISTREATMENTCOSTINTHE 2NDYEAR
HD SUS: pacientes em hemodiálise tratados no Sistema Único de Saúde; HD SS: pacientes em hemodiálise tratados na Saúde Suplementar.
Peritoneal dialysis Mean dose % pat. In use Individual cost Year total
Iron saccharate 100 mg 1 vial/month 84% 3.72/vial R$ 44.64 Erythropoietin 1,000 UI 4,000 UI/week 81% 4.17/vial R$ 867.36 Calcitriol 0.25 mcg/pill 1 pill/day 42% 0.08/pill R$ 204.40 Calcium carbonate 500 mg 6 pills/day 95.40% 0.29/pill R$ 635.10 Sevelamer 800 mg 4 pills/day 80.20% 1.98/pill R$ 2,890.80 Paracalcitol 5 mcg/day 3 vials/week 2.20% 48.62/pill R$ 7,584.72 TABLE 6 COMMONLYUSEDMEDICATIONINPERITONEALDIALYSIS
high-cost induction drugs and procedures performed), distributed as follows: total number of transplants belonging to the SUS was 21 - 12 from deceased donors and 9 from live donors. In addition, five transplants from living donors belonging to the SHC were also reported.
As for the SUS transplants from live donors, the mean hospitalization time was 10 days. The total amount of revenues was R$ 251,914.64, with an average of R$ 27,914.96 per transplant. The mean number of hospitalizations from procedures using cadaveric donors was also 10 days, with a total cost of R$ 357,035.43 (average of R$ 29,752.95 per transplant). In the SHC, the total cost was R$ 77,178.17 (average of R$ 15,435.63 per transplant),
even with hospitalization time higher than that in the SUS (mean of 13 days) (Table 9).
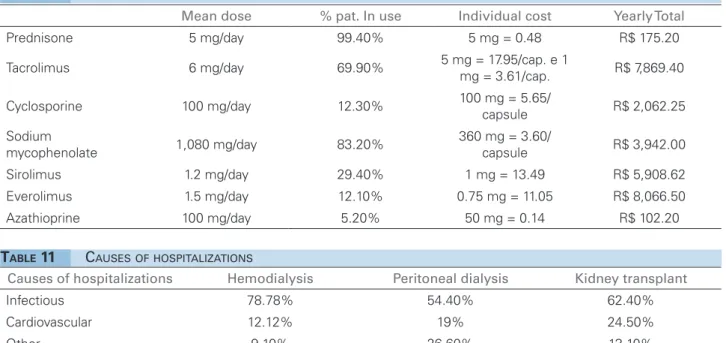
Concerning SUS patients, the average annual cost with tests was R$ 523.00. Regarding the medication, the main cost is related to immunosuppressants, and most renal transplantation centers use triple schemes, with prednisone and sodium mycophenolate (usually of choice) and the third drug varying between tacrolimus or cyclosporine. Alternative schemes may contain sirolimus, everolimus, or azathioprine (Table 10).
DP SUS DP SHC
CPD APD CPD APD
Treatment R$ 21,498.72 R$ 28,113.72 R$ 45,796.92 R$ 56,417.16
Tests R$ 607.76 R$ 607.76 R$ 1,382.00 R$ 1,382.00
Medication R$ 4,642.30 R$ 4,642.30 R$ 4,642.30 R$ 4,642.30 Peritoneal access R$ 549.75 R$ 549.75 R$ 793.80 R$ 793.80 Medical visits R$ 660.00 R$ 660.00 R$ 5,184.00 R$ 5,184.00 Hospitalization R$ 464.86 R$ 464.86 R$ 2,324.31 R$ 2,324.31 Total R$ 28,423.39 R$ 35,038,39 R$ 60,123.33 R$ 70,743.57 TABLE 7 PERITONEALDIALYSISTREATMENTCOSTINTHE 1STYEAR
PD SUS: patients in peritoneal dialysis treated in the public healthcare system; PD SHC: patients in peritoneal dialysis treated in the Supplementary Healthcare System.
PD SUS PD SHC
CPD APD CPD APD
Treatment R$ 21,498.72 R$ 28,113.72 R$ 45,796.92 R$ 56,417.16
Tests R$ 607.76 R$ 607.76 R$ 1,382.00 R$ 1,382.00
Medication R$ 4,642.30 R$ 4,642.30 R$ 4,642.30 R$ 4,642.30 Peritoneal access
Medical visits R$ 660.00 R$ 660.00 R$ 5,184.00 R$ 5,184.00 Hospitalization R$ 464.86 R$ 464.86 R$ 2,324.31 R$ 2,324.31 Total R$ 27,873.64 R$ 34,488.64 R$ 59,329.53 R$ 69,949.77 TABLE 8 PERITONEALDIALYSISTREATMENTCOSTSASOFTHE 2NDYEAR
PD SUS: patients in peritoneal dialysis treated in the public healthcare system; PD SHC: patients in peritoneal dialysis treated in the Supplementary Healthcare System.
DD SUS LD SUS LD SHC
Total number 12 9 5
Mean number of days
hospitalized 10 10 13
Total R$ 357,035.43 R$ 251,234.64 R$ 77,178.17
Mean R$ 29,752.95 R$ 27,914.96 R$ 5,435.43
TABLE 9 COSTPERPATIENTINTRANSPLANT
DD: deceased donor; LD: live donor; SUS: Public Healthcare System; SHC: Supplementary Healthcare.
In the first year, consultations with nephrologists are paid monthly, with most centers passing on a value of R$ 90.00 (this is part of the post-transplant follow-up APAC), totaling R$ 1,080.00 in the year. When hospitalized for post-transplant complications, the total amount paid per day of hospitalization was R$ 134.00 (R$ 34.00 being paid to the nephrology team). The main causes of hospitalizations are listed on Table 11. The mean cost of hospitalization was R$ 5,045.62.
After accounting for all the annual costs, the SUS transplants from a live donor totaled R$ 40,743.03 (when cyclosporine was used as immunosuppressant); R $ 46,550.18 (when tacrolimus was used); R$ 44,589.40 (when mTOR-sirolimus or everolimus inhibitor was used) and R$ 42,710.38 (when using tacrolimus and azathioprine).
The SUS transplants from deceased donors totaled, in the first year: R$ 42,581.02 (with cyclosporine use); R$ 48,427.39 (with tacrolimus); R$ 46,427.39 (with mTOR) and R$ 44,548.37 (with tacrolimus and azathioprine).
The major difference in transplant costs from the second year onwards was the withdrawal of the cost of the surgical procedure and the reduction in office visits. Thus, in the second year, the average cost of living donor and cadaver transplantation was R$ 12,828.07 (when cyclosporine regimens were used); R$ 18,635.22 (with tacrolimus); R$ 16,674.44 (with mTOR) and R$ 14,795.42 (with azathioprine and tacrolimus), respectively.
Mean dose % pat. In use Individual cost Yearly Total
Prednisone 5 mg/day 99.40% 5 mg = 0.48 R$ 175.20
Tacrolimus 6 mg/day 69.90% 5 mg = 17.95/cap. e 1 mg = 3.61/cap. R$ 7,869.40
Cyclosporine 100 mg/day 12.30% 100 mg = 5.65/capsule R$ 2,062.25
Sodium
mycophenolate 1,080 mg/day 83.20%
360 mg = 3.60/
capsule R$ 3,942.00
Sirolimus 1.2 mg/day 29.40% 1 mg = 13.49 R$ 5,908.62
Everolimus 1.5 mg/day 12.10% 0.75 mg = 11.05 R$ 8,066.50
Azathioprine 100 mg/day 5.20% 50 mg = 0.14 R$ 102.20
TABLE 10 MEDICATIONSOFFREQUENTUSEINTRANSPLANT
Causes of hospitalizations Hemodialysis Peritoneal dialysis Kidney transplant
Infectious 78.78% 54.40% 62.40%
Cardiovascular 12.12% 19% 24.50%
Other 9.10% 26.60% 13.10%
TABLE 11 CAUSESOFHOSPITALIZATIONS
cost R$ 1,296.00 in the first year and R$ 390.00 in the second year (considering R$ 65.00 per visit). Medication costs were the same as that in the SUS, since these patients get their immunosuppressive medications from public pharmacies.
The costs of tests averaged R$ 4,523.00/year. The hospitalization average cost was R$ 2,295.00. Considering the immunosuppressive regimens, the total transplantation cost in the reference healthcare plan in the first year was R$ 19,728.88 with cyclosporine; R$ 25,536.03 with tacrolimus; R$ 23,575.25 with mTOR and R$ 21,696.23 with azathioprine and tacrolimus (Table 12). In the second year, the cost was R$ 13,387.45 with cyclosporine; R$ 19,194.60 with tacrolimus; R$ 17,233.82 with mTOR and R$ 15,354.80 with azathioprine and tacrolimus (Tables 12 and 13).
D
ISCUSSIONAccording to the Ministry of Health, in 2008, Brazil spent 3.6% of its GDP (Gross Domestic Product) on public healthcare - this amount is equivalent to almost R$ 109 billion. Factoring in the private healthcare industry (healthcare plans and private expenditures); total healthcare expenditures in Brazil reached 8.4% of the GDP, much lower than the amounts invested by other South American countries.7
According to the Brazilian Society of Nephrology, in 2013, 100,397 patients were on dialysis in Brazil. Most dialysis centers have a contract with the SUS
(98.2%). It is estimated that 47% of patients on dialysis are waiting in the kidney transplant queue and 25-50% of dialysis patients are diabetic. Data from the Brazilian Association of Transplants and Organs (ABTO) estimate that 92% of kidney transplants are reimbursed by SUS. In addition, most of the medicines needed to maintain the different modalities of RRT are paid for by the public healthcare system.8
The complexity of renal replacement therapy makes the costs of hemodialysis higher than the costs of peritoneal dialysis, whether manual or automated (USRDS Annual Data Report, 2013).9
Table 14 compares the various RRT modalities with the total costs at 15, 18 and 24 months. The transplant was represented in its most expensive modality: using tacrolimus.
In patients treated at the SUS, transplantation appears as the highest-cost alternative during the first and part of the second year. However, at the end of the second year, transplantation is consolidated as a less costly alternative for the treatment of CKD. In patients on RRT paid for by the standard healthcare plan, live donor transplantation presents a lower cost as of the first year. Still, at the end of 24 months, it does not even cover the cost of dialysis for the entire first year.
Tx SUS Tx SHC
LD DD LD
Treatment R$ 27,914.96 R$ 29,752.95 R$ 5,435.43
Tests R$ 523.00 R$ 523.00 R$ 4,523.00
Immune with Csa R$ 6,179.45 R$ 6,179.45 R$ 6,179.45
Immune with Fk R$ 11,986.60 R$ 11,986.60 R$ 11,986.60 Immune with Mtor R$ 10,025.82 R$ 10,025.82 R$ 10,025.82 Immunes with Fk + Aza R$ 8,146.80 R$ 8,146.80 R$ 8,146.80
Medical visits R$ 1,080.00 R$ 1,080.00 R$ 1,296.00
Hospitalizations R$ 5,045.62 R$ 5,045.62 R$ 2,295.00 Total tx w/csa R$ 40,743.03 R$ 42,581.02 R$ 19,728.88 Total tx w/fk R$ 46,550.18 R$ 48,388.17 R$ 25,536.03 Total tx w/Mtor R$ 44,589.40 R$ 46,427.39 R$ 23,575.25 Total tx w/FK + Aza R$ 42,710.38 R$ 44,548.37 R$ 21,696.23 TABLE 12 TRANSPLANTCOSTINREFERENCESERVICESINTHE 1STYEAR
Tx: transplant; SUS: Public Healthcare System; SHC: Supplementary Healthcare; Csa: Cyclosporine; Fk: tacrolimus; mTOR: sirolimus or everolimus; Aza: azathioprine.
Tx SUS Tx SHC
LD DD DV
Treatment
Tests R$ 523.00 R$ 523.00 R$ 523.00
Immune with Csa R$ 6,179.45 R$ 6,179.45 R$ 6,179.45
Immune with Fk R$ 11,986.60 R$ 11,986.60 R$ 11,986.60 Immune with Mtor R$ 10,025.82 R$ 10,025.82 R$ 10,025.82 Immune with Fk + Aza R$ 8,146.80 R$ 8,146.80 R$ 8,146.80
Medical visits R$ 540.00 R$ 540.00 R$ 540.00
Hospitalization R$ 5,045.62 R$ 5,045.62 R$ 5,045.62
Total tx w/csa R$ 12,288.07 R$ 12,288.07 R$ 12,288.07 Total tx w/fk R$ 18,095.22 R$ 18,095.22 R$ 18,095.22 Total tx w/Mtor R$ 16,134.44 R$ 16,134.44 R$ 16,134.44 Total tx w/FK + Aza R$ 14,255.42 R$ 14,255.42 R$ 14,255.42 TABLE 13 TRANSPLANTCOSTINREFERENCECLINICSINTHE 2NDYEAR
Tx: transplant; SUS: Public Healthcare System; SHC: Supplementary Healthcare; Csa: Cyclosporine; Fk: tacrolimus; mTOR: sirolimus or everolimus; Aza: azathioprine.
costs of hemodialysis being higher than those for peritoneal dialysis are the costs of supplies, facilities, specialized labor, as well as the impact of expenses with vascular access, medication and hospitalization.
In SHC, the costs of hemodialysis patients are also higher in relation to those in manual peritoneal dialysis, but equivalent to automated peritoneal dialysis.
To maintain the different replacement therapies, numerous medicines are necessary, which increases the financial impact. Many of them are considered strategic or exceptional, being provided by pharmacies of the public healthcare network.
Reliable data on the amounts invested in dialysis drugs in Brazil are not available. However, in 2011, the US healthcare system ‘Medicare’ reported spending $1.69 billion on drugs supplementing dialysis, while for kidney transplantation $315 million were invested in the same period.5
HD PD SUS PD SHC Tx SUS w/Fk Tx SHC w/Fk
SUS SHC CPD APD CPD APD LD DD LD
1st year 36,267.54R$ 70,267.42R$ 28,423.39R$ 35,038.39R$ 60,123.33R$ 70,743.57R$ 46,550.18R$ 48,388.17 R$ 25,536.03 R$
2nd year 35,449.97R$ 69,370.42R$ 27,873.64 R$ 34,488.64R$ 59,329.53R$ 69,949.77R$ 18,635.22R$ 18,635.22 R$ 20,100.60 R$
Monthly 2nd year R$ 2,954.16 R$ 5,780.87 R$ 2,322.80 R$ 2,874.05 R$ 4,944.13 R$ 5,829.15 R$ 1,552.94 R$ 1,552.94 R$ 1,675.05 15 months R$ 45,130.03 R$ 87,610.03 R$ 35,391.80 R$ 43,660.55 R$ 74,955.71 R$ 8,231.01 R$ 51,208.99 R$ 53,046.98 R$ 30,561.18 18 months R$ 53,992.53 R$ 104,952.63 R$ 42,360.21 R$ 52,282.71 R$ 89,788.10 R$ 105,718.46 R$ 55,867.79 R$ 57,705.78 R$ 35,586.33 24 months R$ 71,717.51 R$ 139,637.84 R$ 56,297.03 R$ 69,527.03 R$ 119,452.86 R$ 140,693.34 R$ 65,185.40 R$ 67,023.39 R$ 45,636.63 TABLE 14 COMPARINGTOTALEXPENDITURESINRRTMODALITIESINUPTO 24 MONTHS
HD: hemodialysis; PD: peritoneal dialysis; CPD: Continuous peritoneal dialysis; APD: automatic peritoneal dialysis; LD: live donor; DD: deceased donor; SUS: Public Healthcare System; SHC: Supplementary Healthcare; Tx: transplant; Fk: tacrolimus.
In this study, the cost of hospitalizations on hemodialysis was higher than that for peritoneal dialysis in the SUS, although it was lower in the SHC, although this difference may be influenced by the lower number of SHC patients compared to the SUS. However, although the referred hemodialysis service is a hospital unit, hospitalization rates in this modality and renal transplantation were similar (even with a shorter hospital stay on hemodialysis).
Such a bias may be due to the lack of exclusive beds for the hemodialysis sector, having the clinic take on responsibility for day-care for patients, which reduces the average cost of hospitalization, with a financial impact lower than expected.
In general, the index of patient hospitalizations, either in hemodialysis or peritoneal dialysis, is equivalent: 11.7 days/patient/year in 2011;5 while in kidney transplantation it would be in the order of 5.7 days/patient/year. If compared to the general population, chronic renal patients have a 16% higher re-hospitalization rate.
Considering epidemiological data, the number of new patients diagnosed with CKD and the number of patients undergoing treatment (starting or even under maintenance) increased almost 11-fold between 1980 and 2011.5
Among the options of RRT, transplantation has the lowest mortality rate and better quality of life, surfacing as the modality of choice for treatment. In addition, the cost of immunosuppressive medication is lower in relation to the medications used in hemodialysis and peritoneal dialysis.
In the first year, the cost of hemodialysis and automated peritoneal dialysis was lower than the average cost of renal transplantation, regardless of the immunosuppressive regimen used, except for hemodialysis in HIV patients. In the second year of treatment, hemodialysis and peritoneal dialysis have a higher value than renal transplantation, confirming data presented by other studies.10-12
In relation to SHC, living donor transplant costs are already lower as of the first year, and at the end of 24 months, the cost of dialysis during the first year has not yet being reached. Another situation to be considered is the lack of stimulation for renal transplantation, since the medical compensation for patients on hemodialysis or peritoneal dialysis is higher than the fees charged for transplant procedures.
Data on the few transplants made in the reference HMO, compared to patients on RRT in the hemodialysis and peritoneal dialysis modalities, showed that regardless of any immunosuppressive agent used, the cost of kidney transplantation is lower than hemodialysis or peritoneal dialysis as of the first year of treatment, when it is equivalent to 32-38% of the cost of the previous ones. From the second year onwards, the cost of a kidney transplant can be 18% of the amount spent on hemodialysis or automated peritoneal dialysis, or 21% of that of manual peritoneal dialysis.
Some limitations of the study could not be avoided. First, the data does not represent values of extreme accuracy; however, these were obtained through the instruments that govern the financial and billing system of hospital costs related to the SUS and the SHC. Second, the population represents the national average of a continental-size country, with considerable interregional differences. Third: the automatic extrapolation of treatment costs in absolute terms, although there were no adjustments in the SUS or SHC during the period analyzed. Fourth, the costs related to the different RRT modalities and their aggregate items vary between different healthcare services and hospitals, as well as the budget incentive values between the different therapeutic modalities and the participation of the third sector in face of the numerous social difficulties, and the availability of vacancies for hospitalization.
C
ONCLUSIONRegardless of structural factors and socioeconomic conditions, kidney transplantation costs are lower as of the second year, strengthening this modality as the main RRT option, since in addition to the financial factor, transplanted patients have higher survival, better quality of life, lower hospitalization index, lower mortality rate and reduction in direct and indirect costs with their comorbidities. In addition, many return to full working condition, contributing with taxes and growth for the country, with less burdening of the system.
Even with some costs underestimated due to the absence of reliable indicators regarding the treatment of the RRT population in Brazil, the information generated is useful for cost impact analyses, in the SUS and SHC, serving as a reference for future studies, epidemiological estimates, budget planning and negotiations with the HMOs.
Prevention policies should be planned, postponing or avoiding the need for RRT. However, when this therapy is necessary, the option should be directed to the most cost-effective modality, that is, renal transplantation.
R
EFERENCES1. Sesso RCC, Lopes AA, Thomé FS, Lugon JR, Burdmann EA. Censo Brasileiro de Diálise, 2009. J Bras Nefrol 2010;32:380-4. DOI: http://dx.doi.org/10.1590/S0101-28002010000400007 2. Salgado Filho N, Brito DJA. Doença renal crônica: a grande
epidemia deste milênio. J Bras Nefrol 2006;28:1-5.
3. Cherchiglia ML, Machado EL, Szuster DAC, Andrade EIG, Acúrcio FA, Caiaffa WT, et al. Perfil epidemiológico dos pa-cientes em terapia renal substitutiva no Brasil, 2000-2004. Rev Saúde Pública 2010;44:639-49. DOI: http://dx.doi. org/10.1590/S0034-89102010000400007
4. Ermida VS. Avaliação da assistência e da qualidade de vida do pa-ciente de hemodiálise na região metropolitana do Rio de Janeiro. [Dissertação de mestrado]. Rio de Janeiro: Programa de Pós-Grad-uação em Saúde Pública da Escola Nacional de Saúde Pública Ser-gio Arouca. Rio de Janeiro; 2009
5. Santos DR, Moura LRR. Dia Mundial do Rim de 2014. Sociedade Brasileira de Nefrologia (SBN). 2014. [Acesso 2017 Mar 8]. Dis-ponível em: http://www.sbn.org.br/pdf/texto_dmr2_2014.pdf 6. Bastos MG, Bregman R, Kirsztajn GM. Doença Renal Crônica:
frequente e grave, mas também prevenível e tratável. Rev Assoc Med Bras 2010;56:248-53. DOI: http://dx.doi.org/10.1590/ S0104-42302010000200028
7. DATASUS. Saúde com Transparência. [Acesso 2017 Mar 8]. Disponível em: http://aplicacao.saude.gov.br/portaltransparen-cia/index.jsf
8. Registro Brasileiro de Transplantes. Dimensionamento dos Transplantes no Brasil e em cada estado (2008-2015). [Acesso 2017 Mar 8]. Disponível em: http://www.abto.org.br/abtov03/ Upload/file/RBT/2015/anual-n-associado.pdf
9. United States Renal Data System. 2013 Annual Data Report: Atlas of Chronic Kidney Disease and End-Stage Renal Disease in the United States, National Institutes of Health, National Institute of Diabetes and Digestive and Kidney Diseases, 2013. [Acesso 2017 Mar 8]. Disponível em: https://www.usrds.org/atlas13.aspx 10. Lorenzo-Sellares V, Pedrosa MI, Santana-Expósito B,
García-González Z, Barroso-Montesinos M. Cost analysis and socio-cultural profile of kidney patients. Impact of the treatment method. Nefrologia 2014;34:458-68.
11. Satyavani K, Kothandan H, Jayaraman M, Viswanathan V. Di-rect costs associated with chronic kidney disease among type 2 diabetic patients in India. Indian J Nephrol 2014;24:141-7. DOI: http://dx.doi.org/10.4103/0971-4065.132000