Abstract
The global widespread use of antimicrobials and accompanying increase in resistant bacte-rial strains is of major public health concern. Wastewater systems and wastewater treat-ment plants are considered a niche for antibiotic resistance genes (ARGs), with diverse microbial communities facilitating ARG transfer via mobile genetic element (MGE). In con-trast to hospital sewage, wastewater from other health care facilities is still poorly investigat-ed. At the instance of a nursing home located in south-west Germany, in the present study, shotgun metagenomics was used to investigate the impact on wastewater of samples col-lected up- and down-stream in different seasons. Microbial composition, ARGs and MGEs were analyzed using different annotation approaches with various databases, including An-tibiotic Resistance Ontologies (ARO), integrons and plasmids. Our analysis identified sea-sonal differences in microbial communities and abundance of ARG and MGE between samples from different seasons. However, no obvious differences were detected between up- and downstream samples. The results suggest that, in contrast to hospitals, sewage from the nursing home does not have a major impact on ARG or MGE in wastewater, pre-sumably due to much less intense antimicrobial usage. Possible limitations of metagenomic studies using high-throughput sequencing for detection of genes that seemingly confer anti-biotic resistance are discussed.
Introduction
Antimicrobial consumption is constantly increasing, both in human and veterinary medicine, leading to a concomitant rise in antibiotic resistant bacteria [1]. It has been reported that anti-microbial resistance evolves in so called“genetic reactors”[2], e.g. farms, hospitals and long-term healthcare facilities (LTCF), which then act as a niche for bacterial exchange between individuals. The large quantities of antibiotics used in healthcare facilities exert a selection pressure on the microbial community. Furthermore, health care facilities emit the resistant bacteria that have evolved into the sewage system, where another potential recruitment pool
OPEN ACCESS
Citation:Bäumlisberger M, Youssar L, Schilhabel MB, Jonas D (2015) Influence of a Non-Hospital Medical Care Facility on Antimicrobial Resistance in Wastewater. PLoS ONE 10(3): e0122635. doi:10.1371/journal.pone.0122635
Academic Editor:Willem van Schaik, University Medical Center Utrecht, NETHERLANDS
Received:December 12, 2014
Accepted:February 23, 2015
Published:March 30, 2015
Copyright:© 2015 Bäumlisberger et al. This is an open access article distributed under the terms of the Creative Commons Attribution License, which permits unrestricted use, distribution, and reproduction in any medium, provided the original author and source are credited.
Data Availability Statement:Raw reads data have been deposited at the sequence read archive (SRA) of NCBI under Accession numbers SAMN02725022, SAMN02725023, SAMN02725024 and
SAMN02725025).
Funding:This study was funded by the German Federal Ministry of Education and Research (02WRS1280A - J) as part of the research program “Risk Management of Emerging Compounds and Pathogens in the Water Cycle (RiSKWa)”.
for antibiotic resistant human pathogens can emerge [3,4]. Recent studies have reported on analyses of antibiotic resistant bacteria and resistance genes in sewage from hospitals [5–7], slaughterhouses and farms [8,9]. Despite the fact that resistant bacteria like methicillin-resis-tantStaphylococcus aureus, vancomycin-resistant enterococci and other multidrug-resistant enterics are endemic in the residents of LTCF [10–13], little is known about the release of resis-tant bacteria into the water cycle in sewage from LTCF. Indeed, in some countries the ageing population has prompted a considerable increase in the number of nursing homes. Thus, an in-vestigation of corresponding wastewater systems is of interest.
In this study, a metagenomic approach was used to survey the taxonomic composition and content of resistance determinants in wastewater up- and downstream from a nursing home in south-west Germany. We identified differences in microbial communities in samples from different seasons but no obvious differences between the up- and downstream samples. Our re-sults may suggest that the nursing home investigated has no marked influence on the wastewa-ter system.
Materials and Methods
Ethics statement
The nursing home operator and the municipality responsible for the combined sewer system granted permission to analyze wastewater.
Water sampling
Sewage samples were collected from the combined sewer of a rural village (800 inhabitants) with-out any industry in swith-outh-west Germany (N: 48.40, E: 8.01). The water-samples were collected from two interconnected sites, one upstream (sample names: C1754, C1755), i.e. municipal sew-age from the villsew-age, and the other 75 meters downstream, i.e. after wastewater discharge from a nursing home (280 residents) to the sewer system (sample names: C1756, C1757). According to the German Association for Water, Wastewater and Waste [14], the volume of wastewater calcu-lated per day downstream of the nursing home is approximately 204 m3, of which roughly 25% originates from the nursing home.
The samples, each of which was taken every two hours over a 24-h period, were combined as“24-h composite samples”. To control for seasonal variations, samples were collected twice during the course of this study in November 2012 (November samples) and March 2013 (March samples).
DNA extraction and sequencing
Functional annotation
All reads were annotated against the SEED subsystem by means of BLAT [22] with the follow-ing parameters: e-Value10–5, identity60% and alignment length of15 amino-acids (aa). The subsystems, i.e. clusters of functional roles, were created by curators to analyze annotations on differently detailed levels. In this study, we scrutinized at level 1 the subsystem“Virulence, Defense and Diseases”(“VDD”), which includes especially the level 2 subsystem“Resistance to antibiotics and toxic compounds”(RATC).
Assembly
CLC Genomic Workbench 6.5.1 was used to assemble the reads after removal of reads with more than 2 unknown bases. Assembly parameters were adjusted to a length fraction of0.8, similarity to0.95 and a minimum contig length of250 bp [23].
Antibiotic resistance genes and mobile genetic elements
For subsequent analyses, reads were re-filtered using FASTX–Toolkit available at the Galaxy platform [24]. Reads with unknown nucleotides or having a score lower than minimum Illu-mina quality score (75% of all bases higher than 30) were removed [25]. The obtained reads and assembled contigs were blasted against antibiotic resistance genes and mobile genetic elements databases.
To generate a local BLAST database with antibiotic resistance genes and a controlled vocabu-lary of antibiotic resistance ontologies (ARO), the corresponding amino acid sequences, tagged specifically for antibiotic resistance, were downloaded from the Comprehensive Antibiotic Resis-tance Database (CARD) [26] (1,845 sequences—04.12.2013). This database was blasted using a BLASTx [27,28], implemented on the Galaxy-based framework Orion [29], against the unassem-bled reads and contigs. For extraction of the best hits the parameters were set according to Kris-tianssonet al. [3], e-Value10–5, identity90% and alignment length25 aa. To check for signatures of mobile genetic elements, two additional databases were created. The first one was developed with 1,511 integron integrase gene sequences from the INTEGRALL database (kindly provided by Alexandra Moura) [30]. This was locally blasted using BLASTn [26,27] against the unassembled and assembled reads (e-Value10–5, identity90% and alignment length of50 bp) and the best hit in each alignment was selected [3]. For detection of reads and contigs associated with plasmids, the plasmid database available in NCBI (4,402 sequences—
Results
Sequencing and taxonomy
Illumina sequencing of the wastewater samples generated a total of 5.4 x 10⁷reads. The read number varied largely between the samples. Further details on QC-results and assembling are depicted inS1 Table. Two percent (± 0.3%) of the quality filtered reads from samples C1754, C1756, C1755 and C1757 contained SSU ribosomal RNA genes. They were assigned in MG-RAST to the M5RNA database in order to compare their domains. In all samples, 94.39% (± 1.78%) of the reads were assigned to the bacteria domain. The remaining reads were mapped to eukaryotes (2.37% ± 0.86%), archaea (0.18% ± 0.14%) and the virus domains (0.14% ± 0.08%) (Table 1). A high percentage of the reads from both November samples was assigned to the phylumFirmicutes(C1754: 77.43%; C1756: 71.85%) followed to a much lower extent by the phylaActinobacteria(7.2 7%; 19.19%),Proteobacteria(9.55%; 4.48%),Bacteroidetes
(1.60%; 0.69%) andFusobacteria(0.24%; 0.08%) (Fig 1). In contrast, in both March samples (C1755, C1757), a considerably lower percentage of SSU rRNA-reads were assigned to Firmi-cutes(38.12%; 48.32%) and to a comparatively larger extent toProteobacteria(38.71%;
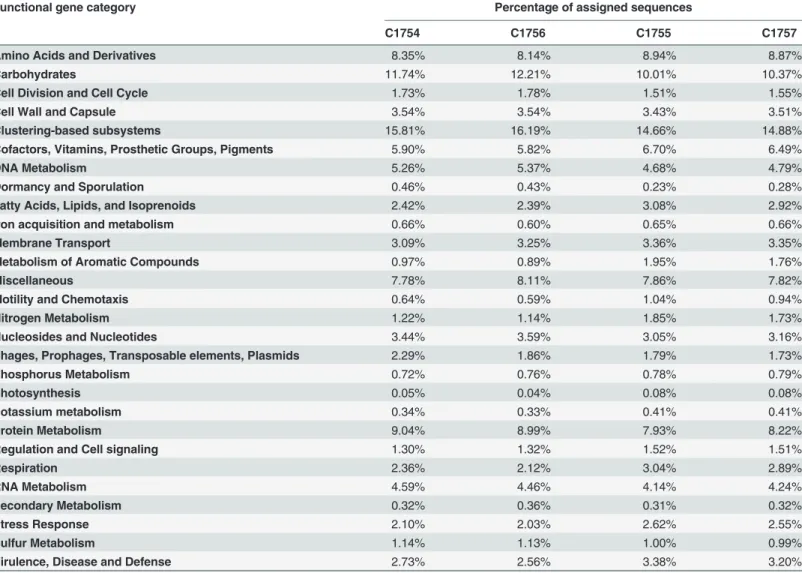
Table 1. Alphabetically ordered functional gene categories in the wastewater samples (MG-RAST SEED Level 1 Distribution).
Functional gene category Percentage of assigned sequences
C1754 C1756 C1755 C1757
Amino Acids and Derivatives 8.35% 8.14% 8.94% 8.87%
Carbohydrates 11.74% 12.21% 10.01% 10.37%
Cell Division and Cell Cycle 1.73% 1.78% 1.51% 1.55%
Cell Wall and Capsule 3.54% 3.54% 3.43% 3.51%
Clustering-based subsystems 15.81% 16.19% 14.66% 14.88%
Cofactors, Vitamins, Prosthetic Groups, Pigments 5.90% 5.82% 6.70% 6.49%
DNA Metabolism 5.26% 5.37% 4.68% 4.79%
Dormancy and Sporulation 0.46% 0.43% 0.23% 0.28%
Fatty Acids, Lipids, and Isoprenoids 2.42% 2.39% 3.08% 2.92%
Iron acquisition and metabolism 0.66% 0.60% 0.65% 0.66%
Membrane Transport 3.09% 3.25% 3.36% 3.35%
Metabolism of Aromatic Compounds 0.97% 0.89% 1.95% 1.76%
Miscellaneous 7.78% 8.11% 7.86% 7.82%
Motility and Chemotaxis 0.64% 0.59% 1.04% 0.94%
Nitrogen Metabolism 1.22% 1.14% 1.85% 1.73%
Nucleosides and Nucleotides 3.44% 3.59% 3.05% 3.16%
Phages, Prophages, Transposable elements, Plasmids 2.29% 1.86% 1.79% 1.73%
Phosphorus Metabolism 0.72% 0.76% 0.78% 0.79%
Photosynthesis 0.05% 0.04% 0.08% 0.08%
Potassium metabolism 0.34% 0.33% 0.41% 0.41%
Protein Metabolism 9.04% 8.99% 7.93% 8.22%
Regulation and Cell signaling 1.30% 1.32% 1.52% 1.51%
Respiration 2.36% 2.12% 3.04% 2.89%
RNA Metabolism 4.59% 4.46% 4.14% 4.24%
Secondary Metabolism 0.32% 0.36% 0.31% 0.32%
Stress Response 2.10% 2.03% 2.62% 2.55%
Sulfur Metabolism 1.14% 1.13% 1.00% 0.99%
Virulence, Disease and Defense 2.73% 2.56% 3.38% 3.20%
32.83%). Remaining reads were classified toActinobacteria(7.27%; 5.89%),Bacteroidetes
(4.15%; 2.44%), andFusobacteria(0.59%; 1.05%) (Fig 1). rRNA sequences, derived by unclassi-fied bacteria and by SSU ribosomal RNA from other phyla together contained 12.16% and 9.47%, respectively, of the remaining rDNA reads. In contrast to the samples taken from both interconnected sampling sites on the same date, the taxonomic assignment showed high differ-ences in phyla arrangement between the November and March samples.
The samples were annotated using M5RNA database: C1754 and C1756: Upstream and downstream samples from November; C1755 and C1757: Upstream and downstream samples from March.
Functional analyses of wastewater sequences
After quality-filtering the reads by the MG-RAST pipeline, 30% to 49% of the remaining reads were annotated to level 1 subsystems (S1 Table). Based on SEED, the 12 most abundant subsys-tems were distributed similarly among all samples. Making up 41% to 45% of all aligned reads, the most frequent subsystems were“Clustering-based subsystems”,“Carbohydrates”,“Protein metabolism”and“Amino acids and derivatives”(Table 1). Between 2.5% and 3.3% of all level 1 reads were annotated to the subsystem“Virulence, disease and defense”(VDD) and scrutinized in depth. VDD consisted of seven level 2 clusters with the predominance of“Resistance to anti-biotics and toxic compounds”(RATC). In all samples, around 68% (± 4%) of the VDD reads were assigned to the RATC subsystem (Table 2). This level 2 cluster contained genes assigned to resistance and adaption to antibiotics, metals and other environmental influences. A high percentage of assigned sequences belonged to five functional groups. The first group was attrib-uted to“Resistance to fluoroquinolones”including DNA gyrase subunit A (gyrA), B (gyrB), Topoisomerase IV subunit A (parC) and B (parE)(C1754: 22.61%; C1756: 24.78%;
C1755:13.48%; C1757:14.97%). The second was“Multidrug resistance efflux pumps”, such as members of the multi antimicrobial extrusion protein family and resistance-nodulation-cell
Fig 1. Phylogenetic compositions of the bacteria domain in the samples.
division superfamily (14.67%; 12.00%; 13.18%; 13.70%). The third was“Copper homeostasis”
(14.24%; 14.14%; 18.11%; 16.90%). The fourth was“BlaR1 family regulatory sensor-transducer disambiguation”mainly represented by Cu2+-exporting ATPase and rarely by regulatory sen-sor-transducer of theblaR1/mecR1 family(12.00%; 12.81%; 12.26%; 11.67%) and the fifth was
“cobalt-zinc-cadmium resistance”(10.07%; 7.85%; 18.29%; 16.51%) (Table 2).
Abundance and ARG diversity
After blasting by means of“BLASTX”against CARD, the best hits were normalized to the total number of quality filtered reads and later referred to as relative abundance. This abundance of reads was subsequently expressed in parts per million (ppm) according to Maet al. [32]. Analy-ses of the four samples revealed reads of 526 ppm in sample C1754, 511 ppm in C1756, 639 ppm in C1755 and 710 ppm in C1757. Moreover, the genes were subsequently classified into resistance-related gene (RRG) clusters depending on their ARO numbers (Fig 2). In up-and downstream samples, we found 98, respectively 164 different RRGs corresponding to No-vember samples, and 103, respectively 134 corresponding to March samples. Apparently, the inflows from nursing home sewage had no principal effect on RRG abundance in municipal wastewater. However, their diversity increased slightly and their composition changed. We classified the RRGs into groups with similar resistance spectrum (resistance against antimicro-bial compounds from the same class). In all samples,rpoBgenes prevailed, which, provided particular mutations have occurred, can confer resistance against antibiotics of the rifamycine group (Table 3).
Table 2. Relative abundance of VDD and RATC genes (1%) in the samples.
Subsystems C1754 C1756 C1755 C1757
Level 1 VDD-hits (%) 2.73 2.56 3.38 3.20
Level 2 RATC within VDD (%) 68.22 64.98 71.29 70.33
Level 3 Categories within RATC (%)a)
Resistance tofluoroquinolones 22.61 24.78 13.48 14.97
Multidrug Resistance Efflux Pumps 14.67 12.00 13.18 13.70
Copper homeostasis 14.24 14.14 18.11 16.90
BlaR1 Family Regulatory Sensor-transducer Disambiguation 12.00 12.81 12.26 11.67
Cobalt-zinc-cadmium resistance 10.07 7.85 18.29 16.51
Methicillin resistance in Staphylococci 5.71 6.55 3.68 4.04
Arsenic resistance 3.56 3.29 2.89 3.17
Multidrug efflux pump in Campylobacter jejuni (CmeABC operon) 2.78 1.93 4.67 4.89
Resistance to Vancomycin 1.95 1.96 0.19 0.41
Erythromycin resistance 1.81 2.05 1.14 1.14
Copper homeostasis: copper tolerance 1.77 1.72 2.06 2.10
Beta-lactamase 1.46 1.76 1.91 1.98
Cadmium resistance 1.39 1.42 0.52 0.74
Bile hydrolysis 1.32 1.77 0.43 0.58
The mdtABCD multidrug resistance cluster 1.07 0.88 2.47 2.46
Streptococcus pneumoniae Vancomycin Tolerance Locus 0.82 1.42 0.19 0.20
Mercury resistance operon 0.97 1.27 1.89 1.73
Mercuric reductase 0.78 1.13 1.40 1.30
a)Legend: (RATC1%).
For instance, in the November samples, the relative abundance of reads related to the rifa-mycine group decreased after the inflow. Moreover, March samples showed a smaller variation of reads tagged to the RRG group of multidrug resistance.
Notably, tetracycline related reads such astetA,tetB(P),tetC,tetD,tetG.tetL,tetK,tetM,
tetO,tetQ,tetS,tetT,tetW,tetX,tet32,tet39,tet43andtet45showed an increment of over 30% in both downstream samples. The other RRG-groups did not exhibit any remarkable changes.
The resistance genes with the highest frequency in the samples are presented inFig 3. The RNA polymerase encodingrpoBgene, which can confer resistance against rifamycin in the pres-ence of few particular mutations, was detected in all samples with an abundance of over 150 ppm (S2 Table). The resistance genestetWandgyrAhad a relative abundance higher than 50 ppm (S2 Table) in at least one sample from November and March. The following relevant RRGs [33] had a relative abundance higher than 10 ppm: aminoglycoside adenyltransferases, macrolide resis-tance genesermBandmacB, the multidrug geneacrB from the resistance-nodulation-division
Table 3. Distribution of RRG-groups in the samples.
RRG groups C1754 [ppm] C1756 [ppm] C1755 [ppm] C1757 [ppm]
Rifamycine 203.2 155.9 243.4 245.1
Multidrug 70.3 86.1 87.0 136.3
Quinolone 58.8 45.6 102.5 102.7
Tetracycline 94.2 123.5 37.4 58
Macrolides 43.7 42.6 64.8 56.7
Aminocoumarins 27.7 25.3 50.6 45.1
Beta-Lactam 11.6 14.4 24.7 29.4
Aminoglycosides 7.6 8.7 17.6 19.3
Sulfonamides 1.5 3.3 2.1 6.8
Chloramphenicol 2.0 1.3 4.2 4.1
Vancomycin 5.7 3.3 1.3 2.7
Others 0.6 0.7 4.2 3.8
The number of hits against the CARD in each RRG-group is presented as hits per million reads (ppm).
doi:10.1371/journal.pone.0122635.t003
Fig 2. Abundance and diversity of annotated reads.Abundance (left) and diversity (right) of reads annotated against CARD are depicted. The hits were normalized against the total number of reads in each sample after QC-filtering.
(RND) family. Furthermore, the quinolone resistance genesparC and both tetracycline genes
tetO andtet32 were also detected with the same relative abundance. In the November samples, OXA gene family reads were present with a relative abundance lower than 10 ppm, in contrast to the March samples with a relative abundance higher than 10 ppm. This gene family belongs toβ -lactam resistance gene ontologies among other detected determinants coding forβ-lactamases (CTX-M, GES, AER CARB, PSE, R1, OMP, CphA, PC1, SHV, FEZ, TEM, AmpC and mecA) and was the one with the highest abundance in this group. Overall, sulfonamide resistance genes such asfolP,sul1,sul2 and vanocmycin resistance related genes such asvanC,vanR,vanS,vanT,
vanWvanXYC,vanY andvanZ were present below 5 ppm or at the detection limit (S2 Table). Reads assembled into contigs from C1754, C1756, C1755 and C1757 were blasted against CARD database with a total of 13, 193, 29 and 80 aligned contigs, respectively, and resulted in different types and numbers of RRG (8, 71, 19 and 80) (S2 Table).
Abundance of mobile genetic elements
Reads of seven to approximately 25 ppm could be assigned to integrase coding sequences of the INTEGRALL database (Fig 4). The November samples (C1754 and C1756) and the March samples (C1755 and C1757) were mapped against known integrase encoding genes with reads of 7, 8, 24 and 25 ppm, respectively. About 74% to 85% of the reads were assigned to class 1 integrase geneintI1. The remaining reads were associated tointI1delta,intI2,intI3,intIPac,
groEL/intI1,intIAandintI (S3 Table). Furthermore, assembled reads of all samples were simul-taneously blasted against the integrall database. None of the 43,808 contigs from C1754 could be identified as encoding an integrase gene. Only 4 of 234,564 contigs (C1756), 4 of 23,420 con-tigs (C1755) and 7 of 74,589 (C1757) matched known integrase (S3 Table).
The hits were normalized against the total number of reads in each sample after QC-filtering. Moreover, reads of 4460 and 4087 ppm from C1754 and C1756 respectively matched with plasmid sequences available in the NCBI RefSeq database. Of these, 31% were assigned to an unnamed plasmid ofEubacterium eligensATCC 27750 (NC_012780.1). Interestingly, a higher number of reads from C1755 (7329 ppm) and C1757 (7303 ppm) were annotated (Fig 4), where 8.5% were assigned to the plasmid pKV29 ofβ-ProteobacteriumDelftiasp. Strain KV29
Fig 3. Abundance of the 12 most frequent ARGs types with the highest blast hits number (Relative abundance in any sample10 ppm).
(NC_019312.1). Notably, we did not find any dominating plasmids in either March samples (S4 Table).
Finally, after blasting of contigs against the plasmid database, we founded 210 contigs (C1754), 1440 contigs (C1756), 292 contigs (C1755) and 575 contigs (C1757) matching with 86, 366, 134 and 264 plasmids, respectively (S4 Table).
Discussion
In this study on the potential introduction of ARG into the water cycle by medical facilities other than hospitals, we investigated differences between the microbial community in up- and downstream samples of wastewater from a nursing home collected in two different seasons. We used the M5RNA database available on MG-RAST, which allows examination of microbial composition in metagenomic wastewater samples. In accordance with a recent study, which as-sumed 100 bp sequences as too short for accurate identification at sub-phyla levels [34], we only analyzed the community at the phylum level, and not in greater detail at the level of order or even genus. Our results did not show any differences at domain level when comparing sam-ples from both sampling sites in the same season. However, comparison of the bacteria phyla distribution showed a seasonal difference between samples. The phylumFirmicutesdominated in the November samples. Firmicutes has been reported as the dominant phylum in wastewater samples with a high level of pollution and extreme conditions [35].Firmicutesare frequently found alongside the phylaBacteroidetesin human and animal feces [36–39]. Some studies de-scribe them as being one of the dominating phyla in raw wastewater, while others dede-scribe low abundance [35,39–42]. Beside these phyla, it has been shown thatProteobacteria, belong to the microbial community of the sewer system and, dominate in sewage samples [35,42,43], although only found to representc. 0.1% of the species in the human colon [37,42]. The low abundance ofProteobacteriaand high number of feces-associated bacterial groups found in the November wastewater samples may indicate a domination of bacteria of fecal origin over other
Fig 4. Relative abundance of integronase genes (A) and plasmids (B).
environmental bacteria. In contrast, the March sewage samples showed a different phyla distri-bution, with a similar number of reads linked toFirmicutesand toProteobacteriain C1755 and an approximately comparable distribution in C1757. Our results indicate the presence of fecal bacteria independent of sampling upstream or downstream from the nursing home, yet to a different extent on both sampling dates. No extreme environmental conditions in the munici-pal sewage system were reported or investigated in further tests (data not shown). Due to the limited number of samples and without the possibility of statistical power tests our taxonomic analyses did not reveal an apparent alteration of the municipal sewage system community by the medical facility.
MG-RAST was used for functional gene annotations, especially those related to resistance against antibiotics and other compounds. Around 30% to 49% of the reads, which passed the MG-RAST quality control filter, were assigned to genes from the SEED level 1. These values were markedly higher than those reported or calculated on Illumina reads from other studies [25,34]. Our results were in accordance with a previous study by Wang et al. [25], where the number of annotated reads was closely related depending on the sample origin and the bacteri-al composition.
Regarding level 1 subsystem distribution, a large number of reads was assigned to the sub-system with basic prokaryotic processes such as carbohydrate metabolism. However, the sam-ples did not show obvious differences at this level. Neither did the subsystem“Virulence, Disease and Defense”(VDD), which includes the level 2 system“Resistance to antibiotics and toxic compounds”(RATC), show any differences between the up- and downstream samples. Furthermore, in all four samples, the major number of reads in the subsystem VDD was as-signed to the RATC system. For instance, resistance to fluoroquinolones, which proved to be one of the highest portions of RATC-assigned reads, has already been reported as dominating in the sludge of wastewater treatment plant [25]. The others categories were multidrug resis-tance efflux pumps,blaR1 family regulatory sensor-transducer disambiguation, methicillin re-sistance in staphylococci, multidrug efflux pump inCampylobacter jejuni(CmeABC operon), resistance to vancomycin, erythromycin, beta-lactamase and the mdtABCD multidrug resis-tance cluster. Overall, the samples were classified in the same range without any noteworthy differences in the number of reads. In addition to ARG, the RATC system includes heavy metal resistances against cobalt, zinc, copper and others. Different authors have already reported the traits resistance to antibiotics and heavy metals to be linked, due to their close association to mobile genetic elements and a possible co-selection with ARGs [44–46]. Based on this, heavy metal resistance genes could be added to the ARG index for better description of the antibiotics resistance potential [47]. Therefore, we included the reads associated with metal resistance in our analyses. At least 1% of reads in the RATC subsystem were assigned to copper [48,49], co-balt [44], zinc [50], cadmium [51] and arsenic resistance [52]. Like ARGs no apparent differ-ences were detected between samples collected at the same time.
with the quinolone RGG. In contrast, the subcategory“Resistance to fluoroquinolones”showed the highest relative abundance of all antibiotic resistance subcategories in MG-RAST; however, no resistance to tetracycline was reported in this RATC subcategory. These differences are pri-marily due to the organization of the databases. The SEED database focuses on the annotation of core metabolism rather than on categories such as resistance groups. Furthermore, not all re-lated genes are summarized in one comprehensive category [16]. For instance, tetracycline re-sistance genes liketetO, are neither included in RATC-Category nor in the Level1 subsystem
“VDD”as expected; rather they are located in sub-categories of the level 1 subsystem“Protein Metabolism”. Basically, the differences between the results are a consequence of the differences in the structure and design of the databases. Again, the dissimilarities in the used cutoffs and possible gene coverages render the results incomparable. MG-RAST provides a good overview of all the genes present in the metagenome. Special databases like CARD are nonetheless re-quired especially for deep ARG analysis.
Mobile genetic elements (MGE) like integrons or plasmids play an important role in the transfer and spread of genes between bacteria, especially those related to antibiotic resistance [55]. In this study, the abundance of MGE was investigated to describe the potential of gene mobility in the metagenome samples, and to control for a possible spread of these elements by nursing home residents into the sewage [3,56]. The integrase genes, which were selected as un-ambiguous markers for integrons, showed nearly the same abundance at the interconnected sampling sites, albeit marked differences on both sampling dates, which might be in line with the different microbial composition in both sampling seasons. Additionally,IntI1 was the dom-inating integrase gene in all samples, confirming its higher prevalence in wastewater-associated environments [25,31].
Like integrase genes, plasmids were present to a similar extent at the interconnected sample sites, although the extent to which they were present differed in the two sampling seasons and the nursing home inflow showed no influence on the abundance of plasmids. The annotated plasmids were classified according to their host. The resulting taxonomy results revealed a no-table relation between dominating phyla, based on the analysis of SSU reads and plasmids with high frequency. Comparison of the outcome of this plasmid BLAST with the taxonomy results revealed a relation between dominating phylum and the most frequent plasmid host. An un-named plasmid ofEubacterium eligens[57], a species belonging to the phylumFirmicutes[58], was found in more than 30% of the total BLAST hits in the November samples. This result is in accordance with the high prevalence ofFirmicutesSSU-reads in these samples. Yet, we did not detect similarly prevalent phyla in the March samples.
the approach used in this work. Indeed, wastewater changes continuously, for which reason we collected“24-hour composite samples”in different seasons to avoid a bias due to differences in the microbial load of the wastewater at different times of day or seasonal variations. Despite these precautions, neither comparison of up- or downstream samples, nor samples taken from different seasons revealed major differences in ARG. Another limitation here is the read length of 100 bases, which, as mentioned above, might not be sufficient to provide a reliable annota-tion beyond taxon phylum [23]. Furthermore, housekeeping genes like the RNA polymerase subunit B encoding gene (rpoB) [60] confer resistance against antibiotics of the rifamycine group only, if mutations in a few particular codons are present [61,62]. Consequently, reads were assigned to resistance genes irrespective of whether the sequence contained a correspond-ing mutation or not. Similar restrictions are encountered with genes assigned to resistance against aminocumarines [63] and quinolones [64], which differ in only a few mutations from their susceptible types. Also, multidrug efflux systems, like the Resistance-Nodulation-Division Family, are usually present in the bacterial genome, and only overexpression of this pump, which cannot be detected without expression experiments, confers resistance against different antibiotics [65].
In an attempt to improve the sequence length and results, reads were assembled in contigs. Only about 23% to 51% of the reads were assembled in contigs larger than 250 bp. This leads to a loss of more than 49% of the sequence data. Previous studies reported similar drawbacks in assembling environmental sequences and explained it with the high bacterial diversity in envi-ronmental samples [43,66] (S1 Table). Additionally, the annotations of unassembled reads and contigs were not comparable because the information about the frequencies of reads was lost after assembly [16].
This study was conducted at the instance of a 280-resident nursing home to investigate the impact of ARG load in wastewater from a long-term health care facility on municipal sewage of an 800-inhabitant village. The results demonstrate that the microbial composition of the wastewater did not differ before or after the inflow from the nursing home. However, the study revealed seasonal changes. Different approaches in annotation to ARG and MGE also revealed mainly seasonal differences and only minute sampling site differences. In contrast to sewage from hospitals, which is well known to introduce ARG into the water cycle, similar pollution by a long term health care facility was not detected. Further studies with a higher number of in-terconnected samples should be performed for statistical proof.
Supporting Information
S1 Table. Sequence quality control (QC) steps and the de novo assembling.Details about the sequence quality control (QC) steps and thede novoassembling by use of the CLC Geno-mic Workbench 6.5.1 (Number of reads).
(DOCX)
S2 Table. Abundance and Identity of detected antibiotic resistance related genes.Matched high-throughput sequencing reads/contigs of the samples C1754, C1755, C1756 and C1757 against CARD.
(DOCX)
S3 Table. Abundance and Identity of detected integrase sequences.Matched high-through-put sequencing reads/contigs of the samples C1754, C1755, C1756 and C1757 against the INTEGRALL database.
Conceived and designed the experiments: MB DJ. Performed the experiments: MB MBS. Ana-lyzed the data: MB LY MBS DJ. Contributed reagents/materials/analysis tools: MB MBS DJ. Wrote the paper: MB LY MBS DJ.
References
1. Meyer E, Gastmeier P, Deja M, Schwab F. Antibiotic consumption and resistance: Data from Europe and Germany. Int J Med Microbiol. 2013; 303: 388–395. doi:10.1016/j.ijmm.2013.04.004PMID: 23727396
2. Baquero F, Martínez J-L, Cantón R. Antibiotics and antibiotic resistance in water environments. Curr Opin Biotechnol. 2008; 19: 260–265. doi:10.1016/j.copbio.2008.05.006PMID:18534838
3. Kristiansson E, Fick J, Janzon A, Grabic R, Rutgersson C, Weijdegård B, et al. Pyrosequencing of
Anti-biotic-Contaminated River Sediments Reveals High Levels of Resistance and Gene Transfer Ele-ments. PLoS ONE. 2011; 6: e17038. doi:10.1371/journal.pone.0017038PMID:21359229
4. Zhang XX, Zhang T, Fang HH. Antibiotic resistance genes in water environment. Appl Microbiol Bio-technol. 2009; 82: 397–414. doi:10.1007/s00253-008-1829-zPMID:19130050
5. Bréchet C, Plantin J, Sauget M, Thouverez M, Talon D, Cholley P, et al. Wastewater Treatment Plants Release Large Amounts of Extended-Spectrumβ-Lactamase–ProducingEscherichia coliInto the Envi-ronment. Clin Infect Dis. 2014; ciu190. doi:10.1093/cid/ciu190
6. Jakobsen L, Sandvang D, Hansen LH, Bagger-Skjot L, Westh H, Jorgensen C, et al. Characterisation, dissemination and persistence of gentamicin resistantEscherichia colifrom a Danish university hospital to the waste water environment. Env Int. 2008; 34: 108–115.
7. Yang CM, Lin MF, Liao PC, Yeh HW, Chang BV, Tang TK, et al. Comparison of antimicrobial resistance patterns between clinical and sewage isolates in a regional hospital in Taiwan. Lett Appl Microbiol. 2009; 48: 560–565. doi:10.1111/j.1472-765X.2009.02572.xPMID:19291216
8. Sabate M, Prats G, Moreno E, Balleste E, Blanch AR, Andreu A. Virulence and antimicrobial resistance profiles amongEscherichia colistrains isolated from human and animal wastewater. Res Microbiol. 2008; 159: 288–293. doi:10.1016/j.resmic.2008.02.001PMID:18434099
9. Martins da Costa PM, Vaz-Pires PM, Bernardo FM. Antibiotic resistance ofEnterococcusspp. isolated from wastewater and sludge of poultry slaughterhouses. J Env Sci Health B. 2006; 41: 1393–1403. PMID:17090500
10. Manzur A, Gavalda L, Ruiz de Gopegui E, Mariscal D, Dominguez MA, Perez JL, et al. Prevalence of methicillin-resistantStaphylococcus aureusand factors associated with colonization among residents in community long-term-care facilities in Spain. Clin Microbiol Infect. 2008; 14: 867–872. doi:10.1111/j. 1469-0691.2008.02060.xPMID:18844688
11. Pop-Vicas A, Mitchell SL, Kandel R, Schreiber R, D’Agata EMC. Multidrug-Resistant Gram-Negative Bacteria in a Long-Term Care Facility: Prevalence and Risk Factors. J Am Geriatr Soc. 2008; 56: 1276–1280. doi:10.1111/j.1532-5415.2008.01787.xPMID:18557965
12. Arvand M, Moser V, Pfeifer Y. Prevalence of extended-spectrum-β-lactamase-producingEscherichia coliand spread of the epidemic clonal lineage ST131 in nursing homes in Hesse, Germany. J Antimi-crob Chemother. 2013; 68: 2686–2688. doi:10.1093/jac/dkt226PMID:23759669
14. ATV. ATV—Working sheet A118: Hydraulic design and proof of sewerage networks. 1st ed. Hennef, Germany: German Association for Water, Wastewater and Waste; 2006.
15. Lemarchand K, Berthiaume F, Maynard C, Harel J, Payment P, Bayardelle P, et al. Optimization of mi-crobial DNA extraction and purification from raw wastewater samples for downstream pathogen detec-tion by microarrays. J Microbiol Methods. 2005; 63: 115–126. doi:10.1016/j.mimet.2005.02.021PMID: 15936096
16. Meyer F, Paarmann D, D’Souza M, Olson R, Glass EM, Kubal M, et al. The metagenomics RAST serv-er—a public resource for the automatic phylogenetic and functional analysis of metagenomes. BMC Bioinformatics. 2008; 9: 386. doi:10.1186/1471-2105-9-386PMID:18803844
17. Kent WJ. BLAT—The BLAST-Like Alignment Tool. Genome Res. 2002; 12: 656–664. doi:10.1101/gr. 229202PMID:11932250
18. Cole JR, Wang Q, Fish JA, Chai B, McGarrell DM, Sun Y, et al. Ribosomal Database Project: data and tools for high throughput rRNA analysis. Nucleic Acids Res. 2014; 42: D633–642. doi:10.1093/nar/ gkt1244PMID:24288368
19. DeSantis TZ, Hugenholtz P, Larsen N, Rojas M, Brodie EL, Keller K, et al. Greengenes, a Chimera-Checked 16S rRNA Gene Database and Workbench Compatible with ARB. Appl Environ Microbiol. 2006; 72: 5069–5072. doi:10.1128/AEM.03006-05PMID:16820507
20. Quast C, Pruesse E, Yilmaz P, Gerken J, Schweer T, Yarza P, et al. The SILVA ribosomal RNA gene database project: improved data processing and web-based tools. Nucleic Acids Res. 2013; 41: D590– D596. doi:10.1093/nar/gks1219PMID:23193283
21. Bai Y, Liu R, Liang J, Qu J. Integrated Metagenomic and Physiochemical Analyses to Evaluate the Po-tential Role of Microbes in the Sand Filter of a Drinking Water Treatment System. PLoS ONE. 2013; 8: e61011. doi:10.1371/journal.pone.0061011PMID:23593378
22. Overbeek R, Begley T, Butler RM, Choudhuri JV, Chuang H-Y, Cohoon M, et al. The subsystems ap-proach to genome annotation and its use in the project to annotate 1000 genomes. Nucleic Acids Res. 2005; 33: 5691–5702. doi:10.1093/nar/gki866PMID:16214803
23. Hewson I, Eggleston EM, Doherty M, Lee DY, Owens M, Shapleigh JP, et al. Metatranscriptomic Analy-ses of Plankton Communities Inhabiting Surface and Subpycnocline Waters of the Chesapeake Bay during Oxic-Anoxic-Oxic Transitions. Appl Environ Microbiol. 2014; 80: 328–338. doi:10.1128/AEM. 02680-13PMID:24162577
24. Goecks J, Nekrutenko A, Taylor J, $author.lastName $author firstName. Galaxy: a comprehensive ap-proach for supporting accessible, reproducible, and transparent computational research in the life sci-ences. Genome Biol. 2010; 11: R86. doi:10.1186/gb-2010-11-8-r86PMID:20738864
25. Wang Z, Zhang X-X, Huang K, Miao Y, Shi P, Liu B, et al. Metagenomic profiling of antibiotic resistance genes and mobile genetic elements in a tannery wastewater treatment plant. PloS One. 2013; 8: e76079. doi:10.1371/journal.pone.0076079PMID:24098424
26. McArthur AG, Waglechner N, Nizam F, Yan A, Azad MA, Baylay AJ, et al. The Comprehensive Antibiot-ic Resistance Database. AntimAntibiot-icrob Agents Chemother. 2013; 57: 3348–3357. doi:10.1128/AAC. 00419-13PMID:23650175
27. Cock PJA, Grüning BA, Paszkiewicz K, Pritchard L. Galaxy tools and workflows for sequence analysis with applications in molecular plant pathology. PeerJ. 2013; 1: e167. doi:10.7717/peerj.167PMID: 24109552
28. Camacho C, Coulouris G, Avagyan V, Ma N, Papadopoulos J, Bealer K, et al. BLAST+: architecture and applications. BMC Bioinformatics. 2009; 10: 421. doi:10.1186/1471-2105-10-421PMID: 20003500
29. Cuccuru G, Orsini M, Pinna A, Sbardellati A, Soranzo N, Travaglione A, et al. Orione, a web-based framework for NGS analysis in microbiology. Bioinforma Oxf Engl. 2014; doi:10.1093/bioinformatics/ btu135
30. Moura A, Soares M, Pereira C, Leitão N, Henriques I, Correia A. INTEGRALL: a database and search
engine for integrons, integrases and gene cassettes. Bioinformatics. 2009; 25: 1096–1098. doi:10. 1093/bioinformatics/btp105PMID:19228805
31. Zhang T, Zhang X-X, Ye L. Plasmid Metagenome Reveals High Levels of Antibiotic Resistance Genes and Mobile Genetic Elements in Activated Sludge. PLoS ONE. 2011; 6. doi:10.1371/journal.pone. 0026041
32. Ma L, Li B, Zhang T. Abundant rifampin resistance genes and significant correlations of antibiotic resis-tance genes and plasmids in various environments revealed by metagenomic analysis. Appl Microbiol Biotechnol. 2014; 98: 5195–5204. doi:10.1007/s00253-014-5511-3PMID:24615381
2180-11-103PMID:21575148
39. Singh KM, Jakhesara SJ, Koringa PG, Rank DN, Joshi CG. Metagenomic analysis of virulence-associ-ated and antibiotic resistance genes of microbes in rumen of Indian buffalo (Bubalus bubalis). Gene. 2012; 507: 146–151. doi:10.1016/j.gene.2012.07.037PMID:22850272
40. Cai L, Ju F, Zhang T. Tracking human sewage microbiome in a municipal wastewater treatment plant. Appl Microbiol Biotechnol. 2014; 98: 3317–3326. doi:10.1007/s00253-013-5402-zPMID:24305737
41. Shanks OC, Newton RJ, Kelty CA, Huse SM, Sogin ML, McLellan SL. Comparison of the Microbial Community Structures of Untreated Wastewaters from Different Geographic Locales. Appl Environ Microbiol. 2013; 79: 2906–2913. doi:10.1128/AEM.03448-12PMID:23435885
42. McLellan SL, Huse SM, Mueller-Spitz SR, Andreishcheva EN, Sogin ML. Diversity and population structure of sewage-derived microorganisms in wastewater treatment plant influent. Environ Microbiol. 2010; 12: 378–392. doi:10.1111/j.1462-2920.2009.02075.xPMID:19840106
43. Sanapareddy N, Hamp TJ, Gonzalez LC, Hilger HA, Fodor AA, Clinton SM. Molecular Diversity of a North Carolina Wastewater Treatment Plant as Revealed by Pyrosequencing. Appl Environ Microbiol. 2009; 75: 1688–1696. doi:10.1128/AEM.01210-08PMID:19114525
44. Baker-Austin C, Wright MS, Stepanauskas R, McArthur JV. Co-selection of antibiotic and metal resis-tance. Trends Microbiol. 2006; 14: 176–182. doi:10.1016/j.tim.2006.02.006PMID:16537105
45. Jury KL, Vancov T, Stuetz RM, Khan SJ. Antibiotic resistance dissemination and sewage treatment plants. In: Méndez-Vilas A, editor. Current research, technology and education topics in applied micro-biology and microbial biotechnology. Badajoz, Spain: Formatex Research Center; 2010. pp. 509–519. Available:http://www.formatex.info/microbiology2/509-519.pdf
46. Wright GD. The antibiotic resistome: the nexus of chemical and genetic diversity. Nat Rev Microbiol. 2007; 5: 175–186. doi:10.1038/nrmicro1614PMID:17277795
47. Port JA, Wallace JC, Griffith WC, Faustman EM. Metagenomic Profiling of Microbial Composition and Antibiotic Resistance Determinants in Puget Sound. PLoS ONE. 2012; 7: e48000. doi:10.1371/journal. pone.0048000PMID:23144718
48. Finan TM, Weidner S, Wong K, Buhrmester J, Chain P, Vorhölter FJ, et al. The complete sequence of the 1,683-kb pSymB megaplasmid from the N2-fixing endosymbiontSinorhizobium meliloti. Proc Natl Acad Sci. 2001; 98: 9889–9894. doi:10.1073/pnas.161294698PMID:11481431
49. Martins VV, Zanetti MOB, Pitondo-Silva A, Stehling EG. Aquatic environments polluted with antibiotics and heavy metals: a human health hazard. Environ Sci Pollut Res. 2014; 21: 5873–5878. doi:10.1007/ s11356-014-2509-4PMID:24448880
50. Conejo MC, Garcia I, Martinez-Martinez L, Picabea L, Pascual A. Zinc Eluted from Siliconized Latex Urinary Catheters Decreases OprD Expression, Causing Carbapenem Resistance inPseudomonas
aeruginosa. Antimicrob Agents Chemother. 2003; 47: 2313–2315. doi:10.1128/AAC.47.7.2313–2315.
2003PMID:12821486
51. O’Driscoll J, Glynn F, Fitzgerald GF, van Sinderen D. Sequence Analysis of the Lactococcal Plasmid pNP40: a Mobile Replicon for Coping with Environmental Hazards. J Bacteriol. 2006; 188: 6629–6639. doi:10.1128/JB.00672-06PMID:16952955
53. McClean P, Hughes C, Tunney M, Goossens H, Jans B, European Surveillance of Antimicrobial Con-sumption (ESAC) Nursing Home Project Group. Antimicrobial prescribing in European nursing homes. J Antimicrob Chemother. 2011; 66: 1609–1616. doi:10.1093/jac/dkr183PMID:21596722
54. Martinez JL. Environmental pollution by antibiotics and by antibiotic resistance determinants. Env Pol-lut. 2009; 157: 2893–2902. doi:10.1016/j.envpol.2009.05.051PMID:19560847
55. Boerlin P, Reid-Smith RJ. Antimicrobial resistance: its emergence and transmission. Anim Health Res Rev Conf Res Work Anim Dis. 2008; 9: 115–126. doi:10.1017/S146625230800159X
56. Port JA, Cullen AC, Wallace JC, Smith MN, Faustman EM. Metagenomic Frameworks for Monitoring Antibiotic Resistance in Aquatic Environments. Environ Health Perspect. 2014; 122: 222–228. doi:10. 1289/ehp.1307009PMID:24334622
57. Mahowald MA, Rey FE, Seedorf H, Turnbaugh PJ, Fulton RS, Wollam A, et al. Characterizing a model human gut microbiota composed of members of its two dominant bacterial phyla. Proc Natl Acad Sci U S A. 2009; 106: 5859–5864. doi:10.1073/pnas.0901529106PMID:19321416
58. Holdeman LV, Moore WEC. New Genus, Coprococcus, Twelve New Species, and Emended Descrip-tions of Four Previously Described Species of Bacteria from Human Feces. Int J Syst Bacteriol. 1974; 24: 260–277. doi:10.1099/00207713-24-2-260
59. Teeling H, Glöckner FO. Current opportunities and challenges in microbial metagenome analysis—a bioinformatic perspective. Brief Bioinform. 2012; 13: 728–742. doi:10.1093/bib/bbs039PMID: 22966151
60. Case RJ, Boucher Y, Dahllöf I, Holmström C, Doolittle WF, Kjelleberg S. Use of 16S rRNA and rpoB Genes as Molecular Markers for Microbial Ecology Studies. Appl Environ Microbiol. 2007; 73: 278–288. doi:10.1128/AEM.01177-06PMID:17071787
61. Mokrousov I, Otten T, Vyshnevskiy B, Narvskaya O. Allele-Specific rpoB PCR Assays for Detection of Rifampin-ResistantMycobacterium tuberculosisin Sputum Smears. Antimicrob Agents Chemother. 2003; 47: 2231–2235. doi:10.1128/AAC.47.7.2231–2235.2003PMID:12821473
62. Wichelhaus TA, Schafer V, Brade V, Boddinghaus B. Molecular Characterization ofrpoBMutations Conferring Cross-Resistance to Rifamycins on Methicillin-ResistantStaphylococcus aureus. Antimi-crob Agents Chemother. 1999; 43: 2813–2816. PMID:10543773
63. Fujimoto-Nakamura M, Ito H, Oyamada Y, Nishino T, Yamagishi J. Accumulation of Mutations in both
gyrBandparEGenes Is Associated with High-Level Resistance to Novobiocin inStaphylococcus aure-us. Antimicrob Agents Chemother. 2005; 49: 3810–3815. doi:10.1128/AAC.49.9.3810–3815.2005 PMID:16127057
64. Yoshida H, Bogaki M, Nakamura M, Nakamura S. Quinolone resistance-determining region in the DNA gyrasegyrAgene ofEscherichia coli. Antimicrob Agents Chemother. 1990; 34: 1271–1272. PMID: 2168148
65. Nikaido H. Multidrug Resistance in Bacteria. Annu Rev Biochem. 2009; 78: 119–146. doi:10.1146/ annurev.biochem.78.082907.145923PMID:19231985