CLINICAL SCIENCE
A negative expiratory pressure test during
wakefulness for evaluating the risk of obstructive
sleep apnea in patients referred for sleep studies
Salvatore Romano, Adriana Salvaggio, Anna Lo Bue, Oreste Marrone, Giuseppe InsalacoNational Research Council of Italy- Institute of Biomedicine and Molecular Immunology ‘‘A. Monroy’’, Palermo/Italy.
OBJECTIVE: Obstructive sleep apnea is characterized by increased upper airway collapsibility during sleep. The present study investigated the use of the negative expiratory pressure test as a method to rule out obstructive sleep apnea.
METHODS: Flow limitation was evaluated in 155 subjects. All subjects underwent a diurnal negative expiratory pressure test and a nocturnal sleep study. The severity of sleep apnea was determined based on the apnea-hypopnea index. Flow limitation was assessed by computing the exhaled volume at 0.2, 0.5, and 1.0 s (V0.2, V0.5, and V1.0, respectively) during the application of a negative expiratory pressure and expressed as a percentage of the previous exhaled volume. Receiver-operating characteristic curves were constructed to identify the optimal threshold volume at 0.2, 0.5, and 1.0 s for obstructive sleep apnea detection.
RESULTS: Mean expiratory volumes at 0.2 and 0.5 s were statistically higher (p,0.01) in healthy subjects than in all obstructive sleep apneic groups. Increasing disease severity was associated with lower expiratory volumes. The V0.2 (%) predictive parameters for the detection of sleep apnea were sensitivity (81.1%), specificity (93.1%), PPV (98.1%), and NPV (52.9%). Sensitivity and NPV were 96.9% and 93.2%, respectively, for moderate-to-severe obstructive sleep apnea, and both were 100% for severe obstructive sleep apnea.
CONCLUSION: Flow limitation measurement by V0.2 (%) during wakefulness may be a very reliable method to identify obstructive sleep apnea when the test is positive and could reliably exclude moderate and severe obstructive sleep apnea when the test is negative. The negative expiratory pressure test appears to be a useful screening test for suspected obstructive sleep apnea.
KEYWORDS: Sleep; Upper Airways; Respiratory Measurement; Screening Test.
Romano S, Salvaggio A, Lo Bue A, Marrone O, Insalaco G. A negative expiratory pressure test during wakefulness for evaluating the risk of obstructive sleep apnea in patients referred for sleep studies. Clinics. 2011;66(11):1887-1894.
Received for publication onMay 9, 2011;First review completed onMay 30, 2011;Accepted for publication onJuly 13, 2011 E-mail: [email protected]
Tel.: (+39) 0916809110
INTRODUCTION
Obstructive sleep apnea (OSA) is a risk factor for serious health problems, such as cardiovascular disease1 and postoperative complications,2and could have consequences for the safety of subjects because of decreased physical abilities.3-5 The under-recognition of OSA may result in important health and social costs6and reduce the quality of life of affected individuals.7 Obstructive sleep apnea is a disorder characterized by repetitive episodes of upper airway closure during sleep, and increased upper airway collapsibility is one of its main determinants.8
Studies have estimated that OSA, which is defined based on an apnea-hypopnea index of 5 and excessive daytime somnolence, may affect at least 2–4% of the middle-aged general population.9 Interestingly, preva-lence estimates are much higher when individuals are divided based on demographic variables, such as age, sex, and body mass index (BMI).10In certain subgroups of the population, such as obese subjects10-11 and profes-sional drivers,12 the prevalence of OSA may be higher than in the general population. OSA diagnostic proce-dures are expensive and time consuming, and studies have estimated that nearly 80% of men and 93% of women with moderate-to-severe sleep apnea are undiag-nosed.13
Although effective screening procedures could help in evaluating OSA risk, current screening criteria remain unsatisfactory. The identification of simple, noninvasive, predictive, and reliable tools to detect OSA would be useful in several fields.
Copyrightß2011CLINICS– This is an Open Access article distributed under
the terms of the Creative Commons Attribution Non-Commercial License (http:// creativecommons.org/licenses/by-nc/3.0/) which permits unrestricted non-commercial use, distribution, and reproduction in any medium, provided the original work is properly cited.
Negative expiratory pressure (NEP) is a noninvasive tool that was initially designed to evaluate flow limitation in patients with obstructive lung disease; however, Koulouris and coworkers have suggested that the flow limitation induced by the NEP application may also reflect upper airway collapsibility.14 NEP has been applied in subjects with obesity and/or OSA15-22 to evaluate whether NEP responses could predict OSA, and the results have been variable. Some studies15-20 have found that NEP flow-volume curves and quantitative indices during wakefulness are useful in the detection of upper airway collapsibility, whereas other studies21-22 have showed that the NEP technique appears to have limited usefulness as a clinical tool for the routine screening of OSA patients during wakefulness. The difference between these results could be related to the various flow-limitation measurements that were applied. Effective screening procedures could help to distinguish subjects with different probabilities of being affected by OSA. We have previously demonstrated the effectiveness of the NEP test in identifying increased upper airway collapsibility during tidal expiration in severe OSA patients.23 The aim of the present study was to evaluate whether the flow limitation induced by NEP during wakefulness could be a valuable method to detect subjects with mild or moderate OSA.
MATERIALS AND METHODS
The present study included 155 subjects (130 males and 25 females) who were referred to our sleep laboratory (we evaluated spirometry to exclude subjects with bronchial obstruction from the study). Patients with major cranio-facial or upper airway abnormalities and/or acute or known chronic pulmonary or neuromuscular disease were excluded from the study. The mean age of the subjects was 51¡11 years, and the mean BMI was 32.6¡7.1 kg/m2 (the BMI was $30 for 58.7% of the subjects). Pulmonary function tests were performed during the day using a MEDGRAPHICS E´lite plethysmograph (MEDGRAPHICS Corporation; St. Paul, Minnesota, USA). Each patient gave informed consent, and the study protocol was approved by the local ethical committee. All subjects underwent a diurnal NEP test and nocturnal monitoring using a portable cardio-respiratory system.24
Nocturnal monitoring was performed using a port-able computerized system (Somte` Compumedics Inc.;
Abbotsford, VIC, Australia). The recorded signals were airflow, snoring, thoracic effort, abdominal effort, limb movement, body position, electrocardiogram, arterial oxy-gen saturation, pulse rate, and pulse waveform. All were recorded for at least 6 h.
Polygraphic recordings were analyzed manually by scorers who were blinded to the results of the NEP test. Apneas were defined based on the lack of airflow or a.90% reduction in the airflow signal for at least 10 s. Hypopneas were defined based on a discernible drop in flow by$30% of the baseline value for a period lasting at least 10 s, followed by a $4% drop in SaO2.25 The apnea-hypopnea index (AHI) was calculated as the total number of apneas and hypopneas per hour of estimated total sleep time. Subjects with an AHI$5 were classified as having OSA, and subjects with an AHI,5 were classified as healthy. OSA severity was determined based on the AHI as mild (5#AHI
,15), moderate (15#AHI#30), or severe (AHI.30).
NEP test
NEP tests were performed in awake subjects at -10 cm H2O during the morning before the portable home monitor testing session. The NEP tests were performed while patients were in the sitting position with the neck in a neutral position and quietly breathing. All subjects were wearing a nose clip. The NEP test was performed as previously described.23A Super Air Amplifier (Exair model 120021 Cincinnati, Ohio, USA) was able to generate a range of negative pressures as compressed air was delivered through the device. Air was supplied by a tank of compressed air and controlled using an electrically operated solenoid valve (Norgren Ltd model 95004, Warwickshire, UK). The solenoid was automatically activated during early tidal expiration and kept open for 2 s by software control.
The Super Air Amplifier device was placed at the distal end of a pneumotachograph (Hans Rudolph model 3830; Kansas City, MO, USA), and mouth pressure was measured using a pressure transducer (PCLA0050, Sensortechnics GmbH, Puchheim, D). The signals recorded by the pneumotachograph and the mouth pressure transducer were filtered and digitized at 200 Hz. The volume was obtained by numerically integrating the airflow signal. Airflow and mouth pressure were displayed in real time on the computer screen and recorded for subsequent analysis. Signal analysis and solenoid valve control were performed using software developed in our laboratory using LabVIEW 8.2 (National Instruments; Austin, TX, USA).
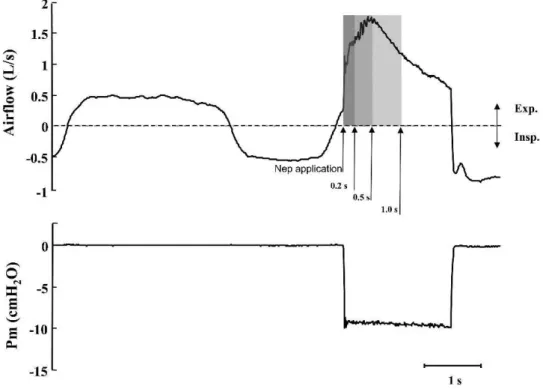
The NEP of –10 cm H2O was set by occluding the pneumotachograph with a stopper and adjusting the flow of the compressed air to the air amplifier. NEP application during tidal expiration could produce a sudden and variable flow reduction that was dependent on upper airway narrowing. Flow limitation was evaluated by measuring the expired volume at 0.2, 0.5, and 1.0 s (V0.2, V0.5, and V1.0, respectively) immediately after NEP applica-tion (Figure 1). We waited for at least four regular breaths (as observed by visual inspection of the flow signal on the computer screen) between consecutive NEP applications.
All subjects underwent seven NEP applications, and a minimum of four valid measures of expiratory volumes at 0.2, 0.5, and 1.0 s were averaged for each subject. These values were expressed as the percent of the mean expiratory volumes of the three breaths preceding each NEP applica-tion. Measured volumes at 0.2, 0.5, and 1.0 s were only accepted under regular breathing conditions (i.e., the differences between inspiratory and expiratory volumes for each of the three breaths before each NEP application were less than 10%).
Statistical analysis
Data are reported as means¡SD. Ap-value of,0.05 was considered significant. Differences between healthy and OSA subjects with different severity were evaluated using the Tukey-Kramer test. Logistic regression for the analysis of continuous factors with categorical responses was applied. Receiver-operating characteristic (ROC) curves were constructed to determine the optimal V0.2 (%), V0.5 (%), and V1.0(%) threshold values for OSA detection. We also calculated sensitivity, specificity, and positive (PPV) and negative predictive values (NPV) at various levels of the measured volumes. A ROC curve was also constructed
NEP test to evaluate OSA risk
for BMI. Statistical analysis was performed using the commercial software JMP 8.0.1 (SAS Institute Inc., Cary, NC, USA).
RESULTS
All subjects had normal forced expiratory flow volume loops (FVC 99¡16%, FEV199¡16%, and FEF25-7588¡27% of the predicted values, respectively).
The entire spectrum of OSA severity was represented in the study population. Nocturnal monitoring showed a mean AHI of 32¡28 events/h in the study population.
Table 1 shows the anthropometric and respiratory characteristics of the healthy and OSA subjects with different degrees of severity.
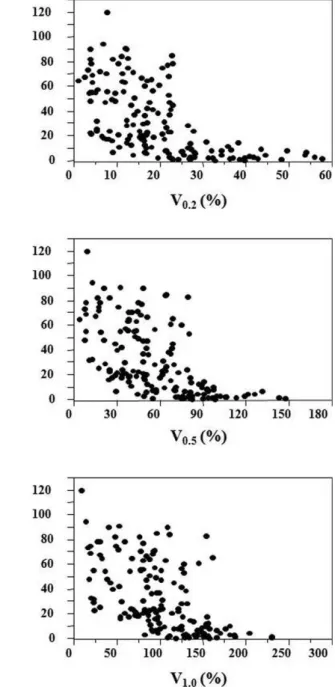
The mean NEP test results for V0.2(%), V0.5(%), and V1.0 (%) in the study population were 19.4¡12.2%, 56.4¡29.9% and 100.4¡46.0%, respectively. The relationships between
AHI and V0.2 (%), V0.5 (%), and V1.0 (%) are shown in Figure 2.
Figure 3 shows the mean expiratory volumes at V0.2(%), V0.5 (%), and V1.0 (%) for the healthy subjects and the subjects in the three different OSA severity groups. Exhaled V0.2 (%) and V0.5 (%) volumes were significantly lower (p,0.01) in all OSA severity groups, than in healthy subjects. The exhaled V1.0(%) volume, however, was only significant for the healthy subjects compared with the moderate and severe OSA subjects. The expiratory volumes were associated with disease severity (i.e., the expiratory volume decreased as disease severity increased), and the highest volumes were found in the healthy subjects.
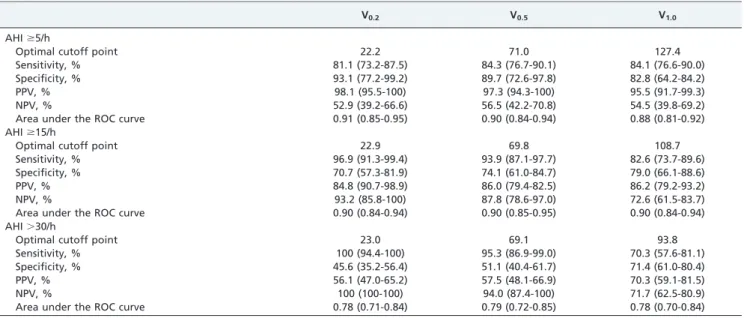
A ROC curve analysis was applied to evaluate the predictive effectiveness of V0.2(%), V0.5(%), and V1.0 (%) for OSA subjects with AHI$5, AHI$15 and AHI.30. The predictive parameters for V0.2(%), V0.5(%), and V1.0(%) are reported in Table 2. Interestingly, V1.0 (%) was the least
Figure 1 - Negative expiratory pressure (NEP) application during tidal expiration. Airflow and mouth pressure (Pm) during tidal respiration and NEP application. The hatched areas under the flow curve measure the expired volume at 0.2 s (V0.2), 0.5 s (V0.5), and 1.0 s (V1.0) after NEP application. Insp: inspiration; Exp: expiration.
Table 1 -Anthropometric and respiratory data of the subjects arranged by AHI.
Variables
AHI,5/h (n = 29)
5#AHI,15/h (n = 28)
15#AHI#30/h (n = 34)
AHI.30/h (n = 64)
Age (y) 41¡12 56¡9* 53¡10* 53¡11*
BMI (kg/m2) 27.5¡3.5 29.9¡5.7 34.5¡7.71 35.1¡7.1*
Neck circumference (cm) 39.5¡2.8 40.2¡3.0 42.6¡3.61
43.7¡4.1*
AHI (events/h) 2.0¡1.4 9.1¡2.8* 21.4¡3.8* 61.1¡18.4*
FVC (% predicted) 100¡14 100¡14 99¡15 96¡18
FEV1(% predicted) 105¡15 100¡15 99¡15 96¡8
FEF25-75(% predicted) 96¡23 86¡27 88¡30 86¡28
BMI = body mass index; AHI = apnea-hypopnea index; FVC = forced vital capacity; FEV1= forced expiratory volume in one second; FEF25-75= forced
expiratory flow 25-75%.
Values are presented as the means¡SD.
*
p,0.0001, 1
effective volume parameter in distinguishing between healthy and OSA subjects. V0.2(%) identified subjects with AHI$15 and.30 (i.e., moderate-to-severe OSA) with very high sensitivity and identified subjects with an AHI,5 (i.e., healthy subjects) with very high specificity. A negative test result indicated 100% probability of having an AHI not exceeding 30, 93.2% probability of having an AHI not exceeding 15, but an equal probability of being healthy or having mild OSA. A positive test result indicated 98% probability of having an AHI $5, 84.8% probability of having an AHI$15 and 56.1% probability of having an AHI
.30. Thus, the measurement of flow limitation using V0.2 (%), which was determined using NEP, was an effective predictor of OSA.
The ROC curve analysis applied to the BMI measure-ments showed that BMI was significantly less reliable
(p,0.007) than V0.2 (%) in discriminating OSA subjects. The areas under the ROC curves for BMI and V0.2(%) were 0.79 (95% CI: 0.72 to 0.85) and 0.91 (95% CI: 0.85 to 0.95), respectively.
Figure 4 illustrates the relationship between AHI and V0.2 (%) graphically. The optimal cutoff point to discriminate subjects with an AHI.30 was 23%, and only five subjects with values of V0.2lower than 23% (positive for OSA) were healthy. No subject with a V0.2 value higher than 23% (negative for OSA) had severe OSA. Only three subjects with a V0.2value higher than 23% had moderate OSA, and 15 subjects had mild OSA (1.9 and 9.6%, respectively).
DISCUSSION
The present study verified the efficacy of the flow limitation induced by NEP and evaluated by V0.2(%), V0.5 (%) and V1.0(%) as a screening tool to detect OSA risk. Our results indicated that the V0.2(%) parameter is more sensitive in detecting patients with moderate and severe OSA. V0.2(%) identified subjects with moderate and severe OSA with very high sensitivity and identified healthy subjects with very high specificity. When the NEP test was negative for OSA, there was a high probability that the subject did not have moderate or severe OSA. When the test was positive, most OSA subjects (AHI$5) were identified. For a positive test, the predictive value to identify OSA was very high, but the predictive value for distinguishing severity was lower. Conversely, a negative test was predictive of subjects who did not have moderate and severe OSA. Thus, the measure-ment of flow limitation by V0.2 (%) induced by NEP is a valuable predictor for OSA and can reliably distinguish between OSA and healthy subjects.
Obesity and increased upper airway collapsibility are considered two of the most important determinants of OSA. Previous studies regarding obese male subjects have shown that at least 40% are affected by OSA.26-27Because obesity is considered to be a major cause of OSA, we compared the ROC curve for V0.2(%) induced by NEP to the ROC curve for BMI to identify OSA subjects. The V0.2(%) curve had better discriminatory power than BMI, which agreed with the supposition that collapsibility is the main mechanism of upper airway obstruction during sleep.
It is important to heighten public awareness regarding the potential hazards and health risks that surround untreated sleep apnea.1-7,28-34 In addition, certain groups of indivi-duals, such as commercial drivers, need to realize that OSA is dangerous to them and to others. Physicians and the general population are widely aware of the potentially deleterious effects of OSA on an individual patient’s health and wellbeing, and there is even increasing awareness among public administrators of the traffic hazards and accidents at work that are linked to untreated OSA. Many patients who present for surgical procedures may have undiagnosed OSA, despite an improved awareness and increased frequency of diagnosis.29-31 Untreated OSA patients are known to have higher incidences of difficult intubation, postoperative complications, increased intensive care unit admissions, and longer hospital stays.32 Several case reports have documented an increase in the incidence of postoperative complications and deaths among patients suspected of having OSA.33-34In previous studies, 24% of patients with OSA had significant postoperative complica-tions, compared with 9% of the patients in the control
Figure 2 -The relationships between AHI and V0.2(%), V0.5(%), and V1.0(%).
NEP test to evaluate OSA risk
Figure 3 -Expiratory volumes of each subject at 0.2, 0.5, and 1.0 s expressed as the % of the mean expiratory volume of the three breaths preceding NEP application for healthy subjects and subjects from the 3 OSA severity groups. The means and SD are shown. NS: not significant,*
p,0.0001,1
p,0.003,#
group.29,30Identifying patients at risk for OSA is the first step in preventing postoperative complications due to OSA. Polysomnography is the gold standard for diagnosis of OSA, but increasing awareness of the importance of identifying patients with OSA has increased the waiting lists for diagnosis and proper treatment. Nevertheless, it would take several years to satisfy the current requirement for polysomnography in the general population with existing resources.35The use of portable monitoring devices for the diagnosis of OSA would probably not be sufficient to overcome the growing demand for diagnostic testing.36 Although sleep recordings are mandatory for OSA diag-nosis, it would be useful to identify simple, reliable and inexpensive screening methods for physicians to detect subjects who are more likely to be at risk for upper airway obstruction.
A highly sensitive and positive predictive screening tool with an acceptable specificity and negative predictive ability is a basic requirement when screening patients for a disease that has an important impact on health. OSA screening tests have demonstrated considerable variability in predictive ability, which depends on the screening tool, the patient population, and the OSA severity. An OSA screening questionnaire that was tested in patients from sleep centers resulted in 70% to 93% sensitivity.37-41 Ross et al.42 published a meta-analysis of screening tests for OSA in 2000 and found that a lack of discriminatory analysis makes it difficult to recommend an evidence-based choice of tests for preoperative screening. In addition, the Berlin ques-tionnaire41 has shown varied results that depend on the patient population studied. For example, the sensitivity was 86% in primary care patients40 and 57-68% in sleep laboratory patients.43
Previous studies have used different methods to evaluate the flow limitation induced by NEP during wakefulness and assess upper airway collapsibility in OSA and healthy subjects.14-22Some studies have applied methods that were the same as those adopted for the evaluation of flow limitation in patients with bronchial obstruction,14whereas others have introduced new methods to evaluate upper airway obstruction.15-22The various methods have demon-strated that NEP can play a role in the identification of upper airway flow limitation without reaching entirely satisfactory discriminatory levels. Ferretti et al.21evaluated flow limitation by measuring the expiratory volume at 0.5 and 1.0 s after NEP application and concluded that the NEP test appears to have a limited usefulness as a clinical tool for routine screening. In addition, Van Meerhaeghe et al.17 expressed the expiratory flow limitation as the percentage of the expired tidal volume over which the NEP-induced flow did not exceed the spontaneous flow, and they concluded that NEP may be useful in predicting OSA with AHI$15 in a clinic-based population (the sensitivity was 81.9% and the specificity was 69.1%). Tamisier et al.20 used the ratio between the areas under the curves of the NEP flow-volume loop and the spontaneous flow-volume loop and reported that the quantitative index was higher in healthy subjects than in patients with any type of breathing-related sleep disorder (the predictive positive value was 96.6% and the predictive negative value was 76.9%). Subjects with breath-ing-related sleep disorders and healthy subjects exhibited significant differences, there was a trend toward a lower quantitative index in patients with severe OSA who exhibited greater expression of a collapsible upper airway. Subjects with mild OSA, however, were not included in this study. In our study, we measured the expiratory volume
Table 2 -Receiver-operating characteristic curve analysis for NEP volume at V0.2,V0.5, and V1.0.
V0.2 V0.5 V1.0
AHI$5/h
Optimal cutoff point 22.2 71.0 127.4
Sensitivity, % 81.1 (73.2-87.5) 84.3 (76.7-90.1) 84.1 (76.6-90.0)
Specificity, % 93.1 (77.2-99.2) 89.7 (72.6-97.8) 82.8 (64.2-84.2)
PPV, % 98.1 (95.5-100) 97.3 (94.3-100) 95.5 (91.7-99.3)
NPV, % 52.9 (39.2-66.6) 56.5 (42.2-70.8) 54.5 (39.8-69.2)
Area under the ROC curve 0.91 (0.85-0.95) 0.90 (0.84-0.94) 0.88 (0.81-0.92) AHI$15/h
Optimal cutoff point 22.9 69.8 108.7
Sensitivity, % 96.9 (91.3-99.4) 93.9 (87.1-97.7) 82.6 (73.7-89.6)
Specificity, % 70.7 (57.3-81.9) 74.1 (61.0-84.7) 79.0 (66.1-88.6)
PPV, % 84.8 (90.7-98.9) 86.0 (79.4-82.5) 86.2 (79.2-93.2)
NPV, % 93.2 (85.8-100) 87.8 (78.6-97.0) 72.6 (61.5-83.7)
Area under the ROC curve 0.90 (0.84-0.94) 0.90 (0.85-0.95) 0.90 (0.84-0.94) AHI.30/h
Optimal cutoff point 23.0 69.1 93.8
Sensitivity, % 100 (94.4-100) 95.3 (86.9-99.0) 70.3 (57.6-81.1)
Specificity, % 45.6 (35.2-56.4) 51.1 (40.4-61.7) 71.4 (61.0-80.4)
PPV, % 56.1 (47.0-65.2) 57.5 (48.1-66.9) 70.3 (59.1-81.5)
NPV, % 100 (100-100) 94.0 (87.4-100) 71.7 (62.5-80.9)
Area under the ROC curve 0.78 (0.71-0.84) 0.79 (0.72-0.85) 0.78 (0.70-0.84)
Data are presented as the means (95% confidence interval). AHI = Apnea-hypopnea index;
PPV = positive predictive value; NPV = negative predictive value; ROC = receiver operating characteristic; V0.2= volume for 200 ms after NEP application;
V0.5= volume for 500 ms after NEP application;
V1.0= volume for 1 s after NEP application.
NEP test to evaluate OSA risk
(expressed as the percent of the mean expiratory volume of the three breaths preceding NEP application) at the very beginning of expiration (V0.2), at 0.5 s (V0.5), and at 1.0 s (V1.0) in a large sample of subjects and showed that V0.2and V0.5were predictive of OSA (V1.0was less useful). The NEP test may provide an objective assessment to identify patients at high risk for OSA and could be widely applied to reduce socioeconomic impact of this disease.
This investigation was limited by the various anthropo-metric characteristics of the different groups. In addition, we only enrolled subjects who had attended a sleep laboratory, and these subjects may not represent the general population. Importantly, the present study included sub-jects who represented the entire spectrum of disease severity, which prevented the exaggeration of diagnostic accuracy that could occur when a diagnostic test is evaluated in a sample with a limited severity spectrum.44
In conclusion, the evaluation of flow limitation during wakefulness using the NEP technique was predictive of OSA. The NEP test was able to reliably discriminate among subjects who had an AHI$5 and subjects who had an AHI ,15. The NEP test could be adopted as a screening test for the evaluation of suspected OSA patients because it appears to be a very reliable diurnal test that can objectively predict OSA. The NEP test may be even more useful when combined with anamnestic data, such as the symptoms of snoring and hypersomnolence. Further studies should be performed to evaluate whether OSA can be screened using NEP in the general popula-tion. The measurement of flow limitation based on V0.2 (%) during wakefulness may be a very reliable method to identify healthy subjects when the test is negative and subjects with OSA when the test is positive. Further data are required to determine the operating characteristics of the technique for OSA screening in patients who are awake.
ACKNOWLEDGEMENTS
The authors are indebted to Dr. Pietro Abate and Mr. Giovanni Sciortino for their technical support.
This study was supported by the Italian National Research Council grant number ME.P01.006.
AUTHOR CONTRIBUTIONS
Romano S and Insalaco G were responsible for the design and coordination of the study, statistical analysis, preparation and approval of the final version of the manuscript. Salvaggio A was responsible for the design of the study, recruitment and clinical care of subjects, compilation of database, revision and approval of the final version of the manuscript. Lo Bue A was responsible for the recruitment of subjects, compilation of database, reading and approval of the final version of manuscript. Marrone O was responsible for the recruitment, revision and approval of the final version of the manuscript.
REFERENCES
1. Somers VK, White DP, Amin R, Abraham WT, Costa F, Culebras A, et al. Sleep apnea and cardiovascular disease. Circulation. 2008;118: 1080-111.
2. Chung SA, Yuan H, Chung F. A systemic review of obstructive sleep apnea and its implications for anesthesiologists. Anesth Analg. 2008; 107:1543-63.
3. Sassani A, Findley LJ, Kryger M, Goldlust E, George C, Davidson TM. Reducing motor-vehicle collisions, costs, and fatalities by treating obstructive sleep apnea syndrome. Sleep. 2004;27:453-8.
4. Lindberg E, Carter N, Gislason T, Janson C. Role of snoring and daytime sleepiness in occupational accidents. Am J Respir Crit Care Med. 2001;164:2031-5.
5. Kim HC, Young T, Matthews CG, Weber SM, Woodward AR, Palta M. Sleep-disordered breathing and neuropsychological deficits. A popula-tion-based study. Am J Respir Crit Care Med. 1997;156:1813-9. 6. Smith R, Ronald J, Delaive K, Walld R, Manfreda J, Kryger MH. What are
obstructive sleep apnea patients being treated for prior to this diagnosis? Chest. 2002;121:164-72.
7. Flemons WW, Tsai W. Quality of life consequences of sleep-disordered breathing. J Allergy Clin Immunol. 1997;99:S750-6.
8. Fogel RB, Malhotra A, White DP. Sleep. 2: pathophysiology of obstructive sleep apnoea/hypopnoea syndrome. Thorax. 2004;59:159-63.
9. Young T, Palta M, Dempsey J, Skatrud J, Weber S, Badr S. The occurrence of sleep-disordered breathing among middle-aged adults. N Engl J Med. 1993;323:1230–5.
10. Young T, Peppard PE, Gottlieb DJ. Epidemiology of obstructive sleep apnea: a population health perspective. American Journal of Respiratory and Critical Care Medicine. 2002;165:1217–39.
11. Stradling JR, Crosby JH. Predictors and prevalence of obstructive sleep apnoea and snoring in 1001 middle aged men. Thorax 1991;46: 85–90. 12. Pack AI, Dinges DF, Maislin G. A study of the prevalence of sleep apnea
among commercial truck drivers. Washington: FMCSA;2002. Publication No. DOT-RT-02–030.
13. Young T, Evans L, Finn L, Palta M. Estimation of the clinically diagnosed proportion of sleep apnea syndrome in middle-aged men and women. Sleep. 1997;20:705-6.
14. Koulouris NG, Valta P, Lavoie A, Corbeil C, Chasse´ M, Braidy J, et al. A simple method to detect expiratory flow limitation during spontaneous breathing. Eur Respir J. 1995;8:306-13.
15. Liistro G, Veriter C, Dury M, Aubert G, Stanescu D. Expiratory flow-limitation in awake sleep-disordered breathing subjects. Eur Respir J. 1999;14:185-90.
16. Verin E, Tardif C, Portier F, Similowski T, Pasquis P, Muir JF. Evidence for expiratory flow limitation of extrathoracic origin in patients with obstructive sleep apnoea. Thorax. 2002;57:423-8.
17. Van Meerhaeghe A, Delpire P, Stenuit P, Kerkhofs M. Operating characteristics of the negative expiratory pressure technique in predict-ing obstructive sleep apnoea syndrome in snorpredict-ing patients. Thorax. 2004;59:883-8.
18. Baydur A, Wilkinson L, Mehdian R, Bains B, Milic-Emili J. Extrathoracic expiratory flow limitation in obesity and obstructive and restrictive disorders. Chest. 2004;125:98-105.
19. Insalaco G, Romano S, Marrone O, Salvaggio A, Bonsignore G. A new method of negative expiratory pressure test analysis detecting upper airway flow limitation to reveal obstructive sleep apnea. Chest. 2005; 128:2159-65.
20. Tamisier R, Wuyam B, Nicolle I, Pe´pin JL, Orliaguet O, Perrin CP, et al. Awake flow limitation with negative expiratory pressure in sleep disordered breathing. Sleep Med. 2005;6:205-13.
21. Ferretti A, Giampiccolo P, Redolfi S, Mondini S, Cirignotta F, Cavalli A, et al. Upper airway dynamics during negative expiratory pressure in apneic and non-apneic awake snorers. Respir Res. 2006;7:54-63. 22. Guillot M, Costes F, Sforza E, Maudoux D, Bertoletti L, Barthe´le´my JC,
et al. Is tidal expiratory flow limitation predictive of sleep-related disorders in the elderly? Eur Respir J. 2010;36:842-8.
23. Romano S, Salvaggio A, Pastrello Hirata R, Lo Bue A, Picciolo S, et al. Upper airway collapsibility evaluated by a negative expiratory pressure test in severe obstructive sleep apnea. Clinics. 2011;66:567-72. 24. Collop NA, Anderson WM, Boehlecke B, Claman D, Goldberg R, Gottlieb
DJ, et al. Portable Monitoring Task Force of the American Academy of Sleep Medicine: Clinical guidelines for the use of unattended portable monitors in the diagnosis of obstructive sleep apnea in adult patients. J Clin Sleep Med. 2007;3:737-47.
25. Iber C, Ancoli-Israel S, Chesson A, Quan S. For the American Academy of Sleep Medicine. 1st ed. Westchester: IL: American Academy of Sleep Medicine; 2007. The AASM manual for the scoring of sleep and associated events: rules, terminology and technical specifications.
26. Vgontzas AN, Tan TL, Bixler EO, Martin LF, Shubert D, Kales A. Sleep apnea and sleep disruption in obese patients. Arch Intern Med. 1994; 154:1705-11.
27. Resta O, Foschino-Barbaro MP, Legari G, Talamo S, Bonfitto P, Palumbo A, et al. Sleep-related breathing disorders, loud snoring and excessive daytime sleepiness in obese subjects. Int J Obes Relat Metab Disord. 2001;25:669-75.
28. Neves C, Tufik S, Chediek F, Poyares D, Cintra F, Roizenblatt M, et al. Effects of sildenafil on autonomic nervous function during sleep in obstructive sleep apnea. Clinics. 2010;65:393-400.
29. Boushra NN. Anaesthetic management of patients with sleep apnoea syndrome. Can J Anaesth. 1996;43:599-616.
30. Gupta RM, Parvizi J, Hanssen AD, Gay PC. Postoperative complications in patients with obstructive sleep apnea syndrome undergoing hip or knee replacement: A case-control study. Mayo Clin Proc. 2001;76:897-905. 31. Reeder MK, Muir AD, Foex P, Goldman MD, Loh L, Smart D.
Postoperative myocardial ischaemia: Temporal association with noctur-nal hypoxaemia. Br J Anaesth. 1991;67:626-31.
32. Gupta RM, Parvizi J, Hanssen AD, Gay PC. Postoperative complications in patients with obstructive sleep apnea syndrome undergoing hip or knee replacement: A case-control study. Mayo Clin Proc. 2001;76:897-905.
33. Lofsky A. Sleep apnea and narcotic postoperative pain medication: A morbidity and mortality risk. Anesth Patient Safety Found Newsletter. 2002;17:24-25.
34. Hwang D, Shakir N, Limann B, Sison C, Kalra S, Shulman L, et al. Association of sleep-disordered breathing with postoperative complica-tions. Chest. 2008;133:1128-34.
35. Flemons WW, Douglas NJ, Kuna ST, Rodenstein DO, Wheatley J. Access to diagnosis and treatment of patients with suspected sleep apnea. Am J Respir Crit Care Med. 2004;169:668-72.
36. Littner MR. Portable monitoring in the diagnosis of the obstructive sleep apnea syndrome. Semin Respir Crit Care Med. 2005;26:56-67.
37. Kapuniai LE, Andrew DJ, Crowell DH, Pearce JW. Identifying sleep apnea from self-reports. Sleep. 1988;11:430-6.
38. Douglass AB, Bornstein R, Nino-Murcia G, Keenan S, Miles L, Zarcone VP Jr, et al. The Sleep Disorders Questionnaire: I. Creation and multivariate structure of SDQ. Sleep. 1994;17:160-7.
39. Roth T, Zammit G, Kushida C, Doghramji K, Mathias SD, Wong JM, et al. A new questionnaire to detect sleep disorders. Sleep Med 2002;3: 99-108. 40. Ramachandran SK, Josephs LA. A Meta-analysis of Clinical Screening
Tests for obstructive sleep apnea. Anesthesiology. 2009;110:928-39. 41. Netzer NC, Stoohs RA, Netzer CM, Clark K, Strohl KP. Using the Berlin
questionnaire to identify patients at risk for the sleep apnea syndrome. Ann Intern Med. 1999;131:485-491.
42. Ross SD, Sheinhait IA, Harrison KJ, Kvasz M, Connelly JE, Shea SA, et al. Systematic review and meta-analysis of the literature regarding the diagnosis of sleep apnea. Sleep. 2000;23:519-32.
43. Ahmadi N, Chung SA, Gibbs A, Shapiro CM. The Berlin questionnaire for sleep apnea in a sleep clinic population: Relationship to polysomno-graphic measurement of respiratory disturbance. Sleep Breath. 2008;12:39-45.
44. Knottnerus JA, Leffers P. The influence of referral patterns on the characteristics of diagnosis tests. J Clin Epidemiol. 1992;45:1143-54.
NEP test to evaluate OSA risk