AR
TICLE
1 Faculdade de Medicina, Universidade Federal de Minas Gerais (UFMG). Av. Alfredo Balena 190, Funcionários. 30130-100 Belo Horizonte MG Brasil.
[email protected] 2 Faculdade da Saúde e Ecologia Humana. Vespasiano MG Brasil. 3 Centro de Pesquisas René Rachou, Fiocruz. Belo Horizonte MG Brasil. 4 Faculdade de Filosofia e Ciências Humanas, UFMG. Belo Horizonte MG Brasil.
Socioeconomic position and disability:
“The Belo Horizonte, Brazil Health Study”
Abstract This study aims to investigate the as-sociation of socioeconomic status and comorbidi-ties of self-reported disability. Data were obtained from a population survey in Belo Horizonte from 2008 to 2009. The sample was probabilistic and stratified by conglomerates in three stages: census tracts, households and individuals. The outcome variable was disability, defined by the self-repor-ted problems in bodily functions or structures. The explanatory variables were gender, age, sel-f-reported morbidity and socioeconomic status index that included variables mother and res-pondent schooling and household income. The factorial analysis was used to evaluate the socioe-conomic status index and logistic regression. The prevalence of disability was 10.43% (95% CI: 9.1-11.7%). Self-reported disability was associa-ted with age (OR = 1.02; 95% CI: 1.01-1.03) and reporting of two or more diseases (OR = 3.24; CI 95%; 2.16-4.86) and socioeconomic status index (OR = 0.96; 95% CI: 0.95-0.97). The worse socio-economic status and occurrence of diseases appear to contribute to the occurrence of disability. These results show health inequities among people with disabilities, and BPC relevance supporting
vulne-rable populations.
Key words People with disabilities,
Socioeco-nomic status, Prevalence, Continuous Cash Benefit (BCP)
Mônica Faria Felicíssimo 1
Amélia Augusta de Lima Friche 1
César Coelho Xavier 2
Fernando Augusto Proietti 3
Jorge Alexandre Barbosa Neves 4
Waleska Teixeira Caiaffa 1
Fe
licíssimo MF Introduction
The theme about people with disabilities has gained prominence in studies on public health and national policies, caused by the keen inter-est of researchers, the increased prevalence of in-dividuals with this health condition and by the poor socioeconomic condition faced by people with disabilities when compared to the general population1-3. More recently, accelerated popu-lation aging and increasing numbers and sever-ity of chronic diseases2,4 have greatly affected the higher prevalence of disability and greater inter-est in the subject.
The 2015 National Health Survey (PNS)1 es-timated the prevalence of disability in Brazil at 6.2%, a percentage below the 2010 census2, of 24%. Different concepts of disability explain the discrepancy between reported prevalence and the difficulty of comparing surveys5.
Socioeconomic status represented by income and schooling has been associated with several health problems. It reflects different realms of the life-cycle context, ranging from childhood to adulthood and old age6,7. While education pre-cedes the occurrence of health problems, because it is determined early in life, income is deter-mined by educational level and influences health by directly affecting access to material resources8.
According to the theoretical model of the course of life, the poor health condition of in-dividuals can be partly attributed to the low so-cioeconomic status of parents during the initial phase of the life cycle, childhood and adolescence, associated to the increased risk of cardiovascular and respiratory diseases, diabetes and functional disability in adult life7,9,10.
An inverse association has been consistently described between mother’s level of education and prevalence of disability; as the level of moth-er’s schooling decreases, the odds of disability increase progressively9,10. Mothers with better schooling are more likely to provide the neces-sary care for their children, higher income, great-er access to information, increased use of health services and are less exposed to risk factors such as alcohol consumption, drug use and sedentary lifestyle9.
Studies have shown that individuals with dis-abilities and with greater socioeconomic depri-vation have a high prevalence of comorbidities, lower access to health services and rehabilitation, which increases health inequities11-18. These stud-ies already provide some evidence of the rele-vance of social policies focused on populations
with a high level of vulnerability, such as those with disabilities.
To date, few Brazilian studies have been found, mainly population-based, which inves-tigated the association of socioeconomic status and self-reported diseases with the presence of disability5,12,13,19.
Disability, social policies and poverty
Social welfare policies aimed at social devel-opment from reduced poverty and inequality have settled on the political agenda of Western Hemisphere countries since the beginning of the twentieth century20-22. In Brazil, social wel-fare policies have been implemented since the 1930s. The most striking case of that decade was the Consolidation of Labor Laws (CLT), which implemented a series of worker protection ben-efits in Brazil. However, in addition to the cor-poratist element, the moments of rupture of the democratic rule of law represented threats and obstacles to the development of Brazilian social welfare policies22.
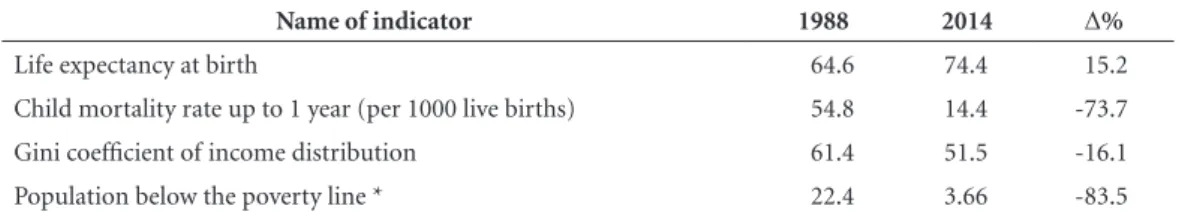
As shown by Marshall23, the democratic re-gime is a precondition for the development of social welfare policies – although, as well pointed out by Esping-Andersen20,21, it is not a sufficient cause. Andersen argues that, for the development of social welfare, historical experience shows that a leftist party or coalition should govern for a good period of time (at least a decade). This would have occurred both in the US (in the New Deal period of Franklin Roosevelt) and in Euro-pean countries (with Labor in the United King-dom and with Social Democrats and Socialists in continental Europe). It is no coincidence that only with the 1988 Federal Constitution, which resulted from the country’s re-democratization process, after more than two decades of author-itarian rule, Brazil experienced once again new advances in social welfare policies. Table 1 shows some important social development indicators for the period 1988-2014 as well as the change that occurred in the period. It is observed that, since the 1988 Federal Constitution (FC-88), Brazil has undergone an important process of social development, with improved health (in particular reduced child mortality), inequality and poverty indicators.
e C
ole
tiv
a,
22(11):3547-3556,
2017
anticipated an important feature of the new Bra-zilian social policies – targeting. Like the BPC, the most important social policies that have emerged in the past decade – such as the Family Grant Program (PBF) – are targeted by means testing measures based on per capita household income. This characteristic of the new Brazilian social welfare policies is often identified as a neoliber-al approach to socineoliber-al policies, but it is neoliber-also often seen as an intermediary between the traditional (Keynesian) model of well-being and the neolib-eral model. Regarding this intermediate model, Esping-Andersen21 points out that: “While some perception of this trade-off between equality and efficiency has always dominated debates on social policy, there is a broad consensus, in the last few decades, that the Keynesian welfare state provid-ed a positive sum solution. Today, few people are optimistic about finding an unproblematic “third way”. Even so, many of the countries we studied pursue strategies designed to mediate or soften this trade-off. A group represented by Australia and Canada combines liberalization and change towards greater selectivity and targeting with a concomitant expansion of benefits to the most vulnerable. This selective approach is broad and aims at security against abject misery and severe inequalities. Comparative data on income and poverty suggest that such a strategy is somehow successful, at least compared to the United States. These countries enjoyed employment perfor-mance that equals the US, but without alarming impoverishment rates” (our emphasis).
The BPC and the new social welfare policies in Brazil follow precisely this model of selectiv-ity and targeting, seeking to extend the benefits to the most vulnerable and, thus, to eliminate extreme poverty24,25. The BPC was evidenced by the FC-88, in its Art. 203. Costa et al.26 state the following on this matter: “Article 203 of the FC-88 establishes the protection of family, materni-ty, childhood, adolescence, old age and persons
with disabilities, regardless of contribution to social security. It assures to the last two segments a monthly benefit of a minimum wage if they are unable to cater for their own livelihood or have it provided by their families. [...] The BPC was established to transfer income to elderly people and people with disabilities, integrating the Basic Social Protection within the Unified Social Wel-fare System – SUAS”.
Beneficiaries are not all elderly and people with disabilities. The definition of who should be the beneficiary occurs through a means test pro-cedure based on per-capita household income (beneficiaries must be members of families with incomes less than 1/4 of the minimum wage). BPC was implemented in the 1990s based on a biomedical model of disability identification26,27. However, as Costa et al.26 emphasize: “In 2001, the proposed social paradigm for approaching disability and incapacity became effective at the international level with the dissemination by WHO of the International Classification of Functioning, Disability and Health (ICF). ICF encompasses the rehabilitation practice, the idea of social inclusion and the promotion of well-be-ing. In Brazil, despite these advances, the criteria for granting BPC remained subject to the bio-medical orientation until the end of the 2000s”.
In the second half of the last decade – more specifically from Decree Nº 6.214/2007, followed by Joint Ordinance MDS/INSS No. 1, dated 29/05/2009 – the disability assessment criterion for eligibility to BPC started to be based on ICF’s biopsychosocial model. While a very significant proportion of BPC beneficiaries have only been able to gain access to the program through the judicial system26, it is clear that the normative improvements of this public policy have created a very relevant program for the social protection of one of the most vulnerable population strata: people with disabilities belonging to families liv-ing in poverty.
Table 1. Social development indicators, 1988 and 2014.
Name of indicator 1988 2014 Δ%
Life expectancy at birth 64.6 74.4 15.2
Child mortality rate up to 1 year (per 1000 live births) 54.8 14.4 -73.7
Gini coefficient of income distribution 61.4 51.5 -16.1
Population below the poverty line * 22.4 3.66 -83.5
Source: World Bank.
Fe
licíssimo MF Thus, this study aims mainly to bring new
empirical foundations based on multivariate sta-tistical analysis to demonstrate the association between poverty and disability. More specifical-ly, we aim to evaluate whether the low socioeco-nomic status and higher frequency of the disease are associated with higher prevalence of self-re-ported disability between the adult and elderly individuals living in an urban center. Evidence of this association reinforces the relevance of BPC as an intermediary social welfare policy based on means testing focused on protecting an extreme-ly vulnerable segment of the population.
Methodology
Design and sample
This is a cross-sectional study, part of the “The BH Health Study” Household Survey, con-ducted by the Belo Horizonte Urban Health Ob-servatory of UFMG, Minas Gerais, Brazil, in two of the nine health districts of Belo Horizonte, namely, Oeste and Barreiro, from 2008 to 2009. This is a probabilistic and stratified sampling in conglomerates in three stages: census tract, household and individual. To ensure the same proportionality of residents at all socioeconomic levels, the study area was subdivided into stra-ta, according to the Health Vulnerability Index (HVI) and the categories of territorial vulnera-bility used by the Municipal Health Secretariat (SMS): low (< 2.33), average (2.33-3.32), high (3.33-4.31) and very high (> 4.31)28. We sampled 149 census tracts. Of these, 5,171 households were eligible with residents accessed; there were refusals (n = 628), interviews with issues (n = 35) and interviews scheduled, but not completed af-ter three trials (n = 46). The proportion of losses was 13.7%, resulting in 4,048 households. In each household, an adult resident (≥ 18 years old) was randomly selected to answer the questionnaire to previously trained interviewers after a pilot study. More detailed information on this survey can be found in other publications29,30.
Variable “Response”
Disability defined from the self-reported “problems in the functions or structures of the body, such as significant deviation or loss”31, was operationalized through the question: “Do you
have any limitations, difficulty or disability (ei-ther motor, visual, hearing or o(ei-ther)?” Responses were coded as NO (no disability) and YES (with disability).
Explanatory variables
Composition of the socioeconomic status index:
latent variable estimated as a construct and oper-ationalized by the combination of three manifest variables: family income, mother and respondent schooling. Regarding family income, we consid-ered the midpoint of the interval of each category of income in minimum wages at the time; zero (families without income); R$ 207.50 (less than 1 minimum wage); R$ 622.50 (from 1 to less than 2 minimum wages); R$ 1,037.50 (from 2 to less than 3 minimum wages); R$ 1,660.00 (from 3 to less than 5 minimum wages); R$ 3,112.50 (from 5 to less than 10 minimum wages); R$ 6,225.00 (from 10 to less than 20 minimum wages); R$ 10,375.00 (from 20 to less than 30 minimum wages); R$ 14,525.00 (from 30 to less than 40 minimum wages); R$ 18,675.00 (from 40 to less than 50 minimum wages) and R$ 24,900.00 (50 or more minimum wages). Regarding mother and respondent schooling, categories were con-sidered in complete years of study that ranged from zero to 16 years. In 510 missing values, the multiple imputation method was used for moth-er’s schooling based on distribution by house-hold income, gender and age32.
Referred morbidity:obtained from the report
of the evidence of disease through the question: “Has a doctor or other health professional ever said that you have any of these chronic diseases? The list consisted of fifteen options: hyperten-sion, high cholesterol, diabetes, asthma, arthritis (rheumatism, osteoporosis, arthrosis), chronic kidney disease, depression, migraine, epilepsy, tuberculosis, cancer (malignant tumor), heart disease, chronic lung disease (bronchitis, emphy-sema), chronic digestive disease (ulcer/gastritis), mental illness (schizophrenia, psychosis, anxiety disorder, bipolar disorder, obsessive compulsive disorder, panic syndrome, anorexia, bulimia). Three categories were created for the variable from the responses according to the presence or absence of these 0-no diseases; 1-one; 2- two or more morbidities.
Demographic variables:gender (female, male)
e C
ole
tiv
a,
22(11):3547-3556,
2017
Data review
Score analysis: Regarding the construction
of the socioeconomic status index, a data ex-ploratory factorial analysis for the elaboration of the socioeconomic status index was initial-ly developed. It is a multivariate factor anainitial-lysis technique, through the analysis of main compo-nents, which allows identifying latent variables or factors with the same underlying structure of the original variables and explain their variance, thus summarizing most of the original informa-tion (variance) to a minimum number of fac-tors. It also allows the investigator to work with a reduced number of variables without prejudice to information33,34. To assess the applicability of the method to the data set, the Bartlett’s Test of Sphericity (BTS) and Kaiser-Meyer-Olkin Mea-surement of Sampling Adequacy (KMO) tests were applied. These tests provide the statistical probability that the correlation matrix has sig-nificant correlations between at least some of the variables. The fit of the factorial model for data review was satisfactory and expressed values of p ≤ 0.05 for BTS and greater than 0.60 for KMO. Then, the factor extraction technique was carried out, which allowed determining the number of factors that best represented the correlation pat-tern among the observed variables. By the eigen-value rule, it is suggested that only factors with eigenvalue values above 1 are extracted. The fac-tor’s eigenvalue is such that it contributes to ex-plain variance in the original variables. This sin-gle factor represented the socioeconomic status indicator with a mean -0.23 (± 0.91), minimum -1.742; maximum of 4.029, used in this study. Next, the variable of the socioeconomic status indicator was transformed into a standardized variable that ranged from zero (0) to one hun-dred (100), with zero (0) indicating the worst economic status and one hundred (100) the best socioeconomic status.
Descriptive analyses were then performed through frequency distributions, means and standard deviation. The magnitude of the associ-ation between the explanatory variables and the response variable was measured by the odds ratio (OR) and its confidence interval (CI 95%) by the univariate and multivariate logistic regression model and the Hosmer-Lemeshow fit test. STATA 12.0 software was used for the statistical analysis, considering the sampling design and significance level of 5%. The Research Ethics Committee of the Medical School of UFMG approved this study.
Results
Of the 4,048 study participants, the prevalence of self-reported disability was 10.43% (95% CI: 9.1-11.7%); 53.11% were women, with a gener-al mean age of 40.94 (± 16,14). Most of the re-spondents reported having one or more diseases (56.95%).
With the KMO of 0.6723 and BTS <0.001, factor extraction was allowed through factor analysis. A single factor (socioeconomic status index) with an eigenvalue of 1.95 was identified, resulting in a socioeconomic status index with a mean of 26.13 (SD ± 15.85). The index of socio-economic status explained 67.2% of the variance of the manifest variables, mother’s schooling, in-dividual’s education and income, with factorial weight of 0.82 for mother’s schooling and 0.77 and 0.82, for individual’s income and schooling, respectively.
The median socioeconomic status index, mother and respondent schooling was lower among individuals with disability when com-pared to those without disability, as shown in Figure 1.
In the univariate analysis, all sociodemo-graphic and health variables were significantly associated (p ≤ 0.05) with self-reported disability (Table 2). The prevalence of self-reported dis-ability was higher in females (11.93%, 95% CI: 10.2-13.6) when compared to males (8.72%, 95% CI: 6.8-10.5). The mean age of participants with disability was higher (51.13 years) compared to those without disability (39.76 years). The prev-alence of self-reporting two or more diseases among individuals with disability was signifi-cantly higher (19.67%) compared to individuals without disease (4.38%). The socioeconomic status index was lower, with a mean of 21.44 (± 16.22) among participants with disability com-pared to those without disability, with a mean of 31.21 (± 17.11).
Fe
licíssimo MF
disability (OR = 0.97, 95% CI: 0.96-0.98). Each one-point increase in the socioeconomic status index decreased by 3% the odds of the individual having a disability. The model showed a good fit according to the Hosmer and Lemeshow test (p = 0.8591).
Discussion
This study showed that the low socioeconomic status showed represented by household income, mother and respondent schooling and the high frequency of diseases are associated with a higher prevalence of disability. These associations per-sisted in the multivariate model.
Table 2. Prevalence and association of sociodemographic and health variables in the univariate analysis
according to self-reported physical disability: 2008-2009 Belo Horizonte Health Study (n = 4,048).
Variable Total
With disability Prevalence (%)
(CI95%)
Without disability
Prevalence* (%)
(CI95%)
OR (CI95%)
Gender (%)
Female 53.11 11.93 (10.24-13.63) 88.07 (86.37-89.76) 1 Male 46.88 8.72 (6.87-10.56) 91.27 (89.43-93.12) 0.70 (0.53- 0.93)&&
Age (years) (mean ± SD) 40.94 (±16.14) 51.13 (17.50) 39.76 (15.55) 1.04 (1.03; 1.05)&
Number of referred diseases (%)
None 43.03 4.38 (3.24-5.53) 95.6 (94.47-96.76) 1
One 23.56 8.35 (6.39-10.32) 91.6 (89.68-93.60) 1.98 (1.37-2.88)&
Two or more 33.39 19.67 (16.53-22.81) 80.3 (77.18-83.46) 5.34 (3.84; 7.44)&
Status index Socioeconomic (mean ± SD; median, P25-P75)#
26.13 (±15.85)
(14.27-34.69) 21.44 (16.22) 31.21 (17.11) 0.96 (0.95; 0.97)
&
Title: (*) Weighted prevalence; (#) 152 missing; (&) P-value < 0,001; (&&) P-value: 0,011.
Figure 1. Relationship between socioeconomic status index, mother schooling and respondent schooling,
without and with disability.
Socioeconomic status index Respondent schooling Mother schooling 100
80
60
40
20
0
With Disability 100
80
60
40
20
0
e C
ole
tiv
a,
22(11):3547-3556,
2017
The prevalence of disability estimated by the World Health Organization (WHO)3 at 10%, was similar to that found in this study. However, the National Health Survey, in 20151, estimated prev-alence of disability at 6%, while the 2010 census evidenced 24%2. As mentioned previously, dis-parities found among prevalence of disability can be attributed to several factors such as definitions adopted for the theme and variations in the tools used for collection5.
From the association viewpoint, however, a relative agreement with previous studies was found. Age remained associated with disabili-ty even when adjusted for gender, self-reported disease, and socioeconomic status, corroborating the well-established effect in the literature of age on the occurrence of disability12,15,17,19. With the aging of the population, the odds of reporting disability increase, as well as the high frequency of diseases, especially among those over 60 years of age14,15. It should be noted, however, that in this study, the occurrence of disability was observed in people with a mean age of 51 years, possibly revealing an early decline of human body func-tions and structures.
Literature shows that women have a high prevalence of disability when compared to men11,14,35. However, in this study, gender was not associated with disability in the multivariate analysis.
The dose-response gradient observed by the increased number of morbidities referred to as prevalence of disability also increases has been previously described11-13,36, supporting the results of this study. The relationship between the ag-ing process and the self-reported disability with chronic diseases also assumes a dose-response gradient: increasing age raises the frequency of referred morbidities and increases the prevalence of disability12,15,37. The association between aging and self-reported disability is often accompanied by a high prevalence of chronic diseases, espe-cially in females, due to the greater survival and chronic non-fatal conditions among them, as well as the scarce access to health and rehabilita-tion services37.
In this study, the effect of socioeconomic status on increased prevalence of disability, even after adjusting for gender, age and evidence of comorbidities, remained similar to that found in previous international14,17,35,38 and national stud-ies12,13. While most studies verified use income and schooling separately, our results showed the same direction of the association.
In the study by Zitko and Melo17, individuals belonging to the poorest income quintile report-ed more often disability in all age groups. How-ever, Gjonça and Breeze38 found that the effect of lower wealth was associated with increase in its prevalence among adults (50-74 years), even after adjusting for age. The magnitude of this as-sociation between the poorer income and health condition was lower for individuals over 75 years of age.
In the study by Abellán et al.19, both high schooling and income reduced the likelihood of disability by 43%, while low schooling with high income reduced the odds of disability by only 21%. One of the explanations that elucidates the effect of schooling on the health condition is that people with high schooling tend to adopt healthy behaviors, are more socially participative and seek more health services, mainly with a preven-tive approach6,39.
Kingston et al.40 confirmed the theory of the accumulation of disadvantages or risks during the course of life, stating that the worst lev-el of schooling contributes to worsened health condition among the elderly in the 85-90 age group with functional disability. The high level of schooling is a protective factor for the early onset of diseases and disability, as found in this study. The socioeconomic status throughout life, in part, determines health in adult life8. Individ-uals whose parents have low levels of education
Table 3. Association of sociodemographic and
health variables according to self-reported physical disability in the multivariate analysis: 2008-2009 Belo Horizonte Health Study (n = 4,048).
Variable OR (CI 95%) P-value
Gender (%)*
Female 1 0.791
Male 0.96 (0.7 -1.3)
Age (years)* 1.02 (1.01 - 1.03) <0.001
Number of referred diseases (%)
None 1
One 1.6 (1.09 - 2.34) 0.017 Two or more 3.24 (2.16 - 4.86) <0.001 Socioeconomic
status index#
0.97 (0.96- 0.98) <0.001
Fe
licíssimo MF during childhood are at increased risk of
devel-oping disability when adults9. In this study, the socioeconomic status index of individuals with disability was lower than those without disability, as well as mother and respondent schooling (Fig-ure 1). This finding evidenced by previous stud-ies adds evidence in the current hypothesis that, among adults and the elderly, the effect of low mother’s schooling is in the causal chain of man-ifest health issues such as comorbidities, evidence of disabilities and incapacity in life activities9,17.
The socioeconomic status indicator measures different aspects of social stratification, and each of the components of this indicator, education and/or income are more or less relevant because they affect health, depending on the event inves-tigated and the stages of the course of life6. This finding was corroborated by Herd et al.7, whose schooling indicator was more relevant since it predicted the onset of the chronic diseases pro-cess and whose income indicator predicted the progression of chronic disease and functional limitation. An important aspect should be con-sidered. This study advances by using a robust, multidimensional socioeconomic status indi-cator, which aggregates three measures – re-spondent’s schooling and income and mother’s schooling. The latter reflects the cumulative ef-fect of socioeconomic status in adult life, which is considered a proxy of the socioeconomic sta-tus of the household context in which the child developed influencing the health process in adult life8. While some studies cite as a limitation the retrospective measurement of parents’ schooling, even leading to an underestimation of the associ-ations found, there is evidence for the replicabili-ty of results of these measurements41,42.
Some limitations should be discussed. The classic impossibility of establishing a causal re-lationship, because this is a cross-sectional study; the possible existence of the reverse causality ef-fect of the income variable and the variable of the respondent’s schooling. This effect cannot be totally excluded, since individuals with the low-est income and education are exposed to worse health conditions, since their financial resources are reduced for the maintenance of their health.
In addition, the comparison of the results is ham-pered by the question used in the survey, by the varying definitions of the term disability avail-able in the literature for which, in many studies, was directed to functional incapacity outcomes. Measuring disability through self-report can generate errors in disability estimates. Despite comparability issues found, prevalence similar to national and international studies suggest the external validity of this study.
The poor socioeconomic status and the high frequency of self-reported diseases seem to con-tribute to increased self-reported disability and to favor health inequities in this population group. Focused on reducing these inequities, our data point to the incentive of public policies and pro-grams that stimulate health and disease preven-tion practices. Our results indicate the enormous relevance of income transfer policy targeted through the application of a means testing based on household income per capita and geared to a population with a high level of vulnerability, which is the case of people with disabilities.
Collaborations
e C
ole
tiv
a,
22(11):3547-3556,
2017
References
1. Instituto Brasileiro de Geografia e Estatística (IBGE).
Pesquisa nacional de saúde: 2013: ciclos de vida: Brasil e grandes regiões. Rio de Janeiro: IBGE; 2015.
2. Instituto Brasileiro de Geografia e Estatística (IBGE).
Censo demográfico 2010: características gerais da popu-lação, religião e pessoas com deficiência. Rio de Janeiro: IBGE; 2012.
3. Organização Mundial da Saúde (OMS). Relatório
Mundial sobre a deficiência.World Report on Disability.
São Paulo: SEDPcD; 2012.
4. Klijs B NW, Looman CW, Mackenbach JP. Contribu-tion of Chronic Disease to the Burden of Disability
PLoS One 2011; 6(9):e25325.
5. Amiralian ML, Pinto EB, Ghirardi MI, Lichtig I, Masini EF, Pasqualin L. Conceituando deficiência. Rev Saude Publica 2000; 34(1):97-103.
6. Galobardes B, Shaw M, Lawlor DA, Lynch JW, Smith GD. Indicators of socioeconomic position (part 1). J
Epidemiol Commun H. 2006; 60(1):7-12.
7. Herd P, Goesling B, House JS. Socioeconomic position and health: the differential effects of education versus income on the onset versus progression of health prob-lems. J Health Soc Behav 2007; 48(3):223-238. 8. Galobardes B, Lynch J, Smith GD. Measuring
socioeco-nomic position in health research. Brit Med Bull 2007; 81-82:21-37.
9. Bowen ME, González HM. Childhood socioeconom-ic position and disability in later life: results of the health and retirement study. Am J Public Health 2010; 100(Supl.1):S197.
10. Guralnik JM, Butterworth S, Wadsworth ME, Kuh D. Childhood socioeconomic status predicts physical functioning a half century later. The Journals of Ger-ontology Series A: Biological Sciences and Medical Sciences. J Gerontol A Biol Sci Med Sci 2006; 61(7):694-701.
11. Felicíssimo MF, Friche AAL, Andrade ACS, Andrade RG, Costa DAS, Xavier CC, Proietti FA, Caiaffa WT. Prevalência e fatores associados ao autorrelato de defi-ciência: uma comparação por sexo. Rev Bras Epidemiol
2017; 20(1):147-160.
12. Castro SS, César CLG, Carandina L, Barros MBA, Alves MCGP, Goldbaum M. Deficiência visual, auditiva e fí-sica: prevalência e fatores associados em estudo de base populacional. Cad Saude Publica 2008; 24(8):1773-1782.
13. Castro SS, Cesar CLG, Carandina L, Barros MB, Alves MC, Goldbaum M. Physical disability, recent illnesses and health self-assessment in a population-based study in Sao Paulo, Brazil. Disabil Rehabil 2010; 32(19):1612-1615.
14. Hosseinpoor AR, Williams JS, Jann B, Kowal P, Of-ficer A, Posarac A, Chatterji S. Social determinants of sex differences in disability among older adults: a multi-country decomposition analysis using the World Health Survey. Int J Equity Health 2012; 11:52. 15. Klijs B, Nusselder WJ, Looman CW, Mackenbach JP.
Educational disparities in the burden of disability: con-tributions of disease prevalence and disabling impact.
Am J Public Health 2014; 104(8):e141-e148.
16. Picavet HS, Hoeymans N. Physical disability in The Netherlands: prevalence, risk groups and time trends.
Public Health 2002; 116(4):231-237.
17. Zitko Melo P, Cabieses Valdes B. Socioeconomic deter-minants of disability in Chile. Disabil Health J 2011; 4(4):271-282.
18. Souza MAP, Sampaio RF, Aguiar N, Augusto VG. Ex-ploring the organization of daily life among women with disabilities in Belo Horizonte, Brazil: perspectives of functionality and temporality. Disabil Soc 2013; 28(2):161-175.
19. Abellán A, Rodríguez-Laso Á, Pujol R, Barrios L. A higher level of education amplifies the inverse asso-ciation between income and disability in the Spanish elderly. Aging Clin Exp Res 2015; 27(6):903-909. 20. Esping-Andersen G. As três economias Políticas do
Welfare State. Lua Nova 1991; 24:85-116.
21. Esping-Andersen G. O futuro do Welfare State na Nova Ordem Mundial. Lua Nova 1995; 35:73-111.
22. Medeiros MA. Trajetória do Welfare State no Brasil: Pa-pel Redistributivo das Políticas Sociais dos anos 1930 aos
anos 1990. Brasília: Ipea; 2001. (Texto para Discussão,
n. 852)
23. Marshall TH. Cidadania, Classe Social e Status. Rio de Janeiro: Zahar; 1967.
24. Soares SSD. The Efficiency and Effectiveness of Social Protection Against Poverty and Inequailty in Brazil. In: Midgley J, Piachau D, organizadores. Social Protection, Economic Growth and Social Change: Goals, Issues and
Trajectories in China, India, Brazil and South Africa.
Cheltenham: Edward Elgar; 2013. p.153-165. 25. Medeiros M, Soares SSD, Souza PHGF, Osorio RG.
In-equality, Poverty, and the Brazilian Social Protection System. In: Pieterse JN, Cardoso A, organizadores.
Bra-zil Emergin: Inequality and Emancipation. New York:
Routledge; 2013. p. 32-49.
26. Costa N, Marcelino M, Duarte C, Uhr D. Proteção so-cial e pessoa com deficiência no Brasil. Cien Saude Co-let 2016; 21(10):3037-3047.
27. Macêdo A, Oliveira L. Benefício de prestação continu-ada: perspectivas na avaliação médico-social. Revista Katálysis 2015; 18(1):32-40.
28. Secretaria Municipal de Saúde de Belo Horizonte. Ge-rência de Epidemiologia e Informação (GEEPI). Índice
de Vulnerabilidade à Saúde 2003. Belo Horizonte: PBH;
2003.
29. Meireles AL, Xavier CC, Andrade AC, Friche AA, Proietti FA, Caiaffa WT. Self-rated health in urban adults, perceptions of the physical and social envi-ronment, and reported comorbidities: The BH Health Study. Cad Saude Publica 2015; 31(Supl. 1):120-135. 30. Friche AAL, Xavier CC, Proietti FA, Caiaffa WT.
Saú-de urbana em Belo Horizonte. Belo Horizonte: UFMG;
2015.
31. Organização Mundial da Saúde (OMS). Classificação Internacional de Funcionalidade, Incapacidade e Saúde
(CIF) 2003. Lisboa: OMS; 2004.
32. Camargos VP, César CC, Caiaffa WT, Xavier CC, Proiet-ti FA. Imputação múlProiet-tipla e análise de casos completos em modelos de regressão logística: uma avaliação prá-tica do impacto das perdas em covariáveis. Cad Saude
Publica 2011; 27(12):2299-2313.
Fe
licíssimo MF 34. Mingoti SA. tatística multivariada: uma abordagem aplicadaAnálise de dados através de métodos de es-. Belo
Horizonte: Editora UFMG; 2005.
35. Kavanagh AM, Krnjacki L, Aitken Z, LaMontagne AD, Beer A, Baker E, Bentley R. Intersections between dis-ability, type of impairment, gender and socio-econom-ic disadvantage in a nationally representative sample of 33,101 working-aged Australians. Disabil Health J
2015; 8(2):191-199.
36. Kinne S, Patrick DL, Doyle DL. Prevalence of second-ary conditions among people with disabilities. Am J
Public Health 2004; 94(3):443-445.
37. Verbrugge LM, Jette AM. The disablement process. Soc Sci Med. 1994; 38(1):1-14.
38. Gjonça ETF, Breeze E. Socioeconomic differences in physical disability at older age. J Epidemiol Commun H
2009; 63:928-935.
39. Silva FCM, Sampaio RF, Ferreira FR, Camargos VP, Ne-ves JA. Influence of context in social participation of people with disabilities in Brazil. Rev Panam Salud Públ
2013; 34(4):250-256.
40. Kingston A, Davies K, Collerton J, Robinson L, Dun-can R, Kirkwood TBL, Jagger C. The enduring effect of education-socioeconomic differences in disability tra-jectories from age 85 years in the Newcastle 85+ Study.
Arch Gerontol Geriatr 2015; 60(3):405-411.
41. Krieger N, Okamoto A, Selby JV. Adult female twins’ recall of childhood social class and father’s education: a validation study for public health research. Am J Epide-miol 1998; 147(7):704-708.
42. Mckenzie SK, Carter KN. Are retrospective measures of childhood socioeconomic position in prospective adult health surveys useful? Australas Epidemiol 2009; 16(3):22.
Article submitted 26/02/2017 Approved 03/07/2017