Seed phytate content and phosphorus uptake
and distribution in dry bean genotypes
Cileide Maria Medeiros Coelho1, Júlio Cesar Pires Santos2, Siu Mui Tsai1 and Victor Alexandre Vitorello1,*
1 Laboratório de Biologia Celular e Molecular, Centro de Energia Nuclear na Agricultura, Universidade de São Paulo, CP 96,
13400-970, Piracicaba, SP, Brasil;2 Universidade do Estado de Santa Catarina, CP 281, 88.520-000, Lages, SC, Brasil; * Corresponding
author: [email protected]
Phytic acid is the major storage form of phosphorus in seeds of legumes and cereals. Since phytate can form complexes with proteins and minerals, reducing the digestive availability of these nutrients, it is usually regarded as an antinutrient, although recent work indicates that it has important beneficial roles as an antioxidant and anticarcinogen. Therefore, there is an interest in the assessment and manipulation of phytate contents in important food grains such as beans. The objective of this work was to compare eleven dry bean genotypes with regard to grain contents of P, phytate, inorganic P and protein and to examine if differ-ences between genotypes could be explained by differdiffer-ences in grain protein content or in uptake and partitioning of P. Plants were grown in a greenhouse in pots containing soil and commercial substrate amended with 7.4 and 37 mg P.dm-3. The experimental setup was a random, complete block design with five replications. Genetic variability in grain phytate contents was observed. At the higher dose of P fertilization, genotype Una presented the highest phytate content (1.48 %) and the highest fraction of P as phytate (72 %), whereas these features were lowest in Paraiso (0.70 % and 47 %, respectively). Inorganic P made up 8 % of total P in Paraiso. A correlation between phytate and protein contents among genotypes was significant (r = 0.73) only under the higher dose of P fertilization. With the exception of genotype 4AP, differences in phytate content could not be explained by differences in uptake and partitioning of P in the plant. In the case of Paraiso, it is inferred that the lower phytate contents were due to differences in the metabolism of P and dry matter accumulation in the grain.
Key words: Inorganic phosphorus, Phaseolus, phytic acid, protein.
Teor de fitato em grãos e a absorção e distribuição de fósforo em genótipos de feijoeiro: O fitato é a principal forma de fósforo nos grãos de cereais e leguminosas. Sua presença pode diminuir o aproveitamento digestivo de diversos nutrientes, embora recen-temente tem sido demonstrado que também tem efeitos benéficos, podendo atuar como anti-oxidante e anti-carcinogênico. Portan-to, há um interesse na avaliação e na manipulação dos teores de fitato em grãos. O objetivo deste trabalho foi comparar onze genótipos de feijoeiro quanto ao teor de fitato, P, fósforo inorgânico e proteína nos grãos e examinar se a absorção e distribuição do P em diferentes partes da planta ou o teor de proteína no grão poderiam explicar as diferenças encontradas. As plantas foram conduzidas em casa de vegetação, em baldes contendo uma mistura de solo e substrato comercial que recebeu 7,4 e 37 mg P.dm-3. Encontrou-se variabilidade genética quanto ao teor de fitato nos grãos. Na dose mais alta de P a variedade Una apresentou maior teor de fitato (1,48 %), correspondendo a 72 % do P do grão. A variedade com menor teor de fitato foi Paraiso com 0,70 %, correspondente a 47 % do P dos grãos. O P inorgânico contribuiu em 8 % do P em Paraiso. A correlação entre fitato e proteína foi alta (r = 0,73) apenas na dose mais alta de P. Com exceção do genótipo 4AP, esta variação não pôde ser explicada por diferenças na absorção e distribuíção do P na planta. No caso de Paraíso, infere-se que o menor teor de fitato foi devido as diferenças no metabolismo do P e no acúmulo de matéria seca nos grãos.
INTRODUCTION
Phytic acid (myo-inositol hexakisphosphate) is the major storage form of phosphorus (P) in seeds of legumes and cereals (Reddy et al., 1989). Current literature suggests that phytic acid occurs primarily as potassium and magne-sium salts in dry beans (Phaseolus vulgaris L.) and cal-cium and potassium salts in soybeans (Glycine max) (Cheryan, 1980). In this anionic form, phytate can form complexes with proteins and minerals, leading to decreased availability of these nutrients in the digestive tract (Cheryan, 1980). Thus, phytate is generally regarded as an antinutrient. On the other hand, phytate may play an im-portant role as an antioxidant by complexing iron and thereby reducing free radical generation and the peroxidation of membranes, and may also act as an anticarcinogen, providing protection against colon cancer (Graf et al., 1987; Thompson and Zhang, 1991). Therefore, interest in the assessment and manipulation of phytate con-tents in grains is increasing worldwide. This is particularly important in Brazil, where soybeans and beans are impor-tant grain crops. However, the regulatory control of phytic acid synthesis in developing seeds is poorly understood.
On a broad level, phytate synthesis can be regulated in two ways. First, by the amount of photoassimilates and phosphorus translocated to the grain. Second, by the parti-tioning of these substrates among different pools and com-peting metabolic pathways in the developing grain. As an example of the first case, it has been shown that phytate levels are correlated with the supply of P to the plant and with the content of inorganic phosphorus in leaves (Raboy and Dickinson 1984a; Raboy and Dickinson, 1993), which ultimately leads to increased translocation of P to the grain. Another important factor seems to be the protein content of grains, since a correlation between phytate and protein contents has frequently been found (Raboy et al., 1991). This is not entirely surprising given the association between protein and phytate in protein storage bodies, but the regu-latory mechanisms are entirely unknown.
Although the phytate content of seeds depends to a large extent on the environment, such as the supply of phos-phorus to the plant (Raboy and Dickinson, 1993; Buerkert et al., 1998), which has also been shown in beans (Griffiths and Thomas, 1981; Coelho, 1998; Santos, 1998), there is important genetic variability in the phytate content of beans and it appears to be a trait controlled by several genes. In a field study undertaken with twenty soybean varieties, seed
phytic acid concentrations ranged from 18.8 to 27.7 g.Kg-1 (Raboy et al., 1984b). Other researchers estimated the heri-tability of phytate content to be 81 %, demonstrating the feasibility of breeding for this trait (Mebrahtu et al., 1997). Although there have been a few reports in the literature (Miranda et al., 1994; Ribeiro et al., 1999), very little is known with regard to phytate contents in beans or soybeans grown in Brazil.
Differences in genotypes with regard to phytate con-tent in beans should prove useful in elucidating the regula-tory control of phytate synthesis. Thus, the objective of this work was to compare eleven bean genotypes with regard to P uptake and distribution, grain protein content and the distribution of P among different fractions in the grain, par-ticularly phytate. This paper is a part of ongoing research attempting to understand the physiological and biochemi-cal mechanisms involved in the regulation of phytic acid biosynthesis during the development of bean grains.
MATERIAL AND METHODS
The commercial bean varieties Rio tibagi, Una, Ca-rioca, IAPAR 65, Pyatã, Diamante negro and Aruã were used. Their seeds were supplied by the Experimental Re-search Station of the Instituto Agronômico de Campinas, in Capão Bonito, state of São Paulo. The other varieties were Paraiso, 4AP, 40AP and 13BP, landraces grown in the state of Santa Catarina, and their seeds were supplied by the Active Bean Germplasm Bank of the Universidade do Estado de Santa Catarina.
At maturity, shoots, roots, pods and seed were har-vested. Roots were harvested by gently shaking off the soil mixture and several washes over a sieve. All samples were dried in a forced-air oven (60 °C for 72 h), except the seeds, which were freeze-dried and ground in a Wiley mill to pass a 40 mesh screen. Samples were stored at room tempera-ture in a dry and ventilated place.
Phosphorus content was determined colorimetrically following nitric/perchloric acid digestion, using the metavanadate method, which is based on the formation of a yellow vanadomolibdofosforic complex as described by Malavolta et al. (1989). To determine phytate, the method of Latta and Eskin (1980) was employed. A 500-mg sample was extracted with 20 mL of 2.4 % HCl (0.65 N) for 2 h at room temperature on a rotary shaker. The extract was cen-trifuged (10,000 gn, 15 min) and the supernatant decanted and filtered through Whatman number 1 filter paper. A 3 mL aliquot of the filtrate was diluted to 18 mL with dis-tilled water, and the diluted sample was passed through a 200-400 mesh AG1-X8 chloride anion exchange resin, tak-ing care so that no more than 3 mg phytate per 1.0 g of resin was applied. Inorganic phosphorus was eluted with 0.07 M NaCl followed by elution of phytate with 0.7 M NaCl. Phytate was determined colorimetrically, based on the pink color of the Wade reagent, which is formed upon the reaction of ferric ion and sulfosalicylic acid, and has an absorbance maximum at 500 nm. In the presence of phytate, the iron is sequestered and unavailable to react with sulfosalicylic acid, resulting in a decrease in pink color intensity.
The extraction procedure employed for determina-tion of inorganic P (Pi) was as proposed by Raboy and Dickinson (1984a). To determine Pi, 100 mg of sample was extracted twice, for two minutes, with 4 mL of 12.5 % trichloroacetic acid (w/v) in 0.025 M MgCl2 in a cold mor-tar. Each extract was centrifuged at 10,000 gn for 10 min and filtered through Whatman number 1 filter paper. The filtered extracts were combined, diluted to 12.5 mL and Pi was determined colorimetrically, as proposed by Chen et al. (1956).
Protein content was determined by total N content of the sample, where % Protein = N content ( %) x 6.25. Samples (200 mg) were placed in 75 mL digestion tubes and 6 mL of digestion mixture, consisting of concentrated sulfuric acid, hydrogen peroxide 30 %, lithium sulfate 14 % and selenium 42 %, was added to each sample. The
samples were placed in a digestion block until samples became clear at a temperature of 250 °C. Samples were diluted with water to 75 mL. Three mL aliquots were di-luted and analyzed in a flow-through colorimeter for N determination. The N content of samples was quantified according to Parkinson and Allen (1975), which utilizes the colorimetric determination of ammonium as a blue in-dophenol complex formed when ammonia reacts with so-dium phenate and hypochlorite.
RESULTS AND DISCUSSION
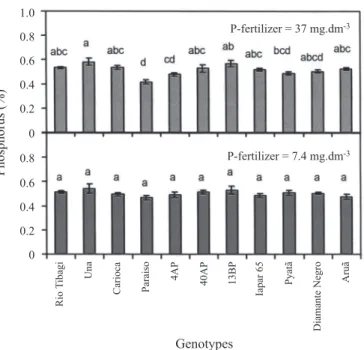
Grain phosphorus content differed among the geno-types grown under the higher dose of fertilizer P and ranged from 0.4 to 0.6 %, similar to results found in the literature (Lolas and Markakis, 1975). Grains from genotype Una presented the highest values of P content while Paraiso pre-sented the lowest. However, Paraiso did not differ statisti-cally from Diamante negro, Pyatã and 4AP, and Una did not differ from the remaining genotypes. Under lower P supply, differences in seed P content between genotypes were not significant (figure 1).
The grain phytate contents of genotypes 40AP, 13BP, Una and Diamante Negro were higher than Paraiso under the lower dose of fertilizer P (figure 2). However, differ-ences in phytate content among genotypes were more pro-nounced under higher doses of P, in which Una presented the highest value and Paraiso the lowest. Paraiso did not differ statistically only from genotypes Diamante Negro, 4AP, 40AP and Rio tibagi (figure 2).Hence, genetic vari-ability was observed in the phytate content of the bean grains, with values ranging from 0.7 to 1.48 %. In a field study undertaken with twenty soybean varieties, seed phytic acid concentrations ranged from 18.8 to 27.7 g.Kg-1 (Raboy et al., 1984b). Phytate contents of fourteen soybean culti-vars grown in Brazil ranged from 0.56 to 1.20 % (Miranda et al., 1994). Two other Brazilian soybean cultivars were found to have phytic acid contents of 1.30 and 1.67 % (Ribeiro et al., 1999). Other authors have reported varia-tion in phytate content in other crops, such as maize (Ertl et al., 1998) and wheat (Raboy et al., 1991).
An important goal of breeding programs is to re-duce phytate contents in grain without reducing the con-tent of P. Therefore, it is important to examine the fraction of P in the form of phytate. This parameter provides im-portant information as to whether more or less seed P is being committed to phytate or to other forms of P, and can thus provide clues as to the regulation of phytate synthe-sis. In fifty varieties of dry beans, the phytate fraction was reported to be between 54 and 82 % of seed P (Lolas and Markakis, 1975). Under lower P fertilization, these values were highest in bean genotypes 40AP and Diamante negro (66.6 and 64.0 %, respectively), while the smallest frac-tion was found in Paraiso, where phytate comprised 40.4 % of grain P. Under the higher dose of fertilizer P, the frac-tion of P as phytate differed significantly between Una and Paraiso, which was found to be 72 and 47 %, respectively, although each did not differ from the other genotypes.
Inorganic P (Pi) is another important form of phos-phorus in grains, although it is present at relatively low concentrations and thus constitutes a small fraction of the total P of grains. High levels of inorganic P are regarded as desirable from a nutritional standpoint. In addition, sev-eral studies point out that phytic acid metabolism is sensi-tive to cellular levels of Pi (Raboy and Dickinson, 1993). Under lower P supply, genotype 4AP presented the highest Pi content and 40AP the lowest, although they did not dif-fer from the other genotypes. Under the higher dose of dif- fer-tilizer P, Pi contents were different only between Paraiso (0.033 %) and Rio tibagi (0.021 %), as shown in figure 3.
The fraction of seed P in the form of Pi was highest in Paraiso (8 %) at the higher dose of P fertilization, but did not differ from 4AP, Aruã, Diamante negro, Carioca, Una and Iapar-65. Rio tibagi presented the lowest (4 %) fraction of P as Pi, although this value differed statistically only from Paraiso. With the lower dose of fertilizer P, Aruã, 4AP, Paraiso and Una did not differ and the Pi fraction av-eraged 6.7 % in these genotypes. Usually, a close relation-ship between Pi and phytic acid during grain development and maturation is found, although in the case of maize mu-tants, reduced levels of phytic acid were accompanied by increasing levels of Pi (Raboy et al., 1990). In these bean genotypes, both Paraiso and 4AP, which had lower phytate contents, presented a tendency to have higher concentra-tions of Pi and a larger fraction of P as Pi than the other genotypes. 1.0 0.8 0.6 0.4 0.2 0 0.8 0.6 0.4 0.2 0 P hos phorus (%)
P-fertilizer = 37 mg.dm-3
P-fertilizer = 7.4 mg.dm-3
Ri o T iba gi U na Ca ri oc a P ara is o 4A P 40A P 13BP Ia pa r 65 P ya tã D ia m ant e N
egro Aruã
Genotypes
Figure 1. Phosphorus content in grains of bean genotypes grown under two doses of P fertilization. Phosphorus was applied at 7.4 and 37 mg.dm-3. The same letter within the same dose of P fertilization indicates no significant differ-ence (Tukey 5 %, n = 5). Bars represent standard error.
2.1 1.4 0.7 0 1.4 0.7 0 P hyt ic a ci d (%)
P-fertilizer = 37 mg.dm-3
P-fertilizer = 7.4 mg.dm-3
Ri o T iba gi U na Ca ri oc a P ara is o 4A P 40A P 13BP Ia pa r 65 P ya tã D ia m ant e N
egro Aruã
Genotypes
Figure 3. Inorganic phosphorus content in grains of bean geno-types grown under two doses of P fertilization. Phosphorus was applied at 7.4 and 37 mg.dm-3. The same letter within the same dose of P fertilization indicates no significant dif-ference (Tukey 5 %, n = 5). Bars represent standard error.
Evidence suggests that phytic acid synthesis may be induced in response to stimuli such as high Pi in grains or leaves (Raboy and Dickinson 1993). Increased phytic acid accumulation may be regulated by the activity of phosphoinositol kinase. This enzyme is located at an im-portant branch point in the pathway leading to phytic acid, and Pi may directly increase the activity of this enzyme due to increased levels of 1L-myo-inositol-1-P and ATP (Chakrabarti and Biswas, 1981).
Breeding for reduced levels of phytic acid can re-sult in undesirable effects, such as the reduction of P, pro-tein, and mineral elements in grain (Raboy et al., 1984b). Genotypes such as Paraiso, which display low phytate con-tents, without reduced P content, should prove useful in stud-ies of the regulatory control of phytic acid synthesis in plants.
Variation in phytate content usually accounts for much of the variation in protein levels in grains. The inter-dependence between phytate and protein can be observed by the correlation between these two variables (Raboy et al., 1991). In this study, a higher correlation (r = 0.73) be-tween phytate and protein was observed under the higher dose of P fertilization, while under the lower P dose no significant correlation was observed (Figure 4). The ab-sence of a strong relationship between phytate and protein in this study was, in part, due to rather small variations in pro-tein content. Nevertheless, these results are not unlike those found in the literature (Raboy et al., 1991; Chitra et al., 1995).
Figure 4. Correlation between protein and phytate contents in grains of bean genotypes grown under two doses of P fertilization. Phosphorus was applied at 7.4 and 37 mg.dm-3.
P
rot
ei
n (%)
Phytic acid (%)
26
24
22
20
0
24
22
20
0
0 0.7 1.4 2.1 2.8
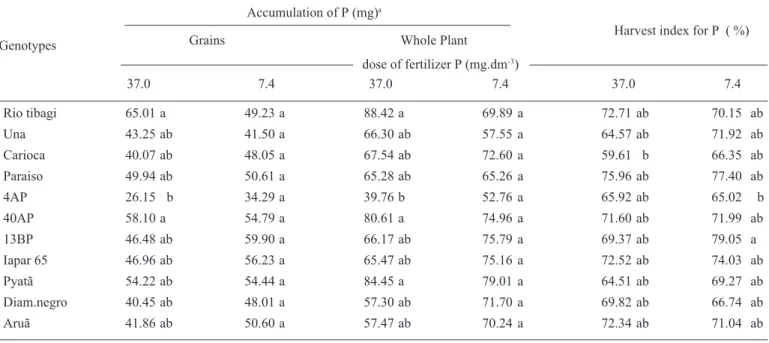
To examine the extent to which the uptake and trans-location of phosphorus influenced the phytate content of the bean grains, the accumulation of P in the whole plant and grains, and the harvest index for P were also examined (table 1). No differences among genotypes were found at the lower dose of P fertilization. At higher doses of P, Una and Paraiso, which contrasted with respect to phytate con-centration, did not present significant differences in the amount of P accumulated in the whole plant and in the grains. However, differences were found between Rio tibagi and 4AP, although each did not differ from the other geno-0.05
0.04 0.03 0.02 0.01 0 0.04 0.03 0.02 0.01 0
Inorga
ni
c phos
phorus
(%)
P-fertilizer = 37 mg.dm-3
P-fertilizer = 7.4 mg.dm-3
Ri
o
T
iba
gi
U
na
Ca
ri
oc
a
P
ara
is
o
4A
P
40A
P
13BP
Ia
pa
r 65
P
ya
tã
D
ia
m
ant
e N
egro Aruã
Genotypes
Y = 3.22x + 18.78 R2 = 0.546
P-fertilizer 37 mg.dm-3
P-fertilizer 7.4 mg.dm-3
types. Rio tibagi accumulated more P in grains and in the whole plant when compared with 4AP, which presented smaller amounts of P accumulation (table 1). The behavior of these last two genotypes is in agreement with results from Raboy and Dickinson (1984a), where it was shown that soybean varieties with higher amounts of leaf P pre-sented correspondingly higher amounts of P in the seed. In the case of 4AP, the lower contents of P and phytate found in the seeds of this genotype (figure 1 and 2) can be almost entirely explained by the smaller quantities of P taken up by the plant and by a smaller harvest index for P, when compared to the other genotypes.
The concentration of P in different parts of the plant can provide indications of how P is being used in the plant (Thung, 1990). However, very little differences were found among the genotypes with regard to P concentrations in the different plant parts. Differences were found only in roots and pods under higher doses of fertilizer P. In roots, Una showed a higher P content compared to Iapar-65, whereas in pods, the P content was higher in Rio tibagi compared with Diamante negro (table 2).
Although Rio tibagi and 4AP differed in the quan-tity of P amassed in the plant and grains (table 1) they did
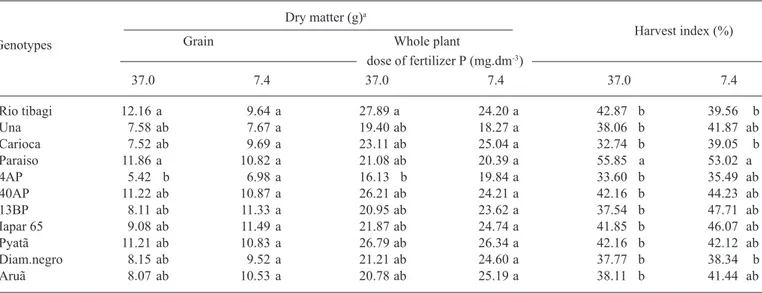
not differ with respect to P concentration in the various parts of the plant (table 2). This occurred because of the higher dry matter accumulation, both in the plant and grain of Rio tibagi (table 3). When comparing Una and Paraiso, the opposite occurred with regard to P contents and accu-mulation in the plants. No differences were found in the accumulation of P in the grains or entire plant (table 1), but a significant difference was found in the P concentra-tion of the grain (figure 1). Again, this was caused by dif-ferences in dry matter accumulation, since the harvest in-dex in Paraiso was greater than in Una (table 3).
In conclusion, genetic variability in phytate contents of seeds was observed, with values ranging from 0.7 to 1.48 %, which is a range similar to that found in the literature (Lolas and Markakis, 1975; Raboy et al., 1994; Raboy et al., 1991; Ertl et al., 1998). Genotype 4AP was the only case in which lower P uptake and translocation appar-ently resulted in lower concentrations of P and phytate in the grain. In the other genotypes, no evidence was found to substantiate the hypothesis that seed phytate content could be regulated by the amount of P translo-cated to the seeds, since the harvest index for P was simi-lar in these genotypes.
Table 1. Accumulation of phosphorus in grains and in whole plants (roots, leaves, stems, pods and grains) and harvest index for P in bean genotypes grown under two doses of P fertilization. Phosphorus was applied at 7.4 and 37 mg.dm-3.
Accumulation of P (mg)a
Grains Whole Plant
dose of fertilizer P (mg.dm-3)
37.0 7.4 37.0 7.4 37.0 7.4
Rio tibagi 65.01 a 49.23 a 88.42 a 69.89 a 72.71 ab 70.15 ab
Una 43.25 ab 41.50 a 66.30 ab 57.55 a 64.57 ab 71.92 ab
Carioca 40.07 ab 48.05 a 67.54 ab 72.60 a 59.61 b 66.35 ab
Paraiso 49.94 ab 50.61 a 65.28 ab 65.26 a 75.96 ab 77.40 ab
4AP 26.15 b 34.29 a 39.76 b 52.76 a 65.92 ab 65.02 b
40AP 58.10 a 54.79 a 80.61 a 74.96 a 71.60 ab 71.99 ab
13BP 46.48 ab 59.90 a 66.17 ab 75.79 a 69.37 ab 79.05 a
Iapar 65 46.96 ab 56.23 a 65.47 ab 75.16 a 72.52 ab 74.03 ab
Pyatã 54.22 ab 54.44 a 84.45 a 79.01 a 64.51 ab 69.27 ab
Diam.negro 40.45 ab 48.01 a 57.30 ab 71.70 a 69.82 ab 66.74 ab
Aruã 41.86 ab 50.60 a 57.47 ab 70.24 a 72.34 ab 71.04 ab
a Same letter within a column indicates no significant difference (Tukey 5 %, n= 5).
Table 3. Dry matter accumulation in grains and in whole plants (roots, leaves, stems, pods and grains) and harvest index in bean genotypes grown under two doses of P fertilization. Phosphorus was applied at 7.4 and 37 mg.dm-3.
Dry matter (g)a
Grain Whole plant
dose of fertilizer P (mg.dm-3)
37.0 7.4 37.0 7.4 37.0 7.4
Rio tibagi 12.16 a 9.64 a 27.89 a 24.20 a 42.87 b 39.56 b
Una 7.58 ab 7.67 a 19.40 ab 18.27 a 38.06 b 41.87 ab
Carioca 7.52 ab 9.69 a 23.11 ab 25.04 a 32.74 b 39.05 b
Paraiso 11.86 a 10.82 a 21.08 ab 20.39 a 55.85 a 53.02 a
4AP 5.42 b 6.98 a 16.13 b 19.84 a 33.60 b 35.49 ab
40AP 11.22 ab 10.87 a 26.21 ab 24.21 a 42.16 b 44.23 ab
13BP 8.11 ab 11.33 a 20.95 ab 23.62 a 37.54 b 47.71 ab
Iapar 65 9.08 ab 11.49 a 21.87 ab 24.74 a 41.85 b 46.07 ab
Pyatã 11.21 ab 10.83 a 26.79 ab 26.34 a 42.16 b 42.12 ab
Diam.negro 8.15 ab 9.52 a 21.21 ab 24.60 a 37.77 b 38.34 b
Aruã 8.07 ab 10.53 a 20.78 ab 25.19 a 38.11 b 41.44 ab
a Same letter within a column indicates no significant difference (Tukey 5 %, n= 5).
Table 2. Phosphorus contents in roots, shoots and pods in bean genotypes grown under two doses of P fertilization. Phosphorus was applied at 7.4 and 37 mg.dm-3.
P content ( %)a
Root Shoot Pod
dose of fertilizer P (mg.dm-3)
37.0 7.4 37.0 7.4 37.0 7.4
Rio tibagi 0.25 ab 0.20 a 0.17 a 0.17 a 0.06 a 0.04 a
Una 0.32 a 0.26 a 0.21 a 0.17 a 0.04 ab 0.03 a
Carioca 0.24 ab 0.22 a 0.20 a 0.19 a 0.04 ab 0.03 a
Paraiso 0.25 ab 0.25 a 0.18 a 0.17 a 0.04 ab 0.04 a
4AP 0.22 ab 0.21 a 0.17 a 0.17 a 0.04 ab 0.04 a
40AP 0.24 ab 0.19 a 0.18 a 0.19 a 0.03 ab 0.03 a
13BP 0.25 ab 0.25 a 0.18 a 0.15 a 0.03 ab 0.04 a
Iapar 65 0.20 b 0.19 a 0.16 a 0.17 a 0.03 ab 0.03 a
Pyatã 0.28 ab 0.22 a 0.24 a 0.19 a 0.03 ab 0.04 a
Diam.negro 0.21 ab 0.22 a 0.15 a 0.19 a 0.02 b 0.03 a
Aruã 0.22 ab 0.21 a 0.15 a 0.16 a 0.04 ab 0.03 a
a Same letter within a column indicates no significant difference (Tukey 5 %, n= 5).
In the case of the contrast between Una and Paraiso, where the latter presented a phytate concentration about half of that in Una, the differences in grain phytate content were, in part, due to differences in the use and metabolism of P within the grain. This can be inferred because the frac-tion of seed P in the form of phytate was significantly dif-ferent between these two genotypes, and the fraction of Pi in Paraiso was also higher. However, metabolism of P in
the grain cannot entirely explain the differences in phytate content of these two genotypes. Although the amount of P amassed by the plant and exported to the grain was not different between these two genotypes, the concentration of P in the grains of Paraiso was lower than in Una. This occurred because of the higher harvest index found in Paraiso (table 3). This also contributed to the lower con-centrations of phytate in the seeds of Paraiso.
Genotypes
Thus, in this study, differences in phytate content were caused by smaller P uptake and partitioning of P to the grain in one case, and by differences in dry matter ac-cumulation and metabolism of P in the grain in another. The information reported here should prove useful both for bean breeding programs and for future studies related to the understanding of regulatory control of phytate synthe-sis in beans.
Acknowledgments: The authors are grateful to FAPESP for funding of this work and a fellowship granted to CMMC, and to CNPq for a fellowship granted to VAV, and to Dr. Jairo Lopes de Castro–IAC-Capão Bonito (SP), for pro-viding the bean seeds.
REFERENCES
Buerkert A, Haake C, Ruckwied M, Marschner H (2001) Phos-phorus application affects the nutritional quality of millet grain in the sahel. Field Crops Res. 57:223-235.
Chakrabarti S, Biswas BB (1981) Two forms of phosphoinositol kinase from germinating mung bean seeds. Phytochemistry 20:1815-1817.
Chen IW, Charalampous, F (1966) Biochemical studies on inositol: IX d-inositol 1-phosphate as intermediate in the biosynthesis of inositol from glucose 6-phosphate, and characteristics of two reactions in this biosynthe-sis. J. Biol. Chem. 241:2194-2199.
Cheryan M (1980) Phytic acid interations in food systems. Crit. Rev. Food Sci. Nutr. 13:297-335.
Coelho CMM (1998) Caracterização genética de dois acessos de feijoeiro com ênfase na qualidade de pós-colheita. Piracicaba, Universidade de São Paulo. Dissertação de mestrado.
Chitra U, Vimala V, Singh U, Geervani P (1995) Variabil-ity in phytic acid content and protein digestibilVariabil-ity of grain legumes. Plant Food Hum. Nutr. 47:163-172.
Ertl DS, Yuong KA, Raboy V (1998) Plant genetic ap-proaches to phosphorus managment in agricultural pro-duction. J. Environ. Qual. 27:299-304.
Graf E, Empson KL, Eaton JW (1987) Phytic acid a natu-ral antioxidant. J. Biol. Chem. 262:11647-11650.
Griffiths DW, Thomas TA (1981) Phytate and total phos-phorus content of field beans (Vicia faba L.). J. Sci. Food Agri. 32:187-192.
Latta M, Eskin M (1980) A simple method for phytate de-termination. J. Agri. Food Chem. 28:1313-1315.
Lolas GM, Markakis P (1975) Phytic acid and other phos-phorus compounds of beans (Phaseolus vulgaris L). J. Agri. Food Chem. 23:13-15.
Malavolta E, Vitti GC, Oliveira SA (1989) Avaliação do estado nutricional das plantas: princípios e aplicações. Associação Brasileira para Pesquisa da Potassa e do Fosfato, Piracicaba.
Mebrahtu T, Mohamed A, Elmi A (1997) Accumulation of phytate in vegetable type soybean genotypes harvested at four developmental stages. Plant Food Hum. Nutr. 50:179-187.
Miranda LCG, Oliveira TT, Mendonça RCS, Nagem TJN (1994) Variação dos teores de ácido fítico e fitatos em cultivares de soja. Ver. Ceres 41:623-628.
Parkinson M, Allen N (1975) A wet oxidation procedure suitable for the determination of nitrogen and mineral nutrients in biological material. Commun. Soil Sci. Plant Anal. 6:1-11.
Ribeiro MLL, Ida EI, Oliveira MCN (1999) Efeito da germinação de soja cv. BR-13 e Paraná sobre ácido fítico, fósforo total e inibidores de tripsina. Pesq. Agrop. Bras. 34:31-36.
Raboy V, Dickinson DB (1984a) Effect of phosphorus and zinc nutrition on soybean seed phytic acid and zinc. Plant Physiol. 75:1094-1098.
Raboy V, Dickinson DB, Below FE (1984b) Variation in seed total phosphorus, phytic acid, zinc, calcium, mag-nesium and protein among lines of Glycine max and G. Soja. Crop Sci. 24:431-434.
Raboy V, Dikinson DB, Neuffer MG (1990) A survey of maize kernel mutants for variation in phytic acid. Maydica 35:383-390.
Raboy V, Dickinson DB (1993) Phytic acid levels in seeds
of Glicyne max and G. Soja as influenced by
phospho-rus status. Crop Sci. 33:1300-1305.
Raboy V, Noaman MM, Taylor GA Pickett SG (1991) Grain phytic acid and protein are highly correlated in winter wheat. Crop Sci. 31:631-635.
Reddy NR, Pierson MD, Sathe SK, Salunkhe DK (1989) Phytates in Cereals and Legumes, CRC Press, Boca Raton.
Santos JCP (1998) Estado nutricional do feijoeiro (Phaseolus
vulgaris L.) e teores de nutrientes e fitatos nos grãos.
Piracicaba, Universidade de São Paulo. Tese de doutorado.
Sarruge JR (1975) Soluções nutritivas. Summa Phytopathologica 1:231-233.
Thompson LU, Zhang L (1991) Phytic acid and minerals: effect on early markers of risk for mammary and colon carcinogenesis. Carcinogene 12:2041-2045.