http://www.uem.br/acta ISSN printed: 1679-9275 ISSN on-line: 1807-8621
Acta Scientiarum
Doi: 10.4025/actasciagron.v34i3.13942
Acta Scientiarum. Agronomy Maringá, v. 34, n. 3, p. 285-292, July-Sept.,2012
Comparison of the allocation of phytomass in soybean and bean
and its potential role in biological nitrogen fixation
Tomás de Aquino Portes* and Bárbara Regina Brandão de Araújo
Instituto de Ciências Biológicas, Ecofisiologia Vegetal, Universidade Federal de Goiás, 74001-970, Goiânia, Goiás, Brazil. *Author for correspondence. E-mail: [email protected]
ABSTRACT. Soybean is a self-sufficient specie in nitrogen acquisition due to their efficient association with diazotrophs. Unlike bean, which requires nitrogen supplementation, soybean is not dependent on nitrogen fertilization. This interspecies difference may be related to the allocation pattern of photosynthates during their growth cycles. Distinct from soybean, common bean cannot maintain their active nodules until the end of their growth cycle due to the unavailability of photosynthates in their roots after flowering. To compare the partitioning of the phytomass in soybean (Glycine max (L.) Merrill) and common bean (Phaseolus vulgaris L.) species during their ontogenetic cycles, a growth analysis experiment were conducted with Favorita BRS and BRS Pontal varieties, respectively. The results revealed that soybeans keep producing leaves, branches and roots even after flowering, indicating no limitation in the supply of photosynthates to its organs, especially to the roots, where a predominant allocation of photosynthates can favor nodule activity. After flowering in bean plants, allocation preferentially occurs to the pods at the expense of the other organs including the roots, which potentially affects their nodule activity.
Keywords: growth analysis, activity of nodules, phytomass, Glycine max, Phaseolus vulgaris, Rhizobium.
Alocação comparada de fitomassa em soja e feijão e possível controle na fixação biológica
do nitrogênio
RESUMO
.
A eficiente associação com bactérias diazotróficas faz da soja uma espécie auto-suficiente naobtenção do nitrogênio que necessita, tornando-a não dependente de adubação nitrogenada, diferentemente do feijão que carece da aplicação do nutriente na forma de fertilizantes. Presume-se que esta diferença interespecífica possa ter relação com o padrão de alocação de fotossintatos ao longo dos ciclos das leguminosas, de maneira que, ao contrário da soja, o feijão não consegue manter os seus nódulos ativos, até o final do seu ciclo, pela indisponibilidade de fotossintatos nas raízes após o florescimento. Para comparar a partição de fitomassa nas espécies soja (Glycine max (L.) Merrill) e feijão (Phaseolus vulgaris L.) ao longo dos seus ciclos ontogenéticos foi conduzido um experimento de análise de crescimento com as variedades BRS Favorita e BRS Pontal, respectivamente. Os resultados obtidos indicam que a soja continua produzindo folhas, ramos e raízes, mesmo após a floração, indicando não limitação por fotossintatos no abastecimento de seus órgãos, com predomínio da alocação para as raízes, o que pode favorecer a atividade dos seus nódulos. Nos feijoeiros, após a floração, ocorre alocação preferencial para as vagens em detrimento dos demais órgãos, como as raízes, o que pode afetar a atividade nos seus nódulos.
Palavras chave: análise de crescimento, atividade de nódulos,fitomassa, Glycine max, Phaseolus vulgaris, Rhizobium.
Introduction
The partitioning of carbohydrates among the various organs of a plant differs among species and varies during ontogeny regulating development and growth, which become more complex as plants progress through successive growth stages as seedlings, adults and senescents.
The development, growth and partitioning of photosynthates between plant parts vary with species and age but are genetically controlled, driven by signals from environmental factors, such as the
availability of light and nutrients, soil moisture and air temperature. These factors can affect hormonal balance, especially by changing the direction of the photosynthate supply to certain organs during times of great demand (DANTAS et al., 2007; LALONDE et al., 2004; SANDRIN et al., 2006; TAIZ; ZEIGER, 2008; TANAKA; FUGITA, 1979).
Acta Scientiarum. Agronomy Maringá, v. 34, n. 3, p. 285-292, July-Sept.,2012
It is estimated that 30% of the carbon obtained by photosynthesis in annual legumes is used for nodule growth and maintenance and approximately 60% of the carbon directed to the nodules is lost as CO2 through respiration (LAYZELL et al., 1979).
The carbohydrates formed in photosynthesis are translocated from leaves to nodules in the form of sucrose, whose oxidation leads to the production of the reducers NADH or NADPH and ATP, which are sources of electrons and energy for nitrogen fixation (TAIZ; ZEIGER, 2008).
Many studies have sought Rhizobium strains that are more efficient in nitrogen fixation (CHAGAS JUNIOR et al., 2010; GONZÁLEZ et al., 2008; RAYMOND et al., 2004), but few studies have compared the ability of plants of the same species or different species to interact with symbionts and in particular, their ability to efficiently supply photosynthates.
The aim of this study was to determine the partitioning of the phytomass among different organs of two legumes: soybean cultivar Favorita and bean cultivar BRS Pontal. Growth analysis methods were used to study the competition for carbohydrates between different organs throughout vegetative and reproductive development.
Material and methods
The experiment were carried out in a greenhouse in Goiania, State of Goiás (Brazil), 16° 41 'S and 49º 17 'E altitude of 730 m. The soil used in the experiment was a dark-red Ferralsol whose chemical characteristics before the experiment were as follows: pH (CaCl2) - 5.2, available P (Mehlich I)
- 2.3 mg kg-1, K - 50 mg kg-1, Ca - 5.7 cmol
c kg-1, Mg
- 0.5 cmolc kg-1; cation exchange capacity (CEC) -
9.4 cmolc kg-1 and organic matter (OM) – 30 g kg-1.
Fertilization to correct the soil was performed based on the soil’s chemical analysis. The pots in which the bean and soybean seeds were sown contained 9 kg of soil and each pot was fertilized with 1.225 g of mixture 4-30-10 and 5.25 g of 2-20-10 NPK, respectively. Ammonium sulfate topdressing was applied (at 0.2 g kg-1 of soil) to the
beans on 11/28/2009 (26 days after emergence - DAE) and to the soybeans on 12/9/2009 (37 DAE). Because the soybean plants became yellow with characteristic symptoms of nitrogen deficiency by 1/11/2010 (69 DAE), a new urea topdressing was applied (at 0.125 g kg-1 of soil).
The experimental design was completely randomized, consisting of treatments to one variety of soybean (BRS Favorita cultivar, semi-early) and
to one variety of bean (BRS Pontal cultivar from the Carioca commercial group, with a semi-prostrate growth habit) with four repetitions. Sixty plastic pots were arranged so that four pots containing soybeans and four pots containing beans could be removed every week for evaluation. Statistical analysis was performed with Assistat software.
The beans and soybeans were sown on 10/26/2009. After thinning, two plants were left in each pot. Bean and soybean plant sampling occurred at 8, 16, 23, 30, 37, 44, 51, 58 and 65 DAE, following the Julian calendar, with three additional soybean samples taken at 73, 79 and 93 DAE due to its longer cycle.
A total of eight soybean plants and eight bean plants were harvested on each of these days. The plants were cut at the ground level and taken to the laboratory, where the leaves were detached to determine the leaf area (LA) with a LI-COR electronic leaf area meter (model LI 3100). The leaves and all of the other organs (roots after being properly washed using a coarse mesh sieve, stems, lateral branches, petioles, pods and grains) were then separated, placed in paper bags and oven dried at 70ºC for 24 hours. Subsequently, the material was weighed and mathematical equations (models) were fitted to the data obtained for the soybean leaf area (LA) and to the dry mass of green leaves (GLDM), petioles (PEDM), branches (BDM), stems (SDM), pods (PDV), and roots (RDM) as a function of the plant age (DAE). The correlation coefficients (r) and significance levels (F-test) were determined. From the equations fitted to the TDM (including roots) and LA, the physiological indicators of the growth: instantaneous crop growth rates (CGR) and instantaneous net assimilation rate (NAR) were determined by the following equations:
CGR = dTDM/dt,
NAR = dTDM/dt)/LA, where d is the derivative of the equation TDM and t = DAE (PORTES; CARVALHO, 2009).
Results anddiscussion
Biomass partitioning in soybean and bean 287
Acta Scientiarum. Agronomy Maringá, v. 34, n. 3, p. 285-292, July-Sept.,2012
Equations were fitted to the data and the correlation coefficients (r) and levels of significance (F-test) were determined for LA, GLDM, PEDM, BDM, SDM, PDM, RDM and TDM as a function of age (DAE). For both soybean and bean, as shown in Table 1, cubic exponential equations (y = kexp (ax + bx2 + cx3))
were fitted to the values obtained for the soybean leaf area (LA), the dry mass of green leaves (GLDM), petioles (PEDM), stems (SDM), pods (PDM), and roots (RDM) and the total dry mass (TDM); for the branch dry mass (BDM), a cubic equation (y = a + bx + cx2 + dx3) was used. For
bean, the same cubic exponential equation was fitted to the LA, GLDM, PEDM, SDM, TDM and RDM data. For the branch dry mass (BDM), an exponential quadratic equation (y = kexp (ax + bx2)) was used; for pods (PDM), the cubic
equation was used. Plant analysis was performed upon emergence in the slow growth stage, before exponential growth began, because better fittings could thus be obtained. Analysis initiated after this slow stage results in imperfect, non-sigmoidal adjustments (S shaped). On the other hand, sampling should continue until the physiological maturity of plants, because growth can continue, stabilize or decline due to the death of organs such as leaves (PORTES; CARVALHO, 2009).
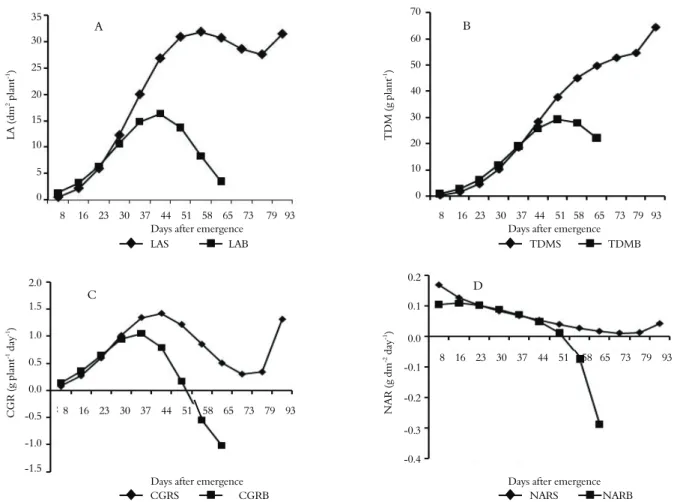
The LA of soybean was smaller than that of bean until 16 DAE (Figure 1A and Tables 2 and
3), showing no difference at 23 DAE (p ≥ 0.05). However, from this point on, the LA of soybean was greater than that of bean, reaching a maximum area of 31.90 dm2 plant-1 (calculated
value) at 58 DAE, 14 days after the bean plants reached the maximum.
The TDM of soybean increased exponentially until 44 days when the inflection point of the curve occurred, being the dry mass at this point 28.33 g plant-1 (Figure 1B). The maximum CGR
occurred at the inflection point, which was 1.415 g plant-1 day-1 (Figure 1C). The CGR began to
decrease markedly after the maximum point, reaching a minimum value of 0.341 g plant-1 day-1
at 73 DAE. However, the CGR increased again, reaching 1.308 g plant-1 day-1 at 93 DAE, as a
result of the growth of the fruit, leaves and petioles, which was likely due to the nitrogen (urea) fertilization applied at 60 DAE. After 44 DAE, the dry mass continued to increase, but less significantly until the 79 DAE, when the value reached 54.50 g plant-1. The dry mass increased
again more sharply, presenting a final sampled value of 64.29 g plant-1 at 93 DAE. As shown in
Figure 1B, there was never a decrease in TDM production during soybean development because the CGR was always greater than zero. However, it is normal for the TDM to decrease until harvest as a result of falling leaves and petioles (URCHEI et al., 2000).
Table 1. The coefficients k, a, b and c of the equation y = k exp (ax + bx2 + cx3) or k, a and b of y = k exp (ax + bx2), or a, b , c and d of
the equation y = a + bx + cx2 + dx3 fitted to the data of the leaf area (LA), green leaf dry mass (GLDM), petiole dry mass (PEDM), stem
dry mass (SDM), branch dry mass (BDM), pod dry mass (PDM), root dry mass (RDM) and total dry mass (TDM) as a function of time (days after emergence - DAE) in bean and soybean. Their respective correlation coefficients (r) and significance of goodness-of-fit levels are shown.
Variable Coefficient of the equation Goodness of fit
k a b c D r p
Soybean LA 5.925 x10⁻² 0.288 -4.30 x10⁻³ 2.07 x10⁻⁵ - 0.999 ≤ 0.01
GLDM 1.991 x10⁻² 0.280 -3.97 x10⁻³ 1.85 x10⁻⁵ - 0.999 ≤ 0.01
PEDM 5.192 x10⁻⁴ 0.404 -5.80 x10⁻³ 2.73 x10⁻⁵ - 0.998 ≤ 0.01
SDM 3.396 x10⁻² 0.179 -1.73 x10⁻³ 4.88 x10⁻⁶ - 0.995 ≤ 0.01
BDM -
0.611 -0.125 5.02 x10⁻³
-3.28x10⁻⁵
0.977 ≤ 0.01 PDM 4.636 x10⁻²⁵ 2.176 -2.81 x10⁻² 1.23 x10⁻⁴ - 1.000 ≤ 0.01
RDM 1.013 x10⁻² 0.291 -3.9 x10⁻³ 1.81 x10⁻⁵ - 0.998 ≤ 0.01
TDM 5.36 x10⁻² 0.265 -3.45 x10⁻³ 1.53 x10⁻⁵ - 0.999 ≤ 0.01
Bean LA 5.170.10-1
0.121 -3.61 x10⁻⁵
-2.11x10⁻⁵
- 0.993 ≤ 0.01 LDM 1.900.10-1 0.103 1.06 x10⁻³ -3.30x10⁻⁵ - 0.990 ≤ 0.01
PEDM 6.636.10-3 0.236 -2.46 x10⁻³ -3.29x10⁻⁷ - 0.997 ≤ 0.01
SDM 1.875.10—2
0.197 -1.72 x10⁻³
-1.42x10⁻⁶
- 0.995 ≤ 0.01 BDM 5.782.10-3 0.1459 -1.52 x10⁻³ - - 0.908 ≤ 0.05
PDM - 105.61 -7.253 16x10-2
-1.07x10⁻³
1.000 ≤ 0.01 RDM 9.579.10-2 0.188 -1.78 x10⁻³ -3.13x10⁻⁶ - 0.989 ≤ 0.01
TDM 2.547.10-1 0.176 -1.53 x10⁻³ -1.74x10⁻⁶ - 0.976 ≤ 0.01
Acta Scientiarum. Agronomy Maringá, v. 34, n. 3, p. 285-292, July-Sept.,2012
LA (d
m
2 plant -1)
35
30
25
20
15
10
5
0
TDM
(g
plan
t
-1) 70
60
50
40
30
20
10
0
8 16 23 30 37 44 51 58 65 73 79 93 8 16 23 30 37 44 51 58 65 73 79 93 Days after emergence Days after emergence
LAS LAB TDMS TDMB
CGR
(g
p
lan
t
-1 day -1)
2.0
1.5
1.0
0.5
0.0
-0.5
-1.0
-1.5
NAR (g
d
m
-2 da
y
-1) 0.2
0.1
0.0
-0.1
-0.2
-0.3
-0.4
Days after emergence Days after emergence CGRS CGRB NARS NARB
Figure 1. Evolution according to age in days after emergence (DAE) for A) leaf area (LA in dm2
plant-1
), B) total dry mass (TDM in g plant-1), C) crop growth rate (CGR in g plant-1 day-1) and D) net assimilation rate (NAR in g dm-2 of leaves day-1) of soybean, cultivar
BRS Favorita (S) and bean, cultivar BRS Pontal (B).
Table 2. Values of F and the respective coefficients of variation (CV) for leaf area (LA), green leaf dry mass (GLDM), root dry mass (RDM) and total dry mass (TDM) of soybean and bean as a function of age in days after emergence (DAE).
DAE
8 16 23 30 37 44 51 58 65
LA 25.4** 7.1* 1.2ns 14.6** 3.2ns 82.8** 89.3** 410.2** 1.200.0**
CV% 28.6 16.9 14.0 7.2 15.5 8.4 11.5 7.7 6.7
GLDM 34.5** 13.2* 25.2** 3.4ns 0.1ns 22.5** 22.5** 179.0** 883.6**
CV% 24.9 18.8 10.0 7.64 15.1 6.58 16.8 9.4 7.60
RDM 40.4** 33.1** 38.5** 73.0** 9.8* 0.1ns 50.8** 6.8* 56.9**
CV% 29.0 22.3 10.5 11.38 8.0 23.4 7.5 29.1 17.8
TDM 28.2** 18.4** 38.5** 13.6* 0.9ns 9.3* 54.3** 27.9** 105.5** Soybean
x Bean
CV (%) 23.4 16.4 10.5 7.6 10.9 11.8 11.6 11.8 9.4
*, ** and ns = significant at 5%, 1% and not significant, respectively. The comparison was made up to 65 days because of the shorter bean cycle.
Table 3. Comparison of the mean of the leaf area (LA) in dm2 plant-1 and of the values obtained in g plant-1 for green leaf dry
mass (GLDM), root dry mass (RDM) and total dry mass (TDM) of soybean and bean as a function of age in days after emergence (DAE).
DAE
8 16 23 30 37 44 51 58 65
LA Soybean 0.45b 2.06b 6.44a 13.47a 18.16a 25.41ª 29.15a 33.90ª 32.57a Bean 1.38a 2.83a 7.16a 11.09b 14.93a 14.61b 13.00b 9.83b 3.31b GLDM Soybean 0.15b 0.68b 1.77b 4.62a 6.61a 9.28ª 12.54a 15.58ª 12.94a Bean 0.46a 1.11a 2.53a 5.11a 6.44a 7.44b 7.02b 5.99b 1.47b RDM Soybean 0.09b 0.40b 3.96b 3.01b 5.92b 9.76ª 9.92a 14.64ª 12.35a
Bean 0.410a 1.06a 6.34a 6.16a 7.07a 10.36ª 6.77b 8.44b 4.39b
TDM Soybean 0.39b 1.51b 3.96b 11.77b 19.26a 29.82ª 36.39a 47.79ª 46.46a Bean 0.99a 2.52a 6.34a 13.77a 17.88a 23.08b 19.46b 30.55b 22.83b
* The means of the original values observed in the field followed by the same letter in the same line do not differ according to the Tukey test at a 5% probability level.
A B
8 16 23 30 37 44 51 58 65 73 79 93
8 16 23 30 37 44 51 58 65 73 79 93
Biomass partitioning in soybean and bean 289
Acta Scientiarum. Agronomy Maringá, v. 34, n. 3, p. 285-292, July-Sept.,2012
The TDM of the bean plants increased exponentially until 37 DAE, when the inflection point of the curve occurred, being the dry mass at this point 19.12 g plant-1 (Figure 1B). The
maximum CGR of 1.050 g plant-1 day-1 occurred at
the inflection point (Figure 1C). After 37 DAE, the dry mass continued to grow, but less markedly, until it reached a maximum value of 29.36 g plant-1 on the
51 DAE, when it also had a CGR of zero, i.e., when the dry mass produced was equal to that which was lost. From 51 DAE onward, the bean plants started to lose more mass than they produced, which was primarily due to leaf (LDM) and root death (RDM), and the CGR had negative values starting at 58 DAE (-0.550 g plant-1 day-1) until reaching -1.016 g plant-1
day-1 at 65 DAE.
The TDM of the bean plants was higher than that of the soy plants until 30 DAE, with no significant differences on 37 DAE (p ≥ 0.05); however, the TDM of the soy plants was higher than that of the bean plants from 37 DAE onward (Table 2 and 3).
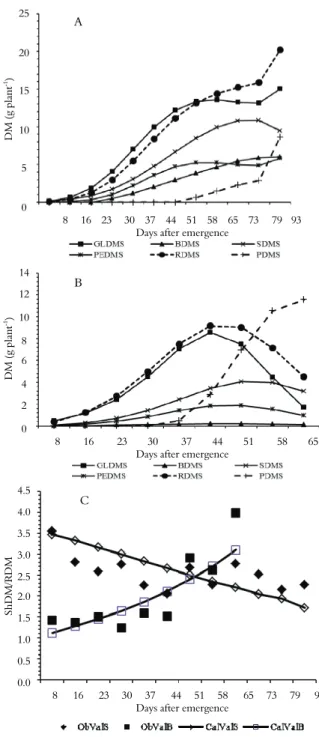
Figures 2A and B show the partitions of the phytomass among different organs of soybean and bean during their ontogenetic development.
Differential allocation of photosynthates occurs among the organs of soybean during their development, with the roots (RDM) and leaves (GLDM) especially benefiting (Figure 2A).
The root and leaf growth of bean plants followed a mathematical model similar to that of soybean. As shown in Figure 2B, the allocation of photosynthates to the roots in bean plants was prevalent until approximately 51 DAE, when the pod mass (PDM) surpassed RDM. Soybean photosynthates were principally retained by or allocated to the leaves until 58 DAE, when the roots (RDM) began to predominate, which continued until the end of the growth cycle (Figure 2A). In the bean plants, allocation to the roots was always higher than to the leaves (Figure 2B).
The GLDM of the bean plants increased from 0.46 g plant-1 at 8 DAE to a maximum value of 8.54 g
plant-1 at 44 DAE and decreased continuously
thereafter until reaching 1.68 g plant-1 at 65 DAE
(Figure 2B). The source organ or assimilatory surface disappears distinctly and early for bean, which does not occur in soybean. As shown in Figure 1A, the leaf area behaved similarly to GLDM, Figure 2A as expected.
The GLDM of soybean was lower than that of bean at the beginning of the vegetative stage, but their GLDMs did not differ at either 30 or 37 DAE (p ≥ 0.05). After this point, the soybean GLDM was
higher (Table 2 and 3), a pattern that was not observed with the RDM. Instead, the soybean RDM reached that of beans at 44 DAE (14 days later). The bean RDM was higher than that of soybeans until 37 DAE; the RDM values did not differ at 44 DAE (p ≥ 0.05), but the soybean RDM was greater after that day (Table 2 and 3).
DM
(g
plan
t
-1) 25
20
15
10
5
0
8 16 23 30 37 44 51 58 65 73 79 93 Days after emergence
DM
(g
plan
t
-1) 14
12
10
8
6
4
2
0
8 16 23 30 37 44 51 58 65 Days after emergence
ShDM
/R
DM
4.5
4.0
3.5
3.0
2.5
2.0
1.5
1.0
0.5
0.0
8 16 23 30 37 44 51 58 65 73 79 93 Days after emergence
Figure 2. Evolution of the dry mass (DM) of the green leaves (GLDM), branches (BDM), stems (SDM), petioles (PEDM), roots (RDM) and pods (PDM) of (A) soybean plants and (B) common bean plants and (C) the ratio of the shoot dry mass (ShDM)/root dry mass (RDM) in soybean (S) and bean (B) as a function of the plant age in days after emergence (observed value – Ob Val and calculated value – CalVal).
A
B
Acta Scientiarum. Agronomy Maringá, v. 34, n. 3, p. 285-292, July-Sept.,2012
Although initially less than that of bean, fast and long-lasting growth of soybean leaves (Figures 1A and 2A) is a strategy for intercepting enough light to supply both the leaves and other organs, especially the roots, with photosynthates. In the case of bean, the leaves should ideally remain green and metabolically active for a longer period, allocating photosynthates and properly supplying the other plant organs, especially the roots and fruit throughout its cycle as well as any nodules that may exist, thereby prolonging their activity for N fixation. However, the opposite occurs; the leaves begin to senesce too early from 44 DAE, resulting in a reduced source size (leaves) that cannot simultaneously supply the sink organs.
Comparing Figures 2A and 2B, the allocation of photosynthates to the roots of soybean increases consistently throughout the life cycle; there is no limitation of photosynthates, unlike in bean plants, where the RDM declines sharply at 44 DAE, 13 days before the onset of physiological maturation at 57 DAE. After 44 DAE, most of the photosynthates in the bean were directed to the pods at the expense of the roots, which partially died, as did other organs. The RDM reduction in bean may have occurred due to a reallocation of the root phytomass to supply the pods.
The shoot dry mass (ShDM)/root dry mass (RDM) ratio provides further evidence of the limited photosynthates available to bean roots (Figure 2C). For soybean, the negative logistic equation (ŷ = 3.55/(1 + (x/88.89)) 1,56, where r = 0.75, and p ≤ 0.01), best fit to the results of the ShDM/RDM ratio; for bean, the exponential equation (ŷ = 0.96.exp(1,787.10-2x), r = 0.84 and
p ≤ 0.01) best fit. The observed soybean values varied from a maximum value of 3.54 at 8 DAE to a minimum of 2.06 at 44 DAE; in contrast, the lowest value (1.24) in bean occurred at 30 DAE. There was exponential growth in bean, with an observed value of 3.98 at 65 DAE. Most of the phytomass in the bean from 37 to 44 DAE was allocated to fill pods at the expense of roots.
The soybean stems were the only organ to show a drop in the dry mass at the last sampling, with 9.493 g plant-1 measured at 93 days; the stems,
unlike the other organs, had no growth rebound. As reported in the literature (EGLI; CRAFTS-BRANDNER, 1996; OSAKI et al., 2004), the drop in SDM can be interpreted as a reallocation of the phytomass to supply the great demand of the roots as well as that of the leaves and the developing pods.
The bean stem dry mass grew to a maximum value of 4.05 g plant-1 at 51 DAE and fell to 3.19 g
plant-1 at 65 DAE. In the case of bean, the drop in
SDM may be a reallocation of stored phytomass to supply the great demand in the developing pods.
Although photosynthates were allocated for pod growth in soybean, there was apparently no detriment to other organs, especially the leaves and roots, which suggests that the leaves were effective in producing photosynthates to supply both themselves and other organs (Figure 2A).
There was an intense allocation of photosynthates to fruit production in bean beginning at 37 DAE at the expense of the leaves and roots (Figure 2 B). The large mass losses in the leaves and roots resulted in a reduced TDM, even with the intense allocation for fruit production. Similar results of the dry mass and leaf area were found by Andrade et al., (2009) in addition to the dry mass of the pods.
In soybean, the root dry mass increased consistently throughout the life cycle, indicating that the allocation of photosynthates to these organs was not interrupted, even though photoassimilates were directed to fruit production. Except for the shoot dry mass, which decreased between 79 and 93 DAE, all of the other soybean organs grew. These results indicate that Bacteroides present in any soybean root nodules do not suffer from limitations in the photosynthate supply, which is essential as a source of energy (ATP) and reducers (NADH) in the N fixation and assimilation processes. On the other hand, Bacteroides present in any bean nodules lose their fixation and assimilation function, as described in the literature (GRANGE et al., 2007; HUNGRIA et al., 2003; MENDES et al., 2008; SODEK, 2008). The loss of fixation efficiency by Bacteroides in bean nodules after flowering has been reported, although it was attributed to other factors such as high temperature, drought and soil acidity (HUNGRIA; VARGAS, 2000).
In the final partition of the soybean photoassimilates at 93 DAE, the proportions compared to 100% TDM are as follows: GLDM = 23%, PEDM = 9%, BDM = 9%, SDM = 15%, RDM = 31% and PDM = 13% (roots with the largest share).
In the final partition of the bean photoassimilates at 65 DAE, the proportions compared to 100% TDM are as follows: GLDM = 8%, PEDM = 5%, BDM = 1%, SDM = 14%, RDM = 20% and, PDM = 52% (pods with the largest share).
Biomass partitioning in soybean and bean 291
Acta Scientiarum. Agronomy Maringá, v. 34, n. 3, p. 285-292, July-Sept.,2012
at 8 DAE. This value decreased gradually until reaching a minimum of 0.011 g dm-2 day-1 at 73
DAE, with a subsequent increase to 0.042 g dm-2
day-1 at 93 DAE, which can be explained by
fertilization with urea at 60 DAE. The NAR was positive throughout all stages of soybean development, indicating that there was no deficiency of photosynthates to its various organs.
The bean NAR at 8 DAE was 0.105 g dm-2 day-1,
which was 62% lower than that of the soybean, even though there was a greater leaf area until 16 DAE (Figure 1A and Tables 2 and 3). Unlike soybeans in which the NAR gradually decreased, the bean NAR was more or less constant until 23 DAE because the LA did not differ (p ≥ 0.05). Therefore, the NAR value was very similar to that of the soybean on that day (soybean = 0.101 and bean = 0.102 g dm-2
day-1). The bean plant value was higher than that of
the soybean at 30 DAE (soybean = 0.083 and bean = 0.089 g dm-2 day-1, 6.7% higher) and 37 DAE
(soybean = 0.067 and bean = 0.071 g dm-2 day-1,
5.6% higher). After 44 days, the bean NAR fell below the soybean value again, becoming negative at 51 DAE and reaching -0.29 g dm-2 day-1 at 65 DAE.
This value is 2.76 times lower in absolute values than the highest value (0.105 g dm-2 day-1), which
was recorded on 8 DAE.
The soybean NAR values demonstrate its high capacity for keeping organs actively metabolizing throughout the cycle, especially the roots. On the other hand, as shown in Figure 2B, the bean NAR values became deficient when blooming occurred because fruit production (pods) was favored at the expense of the other organs.
The soybean NAR value being higher than the bean NAR at the beginning of their life cycles (up to 16 days) can be explained by the behavior of their cotyledons. In addition to working as photoassimilate repositories, soybean cotyledons become green and expand, suggesting that their amyloplasts are transformed into chloroplasts. Thus, it is assumed that they become very strong sources of photoassimilates because they function both as reservoir and producers. The same situation does not occur in bean plants, whose cotyledons do not undergo the same changes as those of soybean. In contrast, the bean drain their reserves too quickly, causing the plant to depend on the leaves as the only source of photosynthate.
According to the literature (KVET et al., 1971), the NAR value depends more directly on incident radiation in the culture than any other environmental factor, and this correlation is highly positive. Due to the increase in the mutual leaf shading, the NAR value may appear negatively
correlated with the LA value and consequently with all of the factors that lead to increased LA (nitrogen, plant density, high level of water supply, among others). However, the NAR value also decreases with leaf age due to a decline in the net photosynthesis rates (SUZUKI et al., 1987). After adulthood when the rates of photosynthesis are highest, the leaves begin the process of senescence with a gradual reduction in the photosynthesis/respiration relationship. The leaves present reduced or negative net photosynthetic rates due to metabolism and hydrolysis and to the reallocation of nutrients (FALQUETO et al., 2010; KITAGIMA et al., 2002) and the rates of CO2
respiratory loss surpass those that are fixed photosynthetically, results in more significantly reduced NAR values.
Conclusion
The partition of photosynthates in the Favorita soybean cultivar at 93 DAE is as follows: GLDM = 23%, PEDM = 9%, BDM = 9%, SDM = 15%, RDM = 31% and PDM = 13%, with the roots predominating. In the BRS Pontal bean cultivar at 65 DAE the partition is as follows: GLDM = 8%, PEDM = 5%, BDM = 1%, SDM = 14%, RDM = 20% and PDM = 52%, with the pods predominating. In soybean, the leaf area remained active until physiological maturity. A continual and prevailing allocation of photosynthates to the roots throughout both vegetative and reproductive development was observed, providing strong evidence that the nodules remain active until the end of the growth cycle in this legume. In the bean cultivar, the leaves senesce too early, resulting in a reduced source size with photosynthates primarily allocated to the fruit at the expense of the roots. This can affect its ability to maintain active nodules until the end of its growth cycle, which will necessitate the use of nitrogen fertilization to keep the leaves green unless new varieties are developed that can metabolize and allocate photosynthates to the roots until the end of the culture cycle.
Acknowledgements
A co-author gratefully acknowledges CNPq for the Scientific Initiation Scholarship.
References
Acta Scientiarum. Agronomy Maringá, v. 34, n. 3, p. 285-292, July-Sept.,2012
isolados de solos da Amazônia e eficiência simbiótica em feijão caupi. Acta Scientiarum. Agronomy, v. 32, n. 1, p. 161-169, 2010.
DANTAS, B. F.; RIBEIRO, L. S.; PEREIRA, M. S. Teores de açúcares solúveis e insolúveis em folhas de videiras, cv. syrah, em diferentes posições no ramo e épocas do ano. Revista Brasileira de Fruticultura, v. 29, n. 1, p. 42-47, 2007.
EGLI, D. B.; CRAFTS-BRANDNER, S. J. Photoassimilate distribution in plants and crops. In: ZAMSKI, E.; SHAFFER, A. A. (Ed.). Soybean. New York: Marcel Dekker, 1996. p. 595-623.
FALQUETO, A. R.; SILVA, F. S. P.; CASSOL, D.; MAGALHÃES JUNIOR, A. M.; OLIVEIRA, A. C.; BACARIN, M. A. Chlorophyll fluorescence in Rice: probing of senescence driven changes of PS II activity on rice varieties differing in grain yield capacity. Brazilian Journal of Plant Physiology, v. 22, n. 1, p. 35-41, 2010. GONZÁLES, T. O.; CAMPANHARO, J. C.; LEMOS, E. G. M. Genetic characterization and nitrogen fixation capacity of Rhizobium strains on common bean. Pesquisa Agropecuária Brasileira, v. 43, n. 9, p. 1177-1184, 2008. GRANGE, L.; HUNGRIA, M.; GRAHAM, P.; MARTINEZ-ROMERO, E. New insights into the origins and evolution of rhizobia that nodulate common bean (Phaseolus vulgaris) in Brazil. Soil Biology and Biochemistry, v. 39, n. 4, p. 867-876, 2007.
HUNGRIA, M.; VARGAS, M. A. T. Environmental factors affecting N2 fixation in grain legumes in the
tropics, with an emphasis on Brazil. Field Crops Research, v. 65, n. 2-3, p. 151-164, 2000.
HUNGRIA, M.; CAMPO, R. J.; MENDES, I. C. Benefits of inoculation of the commom bean (Phaseolus vulgaris) crop with efficient and competitive Rhizobium tropici strains. Biology and Fertility of Soils, v. 39, n. 2, p. 88-93, 2003.
KITAGIMA, K.; MULKEY, S. S.; SAMANIAGO, M.; WRIGHT, S. J. Decline of photosynthetic capacity with leaf age and position in two tropical pioneer tree species.
American Journal of Botany, v. 12, n. 89, p. 1925-1932, 2002.
KVET, J.; ONDOC, J. P.; NECAS, J.; JARVIS, P. G. Methods of growth analysis. In: SESTÁK, Z. (Ed.). Plant photosynthetic production; manual of methods. The Hague: W. Junk N. V. Publishers, 1971. p. 343-391.
LALONDE, L.; DANIEL, W.; FROMMER, W. B. Transport mechanisms for organic forms of carbon and nitrogen between source and sink. Annual Review of Plant Biology, v. 55, p. 341-372, 2004.
LAYZELL, D. B.; RAINBIRD, R. M.; ATKINS, C. A.; PATE, J. S. Economy of photosynthate use in nitrogen-fixing
legume nodules. Observations on two contrasting symbioses. Plant Physiology, v. 64, n. 5, p. 888-891, 1979. MENDES, I. C.; REIS JÚNIOR, F. B.; HUNGRIA, M.; SOUZA, D. M. G.; CAMPO, R. J. Adubação nitrogenada suplementar em latossolo do Cerrado. Pesquisa Agropecuária Brasileira, v. 43, n. 8, p. 1053-1060, 2008. OSAKI, M.; SHINANO, T.; YAMADA, M.; YAMADA, S. Function of node unit in photosynthate distribution to root in higher plant. Photosynthetica, v. 42, n. 1, p. 123-131, 2004.
PORTES, T. A.; CARVALHO, S. I. C. Crescimento e alocação de fitomassa de cinco gramíneas forrageiras em condições de Cerrado. Revista de Biologia Neotropical, v. 6, n. 2, p. 1-14, 2009.
RAYMOND, J.; SIEFERT, J. J. L.; STAPLES, C. R.; BLANKENSHIP, R. E. The natural history of nitrogen fixation. Molecular Biology and Evolution, v. 21, n. 3, p. 541-554, 2004.
SANDRIN, C. Z.; DOMINGOS, M.; FIGUEIREDO RIBEIRO, R. C. L. Partitioning of water soluble carbohydrates in vegetative tissues of Lolium multiflorum
Lam. Ssp. Italicum cv. Lema. Brazilian Journal of Plant Physiology, v. 18, n. 2, p. 299-305, 2006.
SODEK, L. Metabolismo do Nitrogênio. In: KERBAUY, G. B. (Ed.). Fisiologia Vegetal. Rio de Janeiro: Guanabara Koogan, 2008. p. 150-164.
SUZUKI, S.; NAKAMOTO, H.; KU, M. S. B.; EDWARDS, G. E. Influence of leaf age on photosynthesis, enzyme activity, and metabolite levels in wheat. Plant Physiology, v. 84, n. 4, p. 1244-1248, 1987. TAIZ, L.; ZEIGER, E. Fisiologia Vegetal. 4. ed. Porto Alegre: Artmed, 2008.
TANAKA, A.; FUGITA, K. Growth, photosynthesis and yield components in relation to grain yield of the field bean. Journal of the Faculty of Agriculture, v. 59, n. 2, p. 145-238, 1979.
URCHEI, M. A.; RODRIGUES, J. D.; STONE, L. F. Análise de crescimento de duas cultivares de feijoeiro sob irrigação, em plantio direto e preparo convencional.
Pesquisa Agropecuária Brasileira, v. 35, n. 3, p. 497-506, 2000.
Received on July 7, 2011. Accepted on October 3, 2011.