TRANSACTION COSTS: AN EMPIRICAL ANALYSIS
OF THEIR RELATIONSHIP WITH INVESTMENT AND
FOREIGN DIRECT INVESTMENT
CUSTOS DE TRANSAÇÃO: UMA ANÁLISE EMPÍRICA DA SUA RELAÇÃO COM INVESTIMENTO E INVESTIMENTO DIRETO ESTRANGEIRO
COSTOS DE TRANSACCIÓN: UN ANÁLISIS EMPÍRICO DE SU RELACIÓN CON LA INVERSIÓN Y LA INVERSIÓN EXTRANJERA DIRECTA
Marcos Vinício Wink Junior [email protected]
Master in Economics at Escola de Economia de São Paulo, Fundação Getulio Vargas – São Paulo – SP, Brazil. Researcher at Fundação de Economia e Estatística do Rio Grande do Sul – Porto Alegre – RS, Brazil
Hsia Hua Sheng [email protected]
Professor at Escola de Administração de Empresas de São Paulo, Fundação Getulio Vargas – São Paulo – SP, Brazil. Director at Luz Engenharia Financeira – São Paulo – SP, Brazil
William Eid Junior [email protected]
Professor at Escola de Administração de Empresas de São Paulo, Fundação Getulio Vargas – São Paulo – SP, Brazil
Submitted 15.09.2010. Approved 18.03.2011 Evaluated in double blind review
Scientific Editor: Fernanda F. Perobelli
ABSTRACT
As stated by the New Institutional Economics theory, transaction costs play a relevant role in economics and, according to the extent of such costs, agents make investment decisions. Actually, transaction costs may represent a disincentive to entre-preneurship. This work aims to verify whether transaction costs are related to investment rate and foreign direct investment rate (FDI) in different business environments. The results suggest that foreign investors do not have precise information about other countries as domestic investors do; as it is observed, only the relation between transaction costs and investment rate is significant. Furthermore, there is evidence that the business environments of BRIC countries are less developed when compared to business environments of other countries in the study.
KEYWORDS Transaction costs, foreign direct investment, investment rate, BRICs, business environment.
RESUMO De acordo com a teoria desenvolvida pela Nova Economia Institucional, os custos de transação têm um papel relevante na economia e de acordo com a extensão desses custos os agentes tomam decisões de investimento. Dessa forma, os custos de transação também representam um desestímulo ao empreendedorismo. Este trabalho tem como objetivo verificar se os custos de transação têm relação com variáveis como a taxa de investimento e o investimento direto estrangeiro (IDE). Os resultados encontrados sugerem que os investidores estrangeiros não possuem informações acuradas sobre os outros países, ao contrário do que ocorre com os investidores nacionais. Dessa forma, os custos de transação só são significativos quando a variável dependente analisada é a taxa de investimento. Além disso, há evidência de que os ambientes de negócios observados nos países do grupo BRIC estão menos desenvolvidos em comparação com outros países presentes no estudo.
PALAVRAS-CHAVE Custos de transação, investimento direto estrangeiro, taxa de investimento, BRICs, ambiente de negócios.
RESUMEN Como se ha señalado por la teoría de la Nueva Economía Institucional, los costos de transacción desempeñan un papel relevante en la economía y de acuerdo con la extensión de estos costos los agentes toman decisiones de inversión. Así pues, los costos de transacción también repre-sentan un desincentivo a la iniciativa empresarial. Este estudio pretende verificar si los costos de transacción tienen relación con variables como la tasa de inversión y la tasa de inversión extranjera directa (IED). Los resultados sugieren que los inversores extranjeros no tienen información precisa acerca de otros países, a diferencia de lo que sucede con los inversores nacionales. Por lo tanto, los costos de transacción son sólo significativos cuando la variable dependiente que se analiza es la tasa de inversión. Además, existe evidencia de que los entornos empresariales observados en los países BRIC están menos desarrollados en comparación con los entornos empresariales de otros países presentes en el estudio.
INTRODUCTION
New Institutional Economics, unlike neoclassical eco-nomic theory, emphasizes the role of transaction costs in the economy. According to this school of thought, transaction costs exist and are taken into account when taking a decision about making an investment or starting a business. Thus, the market cannot operate efficiently.
According to Arrow (1969), transaction costs are the costs of the economy’s operating system. More recently they have been given a wider interpretation that includes some costs that exhibit international traits. Thus, Furubotn and Richter (1997) define transaction costs as being those that result from the creation, operation, maintenance and modification of institutions.
Investment rates and foreign direct investment are es-sential to a sector’s productive growth in an economy and also contribute, in the case of foreign direct investment, to the equilibrium of the balance of payments. Therefore, attracting investment is considered to be beneficial for a country. Nevertheless, decisions on the investment rate and foreign direct investment do not only take into ac-count the economy’s interest rate. There are many factors that make an industry attractive to more investment. Included among these factors are uncertainty levels when it comes to invested property capital and the degree of difficulty in doing business. The variables relating to this investment risk and business rigidity are called transac-tion costs by Williamson (1979). The reason for this is that the investment risk increases if a country does not guarantee property rights. However, monitoring capital and seeking information regarding investment guarantees leads to costs for the investor. Thus, investment risks and an environment favorable to capital attraction are closely connected to transaction costs, either directly or indirectly. These types of transaction costs create disincentives to new business and may, for example, negatively influence a local entrepreneur’s decision to form a partnership with a foreign entrepreneur or a multinational’s decision to go into business in another country.
The purpose of this study is to verify the behavior of the investment rate and foreign direct investment through transaction cost variables, measured using market imperfections and economic freedom indices, and also to provide a comparative analysis of the various business environments in different countries.
This study’s contribution, therefore, is the analysis of the impact of transaction costs on non-specific invest-ments (the economy’s investment rate and foreign direct investment), unlike most of the studies in this area, which
have tried to verify the negative impact of transaction costs on specific sectors or industries. Furthermore, its variables have been recently created by Doing Business and by the Heritage Foundation as a means of measuring transaction costs. These variables will therefore be used in this work as measures of transaction cost. It uses a sample of 35 countries (Organization for Economic Co-Operation and Development members - OECD, Brazil, Russia, India and China, and South Africa - BRICS) over a 4-year period (2004 – 2007).
Along with this introduction and the conclusion, this study contains five other sections. The first is a literature review of transaction costs. The second part is an expla-nation of the methodology and is followed by the third section, which presents a summary of the different busi-ness environments in the countries contained within the sample. Section 4 describes the main results as well as their interpretation and section 5 presents the main conclusions.
TRANSACTION COSTS AND INVESTMENT
DECISIONS: A LITERATURE REVIEW
Market imperfections, namely transaction costs, have been at the center of an important debate in economics that began in the latter half of the 20th century. Among the authors who brought the main concepts of transaction costs and their disadvantages to light are Coase (1960), Arrow (1969), Williamson (1979), North (1984 and 1990) and Mankiw (1985)
Furubotn and Richter (1997) believe that, most of the time, there are great differences between prices of similar – sometimes identical – products. Be that as it may, consumers prefer not to seek information regarding the price of products in other shops. The authors state that the difference between the observed price and the average price is a measure of the scale of the transaction cost. They also consider that the final stage transaction costs of the production process are equal to 10% of the final price paid by the consumer. Therefore, they argue that, when one takes into account all the different links in the production chain, transaction costs may represent as much as 60% of the final price of the product.
Wallis and North (1988) estimate the transaction costs for the American economy in 1970. Their results indicate that transaction costs may have represented as much as 55% of Gross Domestic Product (GDP) at that time. In a historical perspective, the authors also analyze the percentage of transaction costs in relation to GDP for the decades from 1870 until 1970. According to the authors, transaction costs’ share of the economy increased by more than 200% over the course of this period.
The impact of transaction costs on investments has frequently been the subject of study, and this can be ob-served in the literature. The main authors in this area are Fazzari et al. (1988), Whited (1992), Schaller (1993), and Faroque and Ton-That (1995). In general, these authors have shown that the presence of transaction costs has a negative impact on the investment level in certain specific industries in different countries.
Sara and Newhouse (1995) used Heritage Foundation data to study the impact of economic freedom and busi-ness environment indicators on developing countries’ flows of direct foreign investment. It was found that countries with poor international trade, regulation and property rights policies tend to have lower inflows of foreign investment. According to Benjamin and Phimister (1997), the presence of transaction costs prevents the credit market from operating in a really efficient way. They also argue that the imperfection of this market has a negative impact on investments. Countries which have a high share of transaction costs in their economy therefore tend to have restrictions in their credit markets, and consequently have low investment rates and thus low economic growth.
Maher (1997) includes case studies for different indus-tries and indus-tries to verify the relationship between contracts in an environment with transaction costs. In order to do this, the following four industries were analyzed: the automotive, mechanical engineering, electronic and gas
industries. The author finds evidence that the best form of governance, in terms of reducing transaction costs, comes from the market. Hence, the issue of opportunism, which is considered one of the main transaction costs, is diminished and, as a consequence, it favors the attraction of investment to this sector, according to the empirical results of the study.
Dunning (1994) states that during the 1990’s, countries and firms underwent structural changes which were aimed at making foreign direct investment more attractive. Such changes relate to greater equilibrium between domestic and foreign accounts, a strong privatization program with the purpose of reducing bureaucracy and increasing mar-ket share in the supply of goods and services and, finally, a stimulus towards greater autonomy for the Central Bank. The aforementioned changes ended up promoting the reduction of transaction costs. According to the author, these changes would enable a greater capital flow and the financing of the balance of payments of several countries. On the other hand, Macaulay (1963, 1985) argues that commercial transactions are primarily non-contractual and, thus, transaction costs would not have such a relevant impact on the economy. Williamson (1985) credits such evidence to the fact that transaction costs affect invest-ments only when they are specific to a particular sector of the economy, and, in cases where they are not, the market solution will be efficient. This occurs due to the high risk of obtaining information in an unknown market, the high costs of monitoring the agents and their limited rationality.
With regard to investment determinants in Brazil, Bacha and Bonelli (2005) analyze the evolution of the Brazilian relative investment price from 1950 to 2000. They notice a sharp growth in this price, especially from 1950 to 1990 when it more than doubled. The authors state that this acceleration was caused, among other things, by the rise in the price of machinery and equip-ment. The authors list a series of possible explanations for this phenomenon: an increase in the oligopolistic power of industries, inefficiency in the production process of capital goods, an increased demand for durable goods, the defensive pricing behavior of the oligopolies and, finally, errors in the measurement of price indices.
growth. According to Rodrik (2008), developing countries have high transaction costs in the steps of the tradable goods production process and that makes it difficult for such countries to export. Hence, according to the author, the devaluation of the exchange rate would reduce the negative effects of transaction costs on the export of such goods, thus generating more income for these economies. This theory has recently been applied to many other areas, both inside and outside the economy, according to Macher and Richman (2008). Among the areas in which this theory has been applied are accounting, finance, marketing and industrial organization. In relation to ac-counting, Cooper and Slagmulder (2004) argue that, by detecting transaction costs and establishing organizational innovations, it is possible to reduce production costs. In the finance area, Benmelech and others (2005) found a negative relation between the ability to enforce contracts and interest rates on loans. As for marketing strategies, Murray (2001) states that, with globalization, the creation of new global strategic alliances reduces the impact of transaction costs on investments in specific assets. Finally, the literature regarding industrial organization has been engaged in obtaining the best kinds of governance practices so that transaction costs are reduced, according to Richman (2006).
DATA AND METHODOLOGY
This study uses a sample of 35 countries selected accord-ing to their participation in the world economy, with annual data from 2004 to 2007. The countries are listed in Exhibit 1.
The dependent variable will be the Investment Rate and Foreign Direct Investment (capital influx) obtained from the Penn World Table and the OECD, respectively. It is assumed that the investment rate and foreign direct investment are functions of macroeconomic variables
(such as the interest rate, market size, inflation etc) as well as of transaction costs variables. The following items shall be used as transaction cost measures:
a) Economic freedom indices (with scores ranging from 0 to 100, where 100 means the maximum free market, which are provided by the Heritage Foundation. b) Business data (variables such as investment cost, level
of commercial openness etc), which are provided by Penn World Table.
c) Instruments of business regulation (property rights, time required to open and close a business etc), which are provided by Doing Business.
The description of all the variables used in this study is given in Exhibit 2.
The empirical strategy used in section 4 will therefore be a panel data model, with control for the fixed effect of each country (ai), estimated by Ordinary Least Square (OLS) for equations (1) and (2):
(1)
(2)
In which:
is the investment rate of country i in period t. is the direct foreign investment inflow in millions of
Dollars for country i in period t.
represents the vectors with dimensions k or n of tran-saction cost variables of country i in period t. represents the vectors with dimensions j or m of
ma-croeconomic variables of country i in period t.
The advantage of using an estimation model with fixed ef-fect control is that there may be variables which afef-fect the dependent variables and are correlated to the explanatory
Australia Denmark Ireland Netherlands South Africa
Austria Finland Island New Zealand Spain
Belgium France Italy Norway Sweden
Brazil Germany Japan Poland Switzerland
Canada Greece Korea Portugal Turkey
China Hungary Luxembourg Russia United Kingdom
Czech Republic India Mexico Slovakia United States
Exhibit 2 – Description of the variables used in this work
VARIABLE DESCRIPTION
Population Thousands of inhabitants
Exchange Rate In relation to the Dollar
Per Capita Product Per capita product in Dollar
Government Participation Per capita tax burden / Per capita gross domestic product
Investment Rate Investment /GDP
Investment Price In relation to GDP and in Puchasing Power Parity
Openness Level (Exports+Imports)/GDP
GDP over GNP GDP/GNP in Purchasing Power Parity
GDP Growth Per Capita Rate per year
Foreign Direct Investment (US$ millions) Influx in millions of Dollars
Overall Score 0-100, 100 being the highest mark
Freedom of Business 0-100, 100 being the highest mark
Freedom of Commerce 0-100, 100 being the highest mark
Fiscal Freedom 0-100, 100 being the highest mark
Freedom of Government 0-100, 100 being the highest mark
Monetary Freedom 0-100, 100 being the highest mark
Investmente Freedom 0-100, 100 being the highest mark
Financial Freedom 0-100, 100 being the highest mark
Property Right 0-100, 100 being the highest mark
Freedom of Corruption 0-100, 100 being the highest mark
Freedom of Work 0-100, 100 being the highest mark
Days to Open a Business In days
Costs to Open a Business % of per capita income
Difficulty to Hire Index from 0 to 100, 100 is the more rigid
Working Hours Rigidity Index from 0 to 100, 100 is the more rigid
Time to Register a Property In days
Costs of Registering a Property % of property’s value
Time to Enforce Contracts In days
Costs of Enforcing Contracts % of complaints
Time to Close a Business In years
Costs of Closing a Business % of state
Short Term Interest Rat % per year
Long Term Interest Rate % per year
Country Risk 1-4, 4 being the most risky
ones but which are not included in this model. Thus, by assuming that such variables are fixed for each country, there is no risk of biased estimations. In this way, fixed effect estimation is always consistent. However, fixed ef-fect estimation is not always the most efficient choice. The tests that corroborate the choice of fixed effect estimation will be discussed later.
The definition of the set of variables to be used was chosen ad hoc. The transaction cost variables are the variables of interest. The economic freedom indices are taken from the same source as those used by Sara and Newhouse (1995). The innovation of this study in relation to Sara and Newhouse (1995) is, firstly, its examination of economic variables for the different countries, since the sample includes both developed and developing countries. The second innovative aspect of this study is the use of business environment variables provided by Doing Business.
The expected signs of variables used are described in Exhbit 3. According to the literature that has al-ready been mentioned it is expected that transaction cost variables are negatively associated with the investment rate and direct foreign investment. Hence, countries with greater economic freedom and better business environments tend to have higher investment rates and higher inward flows of direct foreign investment. However, as is also shown in the literature review, there are questions relating to limited rationality that may hinder the monitoring of transaction costs. The macroeconomic variables were used as controls. However, it is expected that countries with better macro-economic scenarios will present higher investment rates and higher levels of foreign direct investment.
DIFFERENT INVESTMENT ENVIRONMENTS
In order to compare the different business environments of the countries in the sample, the determinant investment variables were divided into two groups: macroeconomic variables and transaction cost variables. Another im-portant distinction relates to the groups of countries. The analysis focused on verifying the above-mentioned variables for the entire sample and for two subdivisions:
1. BRICs – Brazil, Russia, India and China
2. PIIGS – Portugal, Ireland, Italy, Greece and Spain
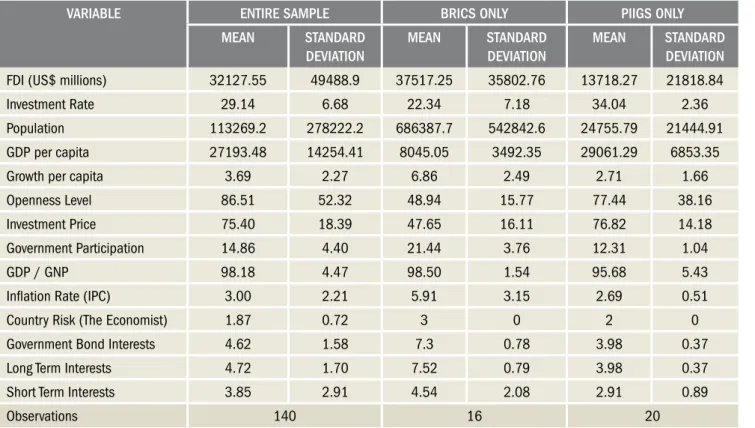
Table 1 shows the descriptive statistics of the macroeco-nomic variables for the entire sample and separately for the BRICs and the PIIGS.
It is worth noting that the BRICs have higher mean direct foreign investment and higher mean per capita economic growth. This is because they are developing countries and the investment flows are bound to go to countries with high interest rates. As can be observed in Table 1, the interest rates in developing countries are higher. It should also be noted that the BRICs have higher investment rates. Whereas domestic investment in relation to domestic product is on average 30% for all the countries in the sample, the investment rate in the BRICs is approximately 20%. Moreover, on average the investment price in the BRICs is lower than in other countries. This may be due to the fact that the labor force price in developing countries is lower than in developed countries.
The other variables displayed in table 1 show that the BRICs also present macroeconomic indicators peculiar to developing countries. For instance, per capita income is much lower in the BRICs than in the rest of sample while their inflation rate is much higher than in the developed countries. Similar results are observed in relation to the level of openness, which shows that trading levels are still lower in the BRICs than in the developed countries. Country risk is higher than the mean of the sample both for the BRICs and for the PIIGs, which indicates that, in general, these countries have worse institutions. It should also be noted that the country risk is the same for country groups. In the case of the PIIGS, similar results are found between this group and the average of the countries in the sample.
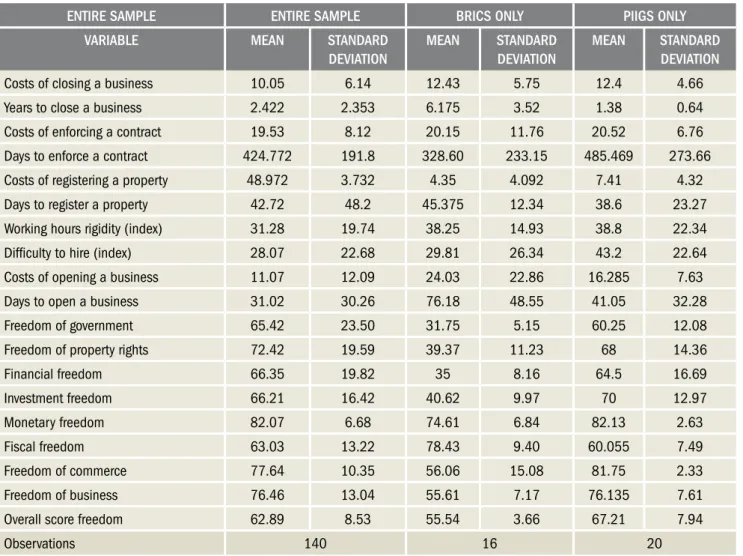
Table 5 presents the descriptive statistics of the transac-tion cost variables of the countries in the sample.
According to Table 5, it can be verified that most indicators of business rigidity and economic freedom in the BRICs are below the indicators of developed countries. This fact is evidence of the greater difficulty of doing business in these countries. In the Heritage Foundation economic freedom indices, for instance, it can be observed that the scores of the BRICs are less than the sample mean in all measured criteria. The overall score, which favors the general mean of the economic freedom index, shows that the BRICs have a score 25% lower than the average of the other coun-tries in the sample. This fact, in addition to creating difficulties for the investment flow, does not produce an environment that is conducive to entrepreneurship in the country.
Participation, which is shown in Table 1, and Freedom of Government, which is shown in Table 2, there is a great difference between the BRIC average and the rest of the sample.
REGRESSION RESULTS
The estimation strategy is based on a full regression model with several explanatory variables, and on a simple
Exhbit 3 – Expected signs of variables
DEPENDENT VARIABLE
INDEPENDENT VARIABLE INVESTMENT
RATE
FOREIGN DIRECT INVESTMENT
THEORETICAL BACKGROUND
Government Participation (-) (-) Dunning (1994) and Sara and Newhouse (1995)
Population Control
Variable (+)
There may be a positive relationship, since countries with large popula-tions tend to have cheap labor and a large consumer market, encoura-ging foreign investment.
Per Capita Product (+) (+) It is expected that countries with better macroeconomic scenarios present higher investment rates and higher foreign direct investment
Openess Level (+) (+) It is expected that countries with better macroeconomic scenarios present higher investment rates and higher foreign direct investment
Country Risk (-) (-) It is expected that countries with better macroeconomic scenarios present higher investment rates and higher foreign direct investment
Investment Rate (+) (+) It is expected that countries with better macroeconomic scenarios present higher investment rates and higher foreign direct investment
Inflation Rate (IPC) (-) (-) It is expected that countries with better macroeconomic scenarios present higher investment rates and higher foreign direct investment
Long Term Interest Rate (-) (-) It is expected that countries with better macroeconomic scenarios present higher investment rates and higher foreign direct investment
Per Capita Growth (+) (+) It is expected that countries with better macroeconomic scenarios present higher investment rates and higher foreign direct investment
Investment Price (-) (-) Bacha and Bonelli (2005)
Overallscore Freedom (+) (+) Sara and Newhouse (1995)
Days to open a business (-) (-) Fazzari et al. (1988), Whited (1992), Schaller (1993), and Faroque and Ton-That (1995)
Difficulty to hire (-) (-) Fazzari et al. (1988), Whited (1992), Schaller (1993), and Faroque and Ton-That (1995)
Costs to register a property (-) (-) Fazzari et al. (1988), Whited (1992), Schaller (1993), and Faroque and Ton-That (1995)
Time to enforce contracts (-) (-) Maher (1997)
Time to close a business (-) (-) Fazzari et al. (1988), Whited (1992), Schaller (1993), and Faroque and Ton-That (1995)
Costs of opening a business (-) (-) Fazzari et al. (1988), Whited (1992), Schaller (1993), and Faroque and Ton-That (1995)
regression model, whose explanatory variables are selected according to Schwarz criteria. Thus, 4 models will be estimated in all, of which two relate to equation (1), models (I) and (II) and two relate to equation (2), models (III and IV). For the purpose of analysis, the models chosen will be the simple models (II) and (IV), as these were selected based on an information criterion. Table 3 shows the tests that were performed to justify the choice of the estimated models.
The Breusch-Pagan test, in table 3, shows that none of the models can be estimated by simple OLS as the test rejected the null hypothesis of zero error variance for the component that does not change over time. The Hausman test suggests that models (II), (III) and (IV) should be estimated with a fixed effect control, since the random effect does not produce consistent results. The VIF statistic (variance inflation factor) shows that the estimation of the full models (I) and (II) increased, on average, the variance of each of the estimators of the explanatory variables compared to the same statistic obtained for the simple models (II) and (IV), indicating high collinearity between the independent variables. The models selected for
analysis – (II) and (IV) - must therefore be estimated using fixed effect OLS.
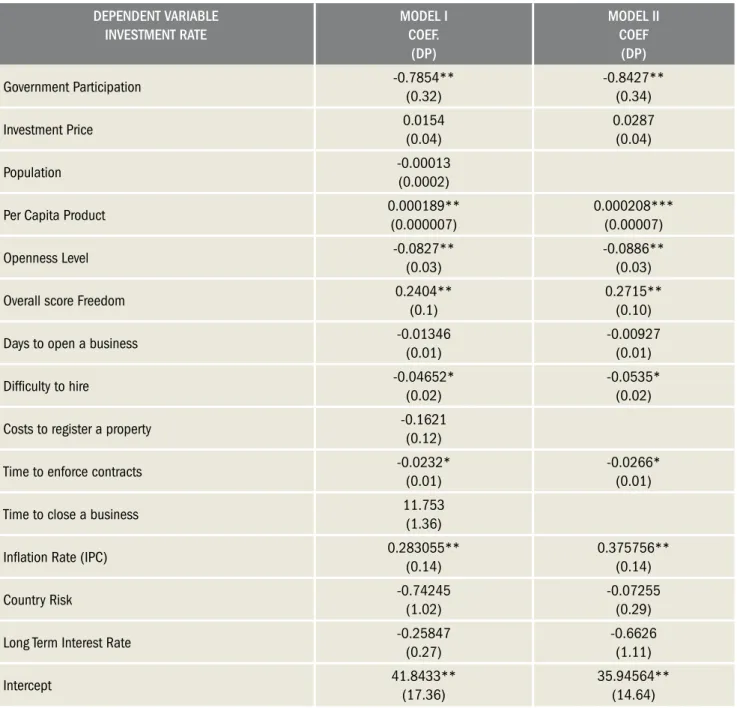
Table 4 shows the coefficients and their respective stan-dard deviations from the equation (1) estimation by OLS with fixed effect control. As mentioned above, Model (I) comprises a wide range of variables, whether significant or not. Model (II) was the most robust one based on the data. This model uses variables that were robust regard-less of the inclusion or exclusion of other variables, and it also uses variables that were not significant but that somehow contributed to better adjustment of the model, which was analyzed based on the Schwarz information criterion value.
According to the information in Table 4, it can be observed that macroeconomic variables and transaction costs variables affect an economy’s investment rate. By analyzing the coefficients that are results of model (II), it is possible to verify a significant negative relation between state participation in the economy and the in-vestment rate. Therefore, a 1% rise in State participation in the economy leads to an average fall in the economy’s investment rate of 0.78%, ceteris paribus. There is also a positive relation between per capita output and
Table 1 – Descriptive statistics of the macroeconomic variables
VARIABLE ENTIRE SAMPLE BRICS ONLY PIIGS ONLY
MEAN STANDARD
DEVIATION
MEAN STANDARD
DEVIATION
MEAN STANDARD
DEVIATION
FDI (US$ millions) 32127.55 49488.9 37517.25 35802.76 13718.27 21818.84
Investment Rate 29.14 6.68 22.34 7.18 34.04 2.36
Population 113269.2 278222.2 686387.7 542842.6 24755.79 21444.91
GDP per capita 27193.48 14254.41 8045.05 3492.35 29061.29 6853.35
Growth per capita 3.69 2.27 6.86 2.49 2.71 1.66
Openness Level 86.51 52.32 48.94 15.77 77.44 38.16
Investment Price 75.40 18.39 47.65 16.11 76.82 14.18
Government Participation 14.86 4.40 21.44 3.76 12.31 1.04
GDP / GNP 98.18 4.47 98.50 1.54 95.68 5.43
Inflation Rate (IPC) 3.00 2.21 5.91 3.15 2.69 0.51
Country Risk (The Economist) 1.87 0.72 3 0 2 0
Government Bond Interests 4.62 1.58 7.3 0.78 3.98 0.37
Long Term Interests 4.72 1.70 7.52 0.79 3.98 0.37
Short Term Interests 3.85 2.91 4.54 2.08 2.91 0.89
Observations 140 16 20
Table 2 – Descriptive statistics of variables regarding transaction costs
ENTIRE SAMPLE ENTIRE SAMPLE BRICS ONLY PIIGS ONLY
VARIABLE MEAN STANDARD
DEVIATION
MEAN STANDARD
DEVIATION
MEAN STANDARD
DEVIATION
Costs of closing a business 10.05 6.14 12.43 5.75 12.4 4.66
Years to close a business 2.422 2.353 6.175 3.52 1.38 0.64
Costs of enforcing a contract 19.53 8.12 20.15 11.76 20.52 6.76
Days to enforce a contract 424.772 191.8 328.60 233.15 485.469 273.66
Costs of registering a property 48.972 3.732 4.35 4.092 7.41 4.32
Days to register a property 42.72 48.2 45.375 12.34 38.6 23.27
Working hours rigidity (index) 31.28 19.74 38.25 14.93 38.8 22.34
Difficulty to hire (index) 28.07 22.68 29.81 26.34 43.2 22.64
Costs of opening a business 11.07 12.09 24.03 22.86 16.285 7.63
Days to open a business 31.02 30.26 76.18 48.55 41.05 32.28
Freedom of government 65.42 23.50 31.75 5.15 60.25 12.08
Freedom of property rights 72.42 19.59 39.37 11.23 68 14.36
Financial freedom 66.35 19.82 35 8.16 64.5 16.69
Investment freedom 66.21 16.42 40.62 9.97 70 12.97
Monetary freedom 82.07 6.68 74.61 6.84 82.13 2.63
Fiscal freedom 63.03 13.22 78.43 9.40 60.055 7.49
Freedom of commerce 77.64 10.35 56.06 15.08 81.75 2.33
Freedom of business 76.46 13.04 55.61 7.17 76.135 7.61
Overall score freedom 62.89 8.53 55.54 3.66 67.21 7.94
Observations 140 16 20
Source: Secondar y data of the Heritage Foundation.
Table 3 – Diagnostic tests
TESTS MODEL I MODEL II MODEL III MODEL IV
Breusch-Pagan (P-value) 0.000 0.000 0.000 0.000
Hausman (P-value) 0.118 0.002 0.085 0.000
Mean VIF Statistics 2.980 2.530 3.540 1.480
investment rate, which indicates that richer countries invest more, possibly because they have a high savings account rate. Thus, an increase in per capita income of US$ 1.00 generates an average rise in the investment rate of 0.0002%, ceteris paribus. Another important macroeconomic result is the negative relationship between the level of openness and the investment rate.
In relation to the variables that represent transaction costs, a negative relationship is observed between these costs and the economy’s investment rate. The general economic freedom index (overall score) presents a posi-tive relationship with the investment rate. Therefore, the greater a country’s economic freedom, the higher the average investment rate of its economy. Difficulty in hiring and the time required to enforce contracts are
also negatively related to the average investment rate of the economy.
Variables such as country risk, the long term interest rate, inflation rate and the number of days it takes to open a business were not statistically significant. The intercept represents the average fixed effect value. This happens because of the estimation method used by the Stata 9.0 econometrics package, which estimates the
Table 4 – Equation (I) estimation
DEPENDENT VARIABLE INVESTMENT RATE
MODEL I COEF.
(DP)
MODEL II COEF
(DP)
Government Participation -0.7854**
(0.32)
-0.8427** (0.34)
Investment Price 0.0154
(0.04)
0.0287 (0.04)
Population -0.00013
(0.0002)
Per Capita Product 0.000189**
(0.000007)
0.000208*** (0.00007)
Openness Level -0.0827**
(0.03)
-0.0886** (0.03)
Overall score Freedom 0.2404**
(0.1)
0.2715** (0.10)
Days to open a business -0.01346
(0.01)
-0.00927 (0.01)
Difficulty to hire -0.04652*
(0.02)
-0.0535* (0.02)
Costs to register a property -0.1621
(0.12)
Time to enforce contracts -0.0232*
(0.01)
-0.0266* (0.01)
Time to close a business 11.753
(1.36)
Inflation Rate (IPC) 0.283055**
(0.14)
0.375756** (0.14)
Country Risk -0.74245
(1.02)
-0.07255 (0.29)
Long Term Interest Rate -0.25847
(0.27)
-0.6626 (1.11)
Intercept 41.8433**
(17.36)
Table 5 – Equation (2) estimation
DEPENDENT VARIABLE FOREIGN DIRECT INVESTMENT
MODEL III COEF.
(DP)
MODEL IV COEF
(DP)
Population 13.5***
(3.4)
1.0** (0.5)
Per Capita Product 4.9***
(1.3)
5.1*** (0.7)
Exchange Rate 185.3
(141.9)
Government Participation 9075.0
(6672.2)
Investment Rate 743.3
(2013.0)
Investment Price 935.6
(977.6)
Openness Level -9.4
(693.8)
Per Capita Growth 477.3
(1877.7)
Overall score Freedom 512.3
(2012.8)
Days to open a business 81.9
(226.3)
Costs of opening a business -1147.2
(1082.5)
Difficulty to hire -343.8
(516.9)
Hours Rigidity 211.1
(634.8)
Inflation Rate (IPC) -896.1
(3719.7)
Country Risk -2497.2
(20483.0)
Long Term Interest Rate -2786.8
(6137.7)
Intercept -912261.0***
(296577.3)
-290681.0*** (66278.1)
Investment Freedom 1052.0***
(425.4) Note: *,**,*** represent 10%, 5% and 1% of significance, respectively.
intercept by restricting the average of the fixed effects to zero (a = 0).
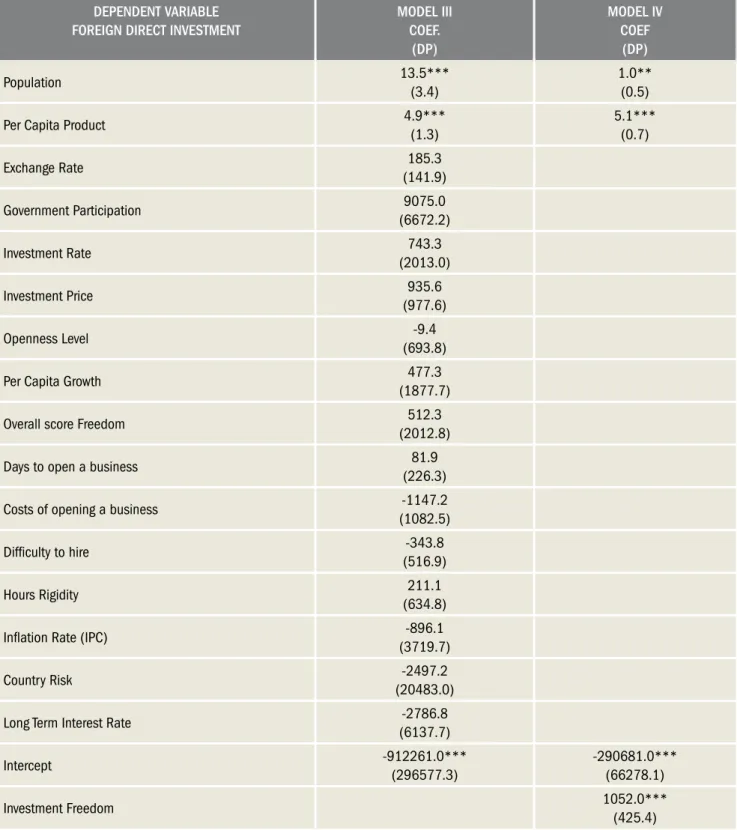
present-ed (model III) and then non-significant variables and variables that were not robust during the estima-tions are removed and a simpler model (model IV) is used and is selected based on a Schwarz information criterion.
The results displayed in Table 5 indicate that transac-tion costs have no significant impact on foreign direct investment, which contrasts with the findings of Sara and Newhouse (1995). Nevertheless, it can be verified that in both models III and IV the estimated coefficients for the population and per capita income are significant and positively related to foreign direct investment. Thus it can be observed that foreign investors make decisions to invest in other countries mainly by checking the size of the country’s domestic market, i.e. the per capita income level and the size of the population. As in the case of the estimations of models (I) and (II), here the intercept also represents the average of the fixed effects.
Only investment freedom seems to be related to foreign direct investment. To some extent this result is in accordance with Coase (1991), who shows that the issue of property rights – an essential variable for foreign investors – is only important in the case of significant transaction costs. Therefore, the result that transaction costs are not significant shows that this variable is not material enough to affect the view of the foreign inves-tor. So there is evidence that the transaction costs of the countries in the sample are not, on average, material enough to negatively impact the economy.
These results also corroborate those found by Macaulay (1985) and Williamson (1985), which have already been mentioned. According to these authors, investments in non-specific sectors of the economy are not governed by contracts and, therefore, do not generate transaction costs. Williamson (1985) attributes these results to the fact that the rationality of individuals is limited and the fact that the cost of monitoring and obtaining information is often very high. Therefore, they suggest that an investor does not have perfect information about other countries and transaction costs are therefore not determinants of direct foreign investment. On the other hand, the investment rate is related to domestic investment in a country, as can be verified in models I and II. As they are in their own country, investors have more access to information, so transaction costs are bound to have an impact on the country’s investment rate. Other works also found no evidence that transaction costs affect foreign investors, for instance Putterman (1996) and Richardson (1972).
CONCLUSIONS
The main purpose of this study was to verify whether transaction costs have any impact on investment and for-eign direct investment decision-making and to determine what the signs of this impact are. By using regressions with panel data for a sample of 35 countries over a 4-year period (2004-2007), the results suggest that transaction costs, as well as macroeconomic variables, affect the investment rate. Transaction costs, basically evaluated by economic rigidity indices, were significant and negatively related to the investment rate of the countries. On the other hand, when the dependent variable was foreign direct invest-ment, transaction costs did not seem to have any impact on the foreign investors’ decision-making. According to the estimated models, foreign investors seem to make decisions based exclusively on the size of the domestic market.
Such results concur with those of Williamson (1985), Macaulay (1985) and Coase (1991). According to these authors, transaction costs affect investment decisions negatively only if: transaction costs are high enough; there are no costs attached to obtaining information; or if the investments are not in a specific sector of the economy. Therefore, the results suggest that investors have almost perfect information in their own country and, consequently, the are lower costs of obtaining infor-mation in such a country than in obtaining inforinfor-mation regarding market rigidity and property rights in other countries.
Another conclusion of this study is that, when analyz-ing the available data, the BRICs on average have worse business environments than the other countries in the sample. This has interesting implications for cooperation between companies and entrepreneurs in this region, as entrepreneurs from the BRICs are able to confront trans-action costs. In order to evaluate the relative position of the BRICs in relation to business environments, African countries could also be included in this sample for further research. This would make it possible to carry out a more precise analysis of the role of the BRICs in several business environments.
REFERENCES
ARROW, K. J. The organization of economic activity: Issues pertinent to the choice of market versus non-market allocation. In The analysis and evaluation of public expenditures: The PBB-System, U.S. Joint Economic Committee, 91st Session, v. 1, Government Printing Office, Washington, D.C, 1969.
BACHA, E. L; BONELLI, R. Uma interpretação das causas da desaceleração econômica do Brasil (An interpretation of the causes of economic deceleration in Brazil). Revista de Economia Política, v. 25, n.3, p. 163-189, 2005.
BENJAMIN, C; PHIMISTER, E.Transaction costs, farm finance and investment. European Review of Agricultural Economics, v. 24, n. 3-4, p. 453-466, 1997.
BENMELECH, E; GARMAISE, M; MOSKOWITZ, T. Do liquidation values affect financial constraints? Evidence from commercial loan contracts and zoning regulation. Quarterly Journal of Economics, v. 120, p. 1121-1154, 2005.
COASE, R. H. The problem of social cost. Journal of Law and Economics, v. 3, n. 3, p. 1-44, 1960.
COASE, R. H. The institutional structure of production. Nobel Prize Lecture, Stockholm, 1991.
COOPER, R; SLAGMULDER, R. Inter-organizational cost management and relational context. Accounting Organizations and Society, v. 29, n.1, p. 1-26, 2004.
DUNNING, J. Re-evaluating the benefits of foreign direct investment. Transnational Corporations, v. 3, n. 1, 1994.
FAROQUE, A; TON-THAT, T. Financing constraints and firm heterogeneity in investment behaviour: An application of non-nested tests. Applied Economics, v. 27, n.3, p. 317-326, 1995.
FAZZARI, S. M; HUBBARD, R. G; PETERSEN, B. C. Financing constraints and corporate investment. Brookings Papers on Economic Activity, v. 1988, n. 1, p. 141–95, 1988.
FURUBOTN, E; RICHTER, R. Institutions and economic theory: The contribution of the new institutional economics. Ann Arbor: University of Michigan Press, 1997.
MACAULAY, S. Non-contractual relations in business: A preliminary study. American Sociological Review, v.28, n.1, 28, p. 55-67, 1963.
MACAULAY, S. An empirical view of contract. Wisconsin Law Review, v.
3, p. 465-482, 1985.
MACHER, J; RICHMAN, B. Transaction cost economics: An assessment of empirical research in the social sciences. Business and Politics, v. 10,
n. 1, 2008.
MAHER, M. Transaction cost economics and contractual relations. Cambridge Journal of Economics, v. 21, n.2, p. 147-170, 1997.
MANKIW, N. G. Small menu costs and large business cycles: A Macroeconomic model of monopoly. The Quarterly Journal of Economics,
v. 100, n. 2, p. 529-537, 1985.
MATTOS, L; CASSUCE, F; CAMPO, A. Determinantes dos investimentos
direto estrangeiros no Brasil, 1980-2004 (Determinants of foreign direct
investment in Brazil, 1980-2004). Revista de Economia Contemporânea, v. 11, n. 1, p. 39-60, 2007.
MURRAY, J. Y. Strategic alliance-based global sourcing strategy for competitive advantage. Journal of International Marketing, v. 9, n. 4, p.
30-58, 2001.
NORTH, D. C. Government and the cost of exchange. Journal of Economic History, v. 44, p. 255-64, 1984.
NORTH, D. C. Institutions, institutional change and economic performance. Cambridge: Cambridge University Press, 1990.
PUTTERMAN, L. The economic nature of the firm. Cambridge: Cambridge University Press, 1996.
RICHARDSON, G. B. The organization of industry. The Economic Journal,
v. 82, n. 327, p. 883-896, 1972.
RICHMAN, B. D. How communities create economic advantage: Jewish diamond merchants in New York. Law and Social Inquiry, v. 31, n. 2, p.
383-420, 2006.
RODRIK, D. The real exchange rate and economic growth. Brookings Papers on Economic Activity, v. 2, p. 365–412, 2008.
SARA, T. S; NEWHOUSE, B. Transaction costs and foreign direct investment in developing countries, International Advances in Economic Research, v. 1, n. 4, p. 317-325, 1995.
SCHALLER, H. Asymmetric information, liquidity constraints and Canadian investment. Canadian Journal of Economics, v. 26, n. 3, p. 552-574, 1993.
WALLIS, J. J; NORTH, D. C. Measuring the transaction sector in the American economy, 1870-1970. Chicago: University of Chicago Press, 1988.
WHITED, T. M. Debt, liquidity constraints, and corporate investment: evidence from panel data. Journal of Finance, v. 48, n. 4, p. 1425-1460,
1992.
WILLIAMSON, O. E. Transaction cost economics: The governance of contractual relations. Journal of Law and Economics, v. 22, p. 233-61, 1979.
WILLIAMSON, O. E. The economic institutions of capitalism. New York: