BAR, Rio de Janeiro, v. 9, n. 4, art. 4, pp. 441-453, Oct./Dec. 2012
Demand for Life Annuities: a Brazilian Perspective
Thalita Amorim Vaz * E-mail address: [email protected] Insper Instituto de Ensino e Pesquisa
São Paulo, SP, Brazil.
Sérgio Jurandyr Machado E-mail address: [email protected] Insper Instituto de Ensino e Pesquisa São Paulo, SP, Brazil.
Adriana Bruscato Bortoluzzo E-mail address: [email protected] Insper Instituto de Ensino e Pesquisa
São Paulo, SP, Brazil.
Abstract
Because pension plans have been marketed using outdated technical premises, Brazilian insurance companies find themselves required to identify additional resources to ensure their ability to meet future benefit payments obligations. When calculating the additional amount of this provision, the parameters used are: mortality and disability decrements, the structure of interest rates, financial performance, cancellation fees and conversion rates. The aim of this study is to present the estimation of conversion rates based on a Probit Model. The data for this study was obtained through the transfer of restricted data from the portfolio of a company with relevant activity in the Brazilian insurance market, including a group of 14,511 individuals eligible for retirement in the period between January 1, 2005 and December 31, 2009. The resulting analysis of the data allows us to conclude that two factors — the volume of accumulated reserves and the classification of prices as actuarially fair — increase the propensity of an individual to convert resources upon retirement. In turn, retirement age and the need for liquidity reduce the propensity to convert resources upon retirement.
Introduction
Since the advent of commercialized private complementary pension plans in Brazil between the 1970s and 1980s, pension institutions have been obliged to define a number of factors at the time of product approval. First, they must define the technical premises of the mortality table and the interest rate that will be used at the time of retirement to determine the benefit value or the income paid to the individual contingent upon survival of the participant. Second, they must define the value of the provision, to be shown on the insurer’s balance sheet as the present value of future obligations corresponding to the established benefit.
However, since mid-2010, it has become possible to approve products with dynamic tables, so that the definition of the mortality table used for benefit calculation occurs only on the participant’s retirement date. Prior to this, there would be no change to the guarantees for the benefits payment phase. In other words, the technical premises used for the original calculation of the benefit and the provision of benefits did not change from those defined when the contract was made years, sometimes even decades, before the date of retirement.
Failure to use premises that reflected real expectations of mortality, interest and conversion rates (the entrant may or may not convert the cumulative balance into income) at the time of retirement resulted in an inadequate calculation of benefits to be paid to the participant during their lifetime. This meant that the resources accumulated by the participant could end up being insufficient to secure future obligations towards benefit payments.
In 2002, the Superintendent of Private Insurance (SUSEP), the governmental regulatory body of the Brazilian insurance, annuity and open complementary pensions industry, created a new provision for the balance sheets of regulated companies. This provision would complement the calculated provisions of benefits both past and future, and thus assure sufficient funds for payment of contracted benefits.
The model for calculating the provision for insufficient contributions (PIC) allows for the use of various parameters, including conversion rate into income. The percentage that will be converted into income is not known in advance, because conversion is the prerogative of the participant; it is his or her decision whether to convert all, part or none of the benefit into income. Table 1 shows the influence of the conversion rate on the measurement of PIC.
Table 1
Conversion Rate Sensitivity (in R$ millions)
Accumulated Amount Conversion Rate Amount Covered PIC Factor Estimated PIC
3,000 3,000 3,000 3,000 3,000
100% 75% 50% 25% 0
3,000 2,250 1,500 0,750 0,000
25% 25% 25% 25% 25%
750.0 562.5 375.0 187.5 0.0
Note. Table 1 shows the PIC values for a theoretical portfolio with accumulated resources in retirement (accumulated amount) of R$3 billion for five assumed conversion rates (from 0% to 100%). The PIC factor represents the insufficiency of reserves as a percentage of the accumulated amount.
The paper is organized as follows: second section contains a review of the literature on the subject. Third section provides an explanation of the statistical techniques used to study the behavior of individuals and also discusses the data. An analysis of the results is presented in the fourth section and, finally, conclusions drawn from the study are discussed in the fifth section.
Literature Review
The literature on annuity conversions is extensive (Dus, Maurer, & Mitchell, 2005; Inkmann, Lopes, & Michaelides, 2011; Milevsky & Young, 2002; Purcal & Piggott, 2008; Yaari, 1965) and usually attempts to explain the reasons behind the low level of conversion observed worldwide in the field of open complementary pensions. Most of the papers try to understand such a puzzle, since
“numerous households would benefit by increasing the share of their retirement wealth that is
annuitized” (Benartzi, Previtero, & Thaler, 2011).
There are six main reasons described in the subject literature that try to explain this puzzle: the presence of a bequest motive, or the desire to leave an inheritance to descendants; the existence of a social security system that covers the minimum costs for the needs of older people; the irreversibility of the decision to convert; lack of liquidity; level of financial wealth; and the offer of annuities at actuarially unfair prices.
Yaari (1965) was one of the first authors to analyze conversion with a microeconomic model. In his study, the author concludes that the decision whether or not to convert accumulated savings into a lifetime annuity is affected by the desire to transfer wealth to descendants. A series of subsequent studies sought to measure this effect and results range from a strong influence (Bernheim, 1991; Purcal & Piggott, 2008), to a negligible influence (Horneff, Maurer, Mitchell, & Stamos, 2010; Melia & García, 2006).
Milevsky and Young (2002) introduced a real options utility to identify the factors that encourage investors to delay the annuitization of their accumulated wealth. The authors demonstrate that the real option value depends on the consumer’s private information, particularly their expectation of survival (based upon the condition and history of their health) and their degree of risk aversion. Milevsky and Young’s conclusion is that many of the results presented in previous studies on the benefits of annuitization disregarded the irreversibility of the decision and the possibility that the structure of interest rate terms could change significantly over time. The healthier and more risk-tolerant the individuals, the greater the value of the option of postponing conversion. In other words, delaying the annuitization can bring opportunities for financial gain and increasing wealth. Individuals with impaired health also tend to delay annuitization. This delay is probably because a portion of the accumulated wealth would never be realized; the insurer would retain it. Conversion, then, appears suitable only for those individuals with significant risk aversion and good health. In other words, the higher the risk aversion, the greater the desire to transform accumulated wealth into income.
In the same vein, Davidoff, Brown and Diamond (2005) show that the combination of a lack of liquidity of lifetime incomes and an incomplete annuity market gives rise to an optimal solution characterized by a partial conversion of savings.
Purcal and Piggott (2008) studied the reasons for the low demand for voluntary annuities in Japan and, as done in previous studies, modeled the problem using the theory of utility maximization for the individual throughout his life. Their main contribution to the literature on this subject was to demonstrate that the retirement pension granted by Japan’s social security (which absorbs most of the demand for annuities) and the high fees charged by the companies selling these products were very important factors on deciding whether or not to annuitize. These fees take into account not only longevity risk, but also anti-selection or adverse-selection risk (acquisition of income by individuals with an above-average likelihood of loss in greater proportion to individuals with a below-average likelihood of loss).
Finally, Inkmann, Lopes, and Michaelides (2011) report that financial wealth is one of the most important predictors of annuity market participation. That is because wealthier individuals can better afford and understand annuities. According to the authors “a unit increase in log financial wealth, which roughly corresponds to a 100% increase in financial wealth relative to the baseline, significantly
increases the annuity market participation probability for the whole sample by 2.3%” (p. 293). Moreover, in the presence of a social security system that guarantees a minimal level of income during retirement, households with little wealth tend not to annuitize and may want to have an emergency fund that is liquid (Benartzi et al., 2011).
Methodology
As the response variable analyzed in the problem has binary nature (to convert, versus not to convert), models from the limited dependent variable family were evaluated. From these models, Probit and Logit were selected. For the purposes of this paper, the Probit model is used to determine the propensity of an individual to convert into income, given a set of characteristics present at the time of retirement. The Logit model presents the marginal effects of the variables considered in the model.
According to Wooldridge (2006) and Heij, Boer, Franses, Kloek and Dijk (2004), Probit and Logit models have the following specification for the probability P:
| .
In the Probit model, G is the normal cumulative standard distribution function, expressed by the integral:
∫ ,
where is the normal standard density:
.
In the Logit model, G is the cumulative distribution function of a random logistical standard variable, expressed by:
.
The features present in the G function include the reasons for conversion presented in the literature review plus a year variable, identifying the point in time at which the decision to convert or not convert was taken. The year variable attempts to capture the aggregated temporal effects. Additionally, the G function includes a genre dummy variable, which seeks to identify if there is change in behavior because of gender.
Information available in the data is used as proxies for these variables, as follows:
1. Proxy for financial wealth: available balance on the date of retirement;
2. Proxy for irreversibility of decision: age at date of retirement;
3. Proxy for necessity to liquidate: plan term, defined as number of years between commencement date of the pension plan and the date of retirement;
4. Proxy for classification of prices: contractual technical premises.
Our tests do not control for bequest motive, since marital status and the number of children data is not available.
Therefore, the summarized specification of the Probit and Logit models adapted to the problem in question is:
) Male Premises
Reasonable Premises
Favorable
Term Plan Age
Exit s)
ln(Reserve (
/ 1
6 5
4
3 2
1 0
u G
x y P
where u is the error term.
Information available in the data is associated with regression variables as follows:
1. To be informative about annuitization, financial wealth should be measured before the decision to annuitize takes place. Assuming that the available balance upon retirement represents the level of wealth of the individual, it is expected that the coefficient of this variable has a positive sign, i.e., the higher the balance available at retirement, the higher the propensity of the individual to convert resources upon retirement;
2. Assuming that advancing age is indicative of a reduction in survival time and that this reduction is strongly linked to an increased intertemporal discount rate (the notion that spending today is more important than saving today and spending tomorrow), it is reasonable to assume that the higher the age of the individual, the greater the weight of the irreversibility of the decision to convert. Given this assumption, it is expected that the coefficient of this variable has a negative sign, i.e., the higher the age of the individual, the lower his/her propensity to convert resources upon retirement;
3. Assuming that the period of resource accumulation in the complementary pension plan represents the individual’s commitment to save and, consequently, to postpone consumption of those resources, it is feasible to assume that the longer the plan term, the less the individual’s need for liquidity. Given this assumption, it is expected that the coefficient of this variable will have a positive sign, i.e., the longer the plan term, the higher the individual’s propensity to convert resources upon retirement;
unfavorable plans. Because the unfavorable premise was used to define the base scenario, it is expected that the coefficients of these variables will have positive signs with the value of the coefficient of the favorable premises greater than the coefficient of the reasonable premises;
5. Considering that most pension plans marketed until 2007 were quoted based on the experience of male mortality, and given that life expectancy for females is greater than that of males, it is possible to assume that this advantage will motivate women to convert at a higher rate than men. Given this assumption and the fact that the base scenario was constructed with females, it is expected that the coefficient of this variable will have a negative sign, i.e., men are less prone to conversion than women.
Results
The data for this study was obtained through the transfer of restricted data from the portfolio of
a company with relevant activity in the Brazilian insurance market. The company’s name is withheld owing to a confidentiality agreement with the authors of this paper. For ethical and strategic reasons, the company provided only the minimum amount of information deemed necessary for this study.
Included in the information provided are the following: a group of 14,511 individuals eligible for retirement in the period between January 1, 2005 and December 31, 2009; the balance of the mathematical provision of benefits to be paid on the retirement date; retirement age; the term of each individual’s plan; the classification of the technical premises of the plan; the sex of the individual; the date of retirement and the individual’s decision whether to convert or not convert resources upon retirement. Additionally, the database was restricted to individuals with minimum accumulated reserves of R$3,500. The cutoff value was determined by observation of the available data to identify the lowest value of reserves converted upon retirement during the period analyzed.
Table 2 contains the analysis of the model’s main quantitative variables within the following groups: consolidated (converted and unconverted), converted (those who opted to convert resources upon retirement) and unconverted (individuals who opted not to convert resources upon retirement).
Analyzing the main descriptive measures of the two study groups, it can be observed that the average reserves of the group of individuals who converted resources upon retirement (R$268,901) is higher than the average reserves of the group of individuals who did not convert (R$87,837). Given the wide dispersion range of the variable reserves, it was necessary to make a monotonic transformation. Thus, the Probit and Logit model parameters were estimated using the natural logarithm of this variable.
The variable exit age is normally distributed, assuming 18 years minimum value, 99 years maximum, mean and median of 62 and 63 years, respectively, and standard deviation of 11.59 years. Even when segregated into converted and not converted groups, these figures do not differ greatly.
Table 2
Descriptive Analysis of Variables by Conversion Decision
Statistics Reserves (in R$) Exit Age (in years) Plan Term (in years)
Consolidated (n=14,511) Mean Median Standard deviation Minimum Maximum 96,172 17,255 567,865 3,500 35,025,094 63.31 62.00 11.59 18.00 99.00 4.49 4.00 3.97 0.00 25.00 Converted (n=668) Mean Median Standard deviation Minimum Maximum 268,901 83,440 519,940 3,545 6,047,627 60.85 60.00 10.35 18.00 95.00 4.17 4.00 4.41 0.00 24.00
Not Converted (n=13,843)
Mean Median Standard deviation Minimum Maximum 87,837 16,454 568,768 3,500 35,025,094 63.43 62.00 11.63 18.00 99.00 4.51 4.00 3.95 0.00 25.00
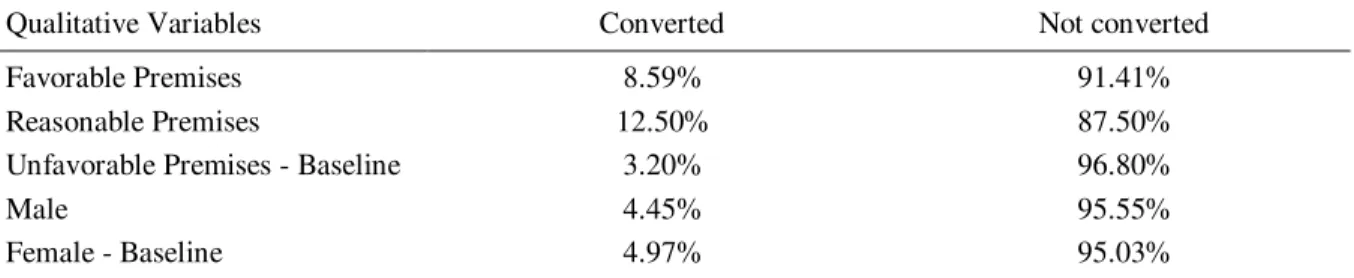
Table 3 shows the proportion of individuals who opted to convert resources upon retirement versus the proportion of individuals who opted to not convert these resources, presumably due to their personal characteristics or the characteristics of their plans. It can be seen that in all cases the percentage of individuals who chose not to convert resources is much higher than the percentage of individuals who opted for conversion, as has been observed and recorded in the literature.
Regarding plan features, it can be seen that the scenario with the unfavorable premises has the lowest conversion ratio (3.20%). This may be associated with the individuals’ perception that the plan has actuarially unfair prices. A higher conversion rate was expected for the favorable premises scenario than for the others, but in practice, there was a slightly higher level of conversion for the reasonable premises scenario (12.50%) than for the favorable (8.59%). It can also be observed that females had a conversion rate (4.97%), slightly higher than that of males (4.45%).
Table 3
Descriptive Analysis of Qualitative Variables Separated by Conversion Decision
Qualitative Variables Converted Not converted
Favorable Premises Reasonable Premises
Unfavorable Premises - Baseline Male
Female - Baseline
8.59% 12.50% 3.20% 4.45% 4.97% 91.41% 87.50% 96.80% 95.55% 95.03%
Table 4
Historical Conversion Rate for Qualitative Variables
Qualitative Variables 2005 2006 2007 2008 2009 Total
Favorable Premises Reasonable Premises
Unfavorable Premises - Baseline Male
Female - Baseline
16.63% 0.00% 0.70% 6.70% 3.88% 6.77% 8.57% 1.70% 2.33% 3.97% 5.96% 3.33% 6.64% 5.42% 8.81% 6.59% 14.58% 3.44% 4.00% 4.72% 5.03% 27.63% 2.87% 3.92% 3.69% 8.59% 12.50% 3.20% 4.45% 4.97%
Total 5.95% 2.87% 6.45% 4.21% 3.85% 4.60%
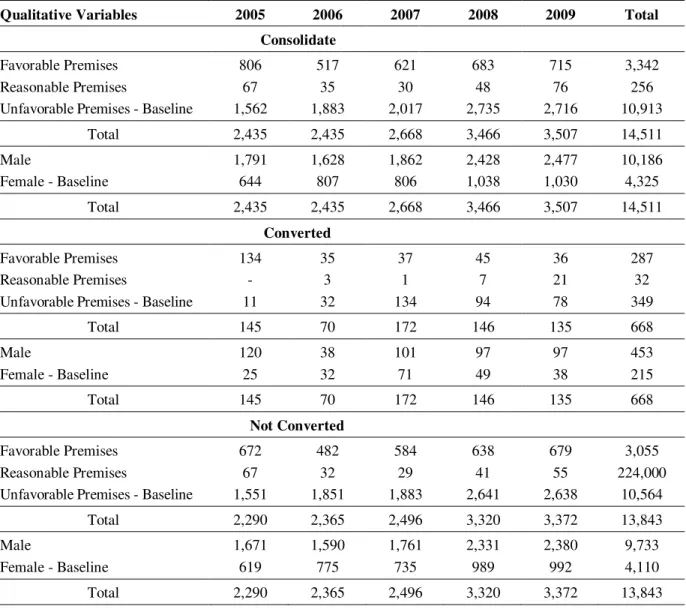
Table 5 shows data for the qualitative variables of the model by year of eligibility and decision to convert. It is possible to observe some variability in the number of individuals eligible for retirement each year. This variability becomes greater in the converted group, which shows a minimum quantity of 70 individuals opting to convert in 2006 and a maximum quantity of 172 individuals opting to convert in 2007.
Table 5
Distribution of Data by Year and by Qualitative Variable of the Model
Qualitative Variables 2005 2006 2007 2008 2009 Total
Consolidate Favorable Premises
Reasonable Premises
Unfavorable Premises - Baseline
806 67 1,562 517 35 1,883 621 30 2,017 683 48 2,735 715 76 2,716 3,342 256 10,913
Total 2,435 2,435 2,668 3,466 3,507 14,511
Male
Female - Baseline
1,791 644 1,628 807 1,862 806 2,428 1,038 2,477 1,030 10,186 4,325
Total 2,435 2,435 2,668 3,466 3,507 14,511
Converted Favorable Premises
Reasonable Premises
Unfavorable Premises - Baseline
134 - 11 35 3 32 37 1 134 45 7 94 36 21 78 287 32 349
Total 145 70 172 146 135 668
Male
Female - Baseline
120 25 38 32 101 71 97 49 97 38 453 215
Total 145 70 172 146 135 668
Not Converted Favorable Premises
Reasonable Premises
Unfavorable Premises - Baseline
672 67 1,551 482 32 1,851 584 29 1,883 638 41 2,641 679 55 2,638 3,055 224,000 10,564
Total 2,290 2,365 2,496 3,320 3,372 13,843
Male
Female - Baseline
Before fitting the Probit model, the correlations between the explanatory variables were analyzed to avoid multicollinearity, leading to a possible inconsistency of the estimated coefficients for the model. The explanatory variables ln (reserves), age at the date of retirement and plan term presented weak correlations in pairs, with the highest correlation between age at the date of retirement and term plan(equal to -0.1966); thus there is no multicollinearity in the specified model.
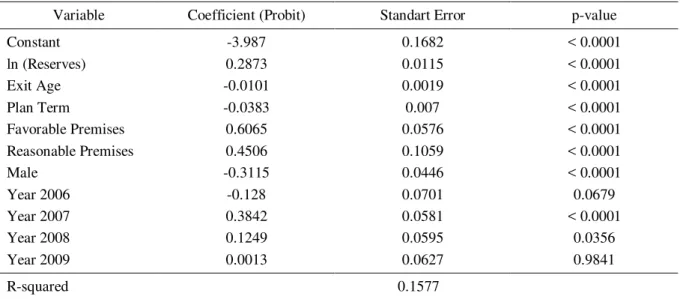
Table 6 shows the estimated parameters for the Probit model. Robust standard errors by Huber & White method was used to correct heteroscedasticity. All the explanatory variables were statistically relevant at 5%. Variables indicating the years of the study (dummy variables) were used in the model only to control a possible temporal effect, since the data were collected from 2005 to 2009. The use of these control variables is important to prevent the explanatory variables to capture some temporal effect related to macroeconomic changes over the period.
The positive sign of the coefficient of the variable ln (Reserves) indicates that the higher the value of reserves the greater the propensity of the individual to convert resources. This finding is in line with the expected result for this variable.
Table 6
Probit Model Results
Variable Coefficient (Probit) Standart Error p-value
Constant ln (Reserves) Exit Age Plan Term
Favorable Premises Reasonable Premises Male
Year 2006 Year 2007 Year 2008 Year 2009
-3.987 0.2873 -0.0101 -0.0383 0.6065 0.4506 -0.3115
-0.128 0.3842 0.1249 0.0013
0.1682 0.0115 0.0019 0.007 0.0576 0.1059 0.0446 0.0701 0.0581 0.0595 0.0627
< 0.0001 < 0.0001 < 0.0001 < 0.0001 < 0.0001 < 0.0001 < 0.0001 0.0679 < 0.0001
0.0356 0.9841
R-squared 0.1577
Note. The baseline scenario for these variables is: unfair prices (unfavorable technical premises), female and year of retirement in 2005.
The negative sign for the coefficient of the exit age variable conforms to the expected result and indicates that the greater the age of the individual, the lower their propensity to convert resources upon retirement. This decision may be justified by the greater proximity to death and, consequently, by a desire to spend more today rather than save to spend tomorrow.
The negative sign for the coefficient of the variable representing plan term indicates that the longer the plan term, the lower the propensity of the individual to convert resources upon retirement. This result also contradicts the expected result. It is possible that this divergence is a reflection of the
individual’s changing need for liquidity during retirement as compared with his/her employment period. However, this hypothesis needs confirmation through further empirical studies.
Because the baseline scenario was constructed with women, with a negative sign for the coefficient representing men, it is possible to infer that males have a lower propensity to convert resources upon retirement than females. The result found is consistent with the expected result. Females are offered an opportunity by cheaper pricing that does not accurately reflect their life expectancy.
All the dummy years except 2009 are statistically relevant (with a significance level of 10%), in other words it may be deduced that dummy years capture the economic effect associated with macroeconomic changes over the period.
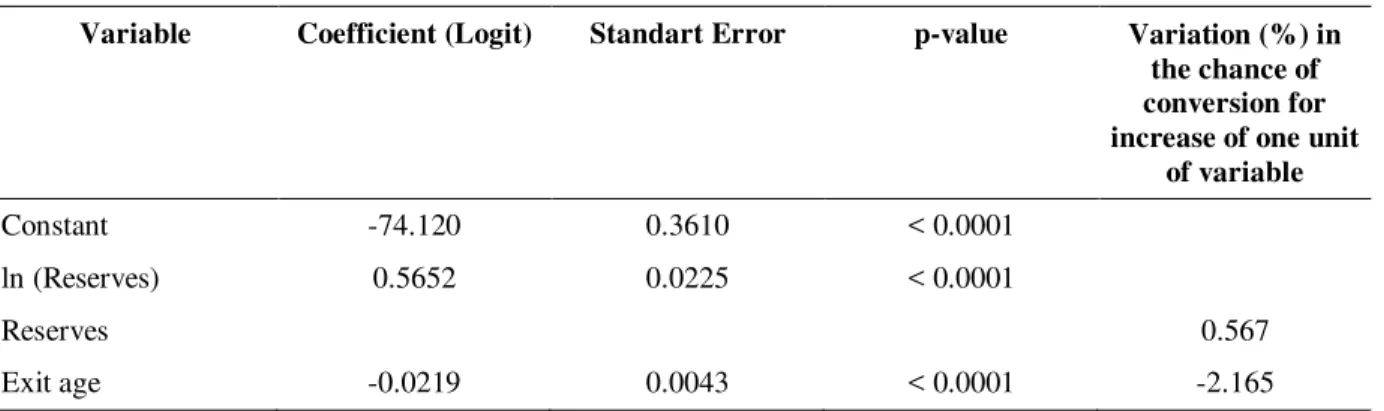
Table 7 shows the estimated parameters for the Logit model. An advantage of this model, compared to Probit, is the possibility of estimating marginal effects, based on the results. According to Hair, Anderson, Tatham and Black (1998), the marginal effect is calculated based on the following expression: exponential of the Logit model coefficient minus 1 and multiplied by 100, which represents the percentage change in the chance of conversion for increase of one unit of the variable. If the explanatory variable uses the logarithmic transformation, the marginal effect is itself the estimated coefficient.
Thus, using the results of Table 7:
1. An increase of 1% in reserves, ceteris paribus, increases the chance of conversion of resources into income by 0.57%;
2. An increase of one year in the exit age of the individual, ceteris paribus, reduces the chance of conversion of resources into income by 2.16%;
3. An increase of one year in the term of an individual's plan, ceteris paribus, reduces the chance of conversion of resources into income by 8.63%;
4. The individual’s access to a plan quoted with favorable premises compared to a plan with unfavorable premises, ceteris paribus, increases the chance of converting resources into income by 295%.
5. The individual’s access to a plan quoted with reasonable premises as compared to a plan with unfavorable premises, ceteris paribus, increases the chance of conversion of resources into income by 177%.
6. The fact that an individual is male as compared to female, ceteris paribus, reduces the chance of converting resources into income by 50.76%.
Table 7
Logit Model Results
Variable Coefficient (Logit) Standart Error p-value Variation (%) in the chance of conversion for increase of one unit
of variable
Constant -74.120 0.3610 < 0.0001
ln (Reserves) 0.5652 0.0225 < 0.0001
Reserves 0.567
Exit age -0.0219 0.0043 < 0.0001 -2.165
Table 7 (continued)
Variable Coefficient (Logit) Standart Error p-value Variation (%) in the chance of conversion for increase of one unit
of variable
Plan Term -0.0903 0.0146 < 0.0001 -8.632
Favorable Premises 1,374 0.1147 < 0.0001 295.190
Reasonable Premises 1,019 0.1998 < 0.0001 176.992
Male Sex -0.7085 0.0951 < 0.0001 -50,762
Year 2006 -0.2853 0.1522 0.0608 -24,821
Year 2007 0.6896 0.1195 < 0.0001 99,292
Year 2008 0.2323 0.1236 0.0601 26.155
Year 2009 -0.0229 0.1315 0.8619 -2.260
R-squared 0.158451
Note. The baseline scenario for these variables is: unfair prices (unfavorable technical premises), female and year of retirement in 2005.
Conclusion
For decades, the Brazilian insurance market has sold complementary pension plans with outdated technical premises. Insurers have had to make available sufficient additional resources to cover eventual deficits, guaranteeing to participants and to the regulatory body that they are creditworthy and can meet their obligations towards payment of benefits.
Allocating the resources needed to meet this provision is the responsibility of insurers, so that participants and beneficiaries are fully guarded against any imbalance generated by the way these plans were marketed. It is, therefore, vital to estimate the inputs of the model used to calculate this provision as accurately as possible.
Analyzing the influence of the characteristics for each individual in the database indicates that both the volume of accumulated reserves and the classification of prices as actuarially fair increase the propensity of individuals to convert resources upon retirement. In turn, the retirement age and the need for liquidity reduce the propensity to convert resources. Additionally, the study revealed that men tend to have a lower conversion rate than women.
The above results are of great importance to insurers because they clearly demonstrate the marginal impact of statistically significant explanatory variables. The model shown can be reproduced relatively easily and enhanced with other defining characteristics to help identify the individuals with a high propensity to convert resources upon retirement. This flexibility makes it an even more important tool for the process of calculating the eventual deficit associated with a benefit plan.
Received 18 November 2011; received in revised form 20 June 2012.
References
Benartzi, S., Previtero, A., & Thaler, R. H. (2011). Annuitization puzzles. Journal of Economic Perspectives, 25(4), 143-164. doi: 10.1257/jep.25.4.143
Bernheim, D. (1991). How strong are bequest motives? Evidence based on estimates of the demand for life insurance and annuities. The Journal of Political Economy, 99(5), 899-927. doi: 10.1086/604735
Davidoff, T., Brown, J. R., & Diamond, P. A. (2005). Annuities and individual welfare. The American Economic Review, 95(5), 1573-1590. doi: 10.1257/000282805775014281
Dus, I., Maurer, R., & Mitchell, O. (2005). Betting on death and capital markets in retirement: a shortfall risk analysis of life annuities versus phased withdrawal plans. Financial Services Review, 14(3), 169-196.
Hair, J. F., Jr., Anderson, R. E., Tatham, R. L., & Black, W. C. (1998). Multivariate data analysis.
New Jersey: Prentice Hall.
Heij, C., Boer, P. de, Franses, P. H., Kloek, T., & Dijk, H. K. van (2004). Econometric methods with applications in business and economics. Oxford: Oxford University Press.
Horneff, W. J., Maurer, R. H., Mitchell, O. S., & Stamos, M. Z. (2010). Variable payout annuities and dynamic portfolio choice in retirement. Journal of Pension Economics and Finance, 9(2), 163-183. doi: 10.1017
Inkmann, J., Lopes, P., & Michaelides, A. (2011). How deep is the annuity market participation puzzle? The Review of Financial Studies, 24(1), 279-319. doi: 10.1093
Melia, C. V., & García, A. L. (2006). Demand for life annuities from married couples with a bequest motive. Journal of Pension Economics and Finance, 5(2), 197-229. doi: http://dx.doi.org/10.1017/S1474747205002349
Milevsky, M., & Young, V. (2002). Optimal asset allocation and the real option to delay annuitization:
it’s not now-or-never [Working Paper 2002B]. Individual Finance and Insurance Decisions Centre, Toronto. Retrieved from http://www.ifid.ca/pdf_workingpapers/WP2002B.pdf
Purcal, S., & Piggott, J. (2008). Explaining low annuity demand: an optimal portfolio application to Japan. The Journal of Risk and Insurance, 75(2), 493-516. doi: 10.1111/j.1539-6975.2008.00269.x
Wooldridge, J. (2006). Introductory econometrics: a modern approach. Mason: Thomson - South-Western.