© FECAP
RBGN
Review of Business Management
DOI: 10.7819/rbgn.v19i65.2742
453
Received on 01/27/2016 Approved on 02/10/2017
Responsible editor:
Prof. Dr. Ivam Ricardo Peleias
Evaluation process: Double Blind Review
Analysis of the effects of conservatism in
accounting information after the 2011 change
in the basic conceptual pronouncement
Clóvis Antônio Kronbauer
University of Vale do Rio dos Sinos, Postgraduate Program in Accounting Sciences, São Leopoldo, Brazil
Luiz Henrique Figueira Marquezan
Federal University of Santa Maria, Accounting Sciences Department, Santa Maria, Brazil
Marco Aurélio Gomes Barbosa
Federal University of Rio Grande, Institute of Economic, Administrative and Accounting Sciences, Rio Grande, Brazil
Carlos Alberto Diehl
University of Vale do Rio dos Sinos, Postgraduate Program in Accounting Sciences, São Leopoldo, Brazil
Abstract
Purpose – his study researches whether the change in NBC TG, promoted in 2011, that excluded Prudence (Conservatism), had any efect on companies’ accounting information.
Design/methodology/approach – Quantitative approach, using a linear regression based on the Basu (1997) method, Wilcoxon tests and t test, on a sample with 109 companies, listed on the BM&FBovespa, from 2008 to 2013.
Findings – The results indicate that conservatism is present in accounting for the entire period, and changes do not occur in this feature of the accounting information as of 2011.
Originality/value – his research reinforces the perception of the superiority of economic interest, in particular for possible tax gains, to the detriment of accounting information quality, be it of regulatory origin or another.
1
Introduction
On December 2, 2011, the Accounting Pronouncements Committee (CPC) published the approval term of the Basic Conceptual Pronouncement (R1), conirmed by the Federal Accounting Council (CFC) by the Brazilian Accounting Standard (NBC TG), with changes applicable to the conceptual framework for the preparation and dissemination of accounting and inancial reports. One of the amendments is the withdrawal of the characteristic prudence, or conservatism, from the condition of reliable representation, being it inconsistent with neutrality, as it promotes asset undervaluation and liability overvaluation (CPC, 2011).
he concept of conservatism is that proit should not be anticipated, but should anticipate the acknowledgement of all losses (Watts, 2003a). he dynamics of identiication of the accounting information, presented in the seminal study of Basu (1997), veriies the relection of good and bad news and its efect in the results. In the evolution of accounting concepts, although normative, regulation reveals the inluence of conservatism (Crawford, Rountree & Price, 2010), providing new evidence and opportunities for studies (Watts, 2003b).
In Brazil, the change related to conservatism pronounced by the CPC may have influence on the companies’ practices and, consequently, possible efects on asset and liability items, mainly in equity from the impact on proits. his argument, which is the basis for this study, is founded on the opportunism of managers and the ensuing associated risks (Hendriksen, 1982), arising from inconsistencies, arbitrariness, cover-ups and contradictions (Kan, 1990) in accounting disclosure. he efects on the accounting information in the absence of prudence can raise the levels of assets, net income and equity, and reduce liabilities, relecting the interpretation of analysts of inancial statements. herefore, it is necessary to identify whether the companies altered their accounting practices from 2011 onwards.
his study seeks to evaluate whether the change in accounting conceptual framework, re m ov i n g t h e i n f o r m a t i o n’s p r u d e n c e (conservatism) characteristic, resulted in efects on the financial statements issued by public companies listed on the BM&FBovespa. his study follows up on the work of Santos et al. (2011) that aims to evaluate the efects of Law 11.638/07 on the conservatism of companies. From the change of perception on conservatism, it is necessary, or at least interesting, to obtain a new veriication that may promote the comparability between diferent time scenarios.
his study has this initial section, with a review on conservatism literature, from its origin to the international and national previous studies, presenting data and results. Ending the study, the inal considerations and references.
2
heoretical reference
2.1
Conservatism in accounting theory
and norms
The perception of conservatism in accounting dates back to ancient periods in the history of society, regarding its accounting organization. he irst veriications occurred in the medieval period with the validation of the property owner’s accounts by auditing as “faithful and prudent”. Subsequently, they happened in Italy, with the valuation of assets, mainly inventories, with a lower cost or market value. hey were inserted into accounting textbooks in the 17th century, and were hereafter required by
the commercial code in France in 1673, Prussia, 1794 and Germany, 1884. Conservatism can be considered one of the oldest good auditing practices (Basu, 2009).
such a decline was caused by conservative assessment, allowing for adjustment only in cases of original value decline. his allowed other occasional adjustments in asset value, generating signiicant changes when considering future losses in advance.
He n d r i k s e n ( 1 9 8 2 ) b e l i e ve s t h e uncertainties represent the basis for a concept of conservatism in traditional accounting. Although it is not an accounting principle, conservatism focuses on its operating medium, which serves as a restriction on the data. he term conservatism requires accounting professionals to report the lowest possible values for the assets and income, and the greatest possible values for liabilities and expenses, in the same way that the costs and losses must be recognized earlier than revenues and earnings.
At the heart of this practice lays the thought that pessimism is assumed to be better than optimism in inancial information. Hendriksen (1982) presents three arguments for the existence of conservatism: (i) the tendency for pessimism is assumed to be necessary to counterbalance the natural optimism of managers and owners; (ii) the overstatement of proits and ratings are more dangerous for business; (iii) accounting professionals have access to much more information that can be communicated to investors and creditors, and these professionals assume two types of risk: the information passed on can be considered false later, or the information not passed on is true in the future.
he discussion of accounting conservatism reveals some of the features previously described, but also promotes the argumentation for some criticism. Kan (1990) presents six critical conservatism features: (i) inconsistency – may promote inconsistencies in the measurement of proit; (ii) arbitrariness – political interests can motivate a greater or lesser degree of conservatism, adjusting adequately to speciic interests; (iii) cover-ups – there is no way to determine how conservative accounting is, and it places the investor at a disadvantage; (iv) contradiction with
accounting principles, for example, regarding the timeliness of information; (v) bias – promotes a systematic bias in the accounting information damaging a realistic assessment; (vi) state of mind – conservatism is strongly present in the professional culture in their attitudes, more than in the uncertainties.
Kan (1990) in contrast to criticism establishes relevant arguments for the defense of conservatism. One of the arguments relates the relevance to dampen the efects of optimism; the second argument concerns the relevance of conservatism for the conformity of statement analysis, as it becomes a rational pathway for reducing information risks. For creditors, the relevance of conservatism is in the disclosure of pertinent information in the identiication of adverse consequences.
In Brazil, Iudícibus (2009) points out two diferent approaches. In the irst, considered nobler, conservatism should be understood as a vocational element of the profession, working in the discipline of enthusiasm; the other causes distortions that are based on the principle earlier presented of the cost ratio or market, whichever is lower. Additionally, Iudícibus (2009, p. 64) states that “the great problem of illogical and extreme application of conservatism is that there is a natural tendency among professionals to consider it as the freedom to always present users with the information or variant that presents the lowest proit or the highest liability.” he author also emphasizes that the combined application of conservatism and objectivity can diminish relevance if misunderstood. hus, the preferred critical test for the adoption of a standard should be relevance.
income are not overvalued and the liabilities or expenses are not underestimated.
In Brazil, the CFC determined prudence, a synonym of conservatism, as a qualitative characteristic of reliability. However, motivated by the considerations of the International Accounting Standards Board (IASB) and some theoretical studies such as Hendriksen (1982) and Kan (1990), the Brazilian Accounting Standard of Conceptual Framework (NBC TG) revoked this condition as it realized a direct conlict with what recommends the characteristic of neutrality (CFC, 2011).
2 . 2
Preliminary studies related to
conservatism
In the academic ield, one of the most cited papers in conservatism is Basu (1997), in which the author seeks to identify how the results relect bad news (losses) more quickly than good news (earnings) in the accounting result. Based on a quantitative contribution, the study presents the following results: (i) through the actions of the companies it was veriied that the sensitivity to negative news presents a ratio of two to six times the return of positive news; (ii) changes in negative gains are less persistent than the response to positive gains; (iii) Earnings Response Coeicients (ERCs) are greater for positive changes than for negative outcomes, generating asymmetric persistence.
he study by Santos, Lima, Freitas and Lima (2011) carried out an empirical-analytical research, with data collected in Economatica®, with the non-inancial companies listed on the BM&FBovespa during the period from the irst quarter of 2005 to the third quarter of 2009 to investigate whether the enactment of Law 11.638/07 changed the degree of the sample’s conditional accounting conservatism. For this veriication, the authors used an adaptation of the model proposed by Basu (1997). After the data analysis, it was not possible to infer if the new rules have had some efect on the degree of asymmetric recognition of gains and losses.
The study by Hamdan, Abzakh and Al-Ataibi (2011) aims to assess the role of the public sector in the regulation of Accounting Standards in Kuwait to examine their ability to require the companies listed on the Kuwait Stock Exchange (KSE) to provide a reasonable level of conservatism accounting in preparing the inancial statements. It analyses the factors that afect the level of accounting conservatism in companies referring to size, debt contracts, and the type of sector to which they belong, concluding that the companies with lower inancial volume in their statements tend to present greater conservatism than the others.
Following the study by Santos et al. (2011) it is possible to identify other recent international and national studies. here are the international works produced by Xie, Zheng and Amy Lau (2012) that investigated the incentives in conservatism’s tunneling accounting reports in the context of assets and equity and provided empirical evidence that accounting conservatism can be reported for opportunistic reasons rather than eiciency reasons; Kazemi, Hemmati and Faridvand (2011) investigated and conirmed by a quantitative analysis the relationship between earnings and conservative accounting, including persistence, predictability, relevance, value and opportunity; Dai and Ngo (2013) documented the positive association between political uncertainty and accounting conservatism; Asgari and Behpouri (2013) studied the efect of taxes on accounting conservatism in companies listed on the Tehran Stock Exchange, and concluded that there is a signiicant positive relationship between accounting conservatism and the tax burden applied to organizations; Ouyang and Wan (2014) studied the understanding of market analysts on accounting conservatism, concluding that short-term earnings forecasts of shareholders have conservatism similar to the net income presented, demonstrating further that as the forecast horizon increases the efects, the conservatism become weaker.
and Paulo (2013) verified the influence of several characteristics of auditing quality on the quality of accounting information, measured by conservatism, noting that the conservatism of accounting information is positively afected by the size of the auditing irm, and negatively afected by the time of auditors’ service provision, the distance between the date of the opinion and the inancial statements publication date; Brito, Lopes and Coelho (2013) investigated the presence of conditional conservatism in profits reported by financial institutions in Brazil, and examined whether this feature is diferent in state-owned banks and private banks, concluding it not to be possible to identify the presence of conservatism in profits reported by Brazilian banks, but identifying that state-owned institutions anticipate the recognition of unrealized losses.
3
Methodology construction and
analysis of conservatism presence
he research was developed considering two directions: a) investigation of the presence of conservatism and change in corporate behavior through the Basu model (1997); b) analyses of the changes in the accounting indicators of current liquidity and indebtedness, in which it is expected to increase the former and reduce the latter. he methodological procedures and results of each test are presented in this topic.
3 . 1
A n a l y s i s o f t h e p re s e n c e o f
conservatism by Basu’s model (1997)
he research seeks to identify elements to evaluate changes in the behavior of companies regarding the accounting conceptual framework that removed the conservative forecast as characteristic of accounting information. According to Basu (1997:11), in the presence of conservatism the slope coeicient of a “regression of annual gains on annual unexpected returns is greater for negative returns than for positive unexpected returns”. hus, with the change in the conceptual framework, such behavior tends to
change the slope of the regression, with a negative sign, bringing closer the efects of the positive and negative unexpected returns:
H1: In the presence of conservatism the slope coeicient of a regression of annual earnings on unexpected annual returns are higher for the negative unexpected returns than for positive unexpected returns in the period prior to the change of accounting conceptual framework, cancelled this efect in the period.
The econometric model developed by Basu (1997) is described as follows:
X
it/P
it-1=
α
0+
α
1DR
it+
β
0R
it+
β
1R
itDR
it(1)
Where:
Xit is the company’s earnings per share i in the year t;
Pit-1 is the share price at the beginning of the period;
Rit is the company’s return i in the year t, calculated as follows: Pit – Pit-1/(Pit-1);
DRit is a dummy variable that assumes value 1 when Rit < 0 and 0 in other situations.
In the presence of conservatism, the coefficient β1 is expected to be positive and α1 negative, both statistically significant. As this research proposes to analyze the diference between the pre and post-change periods in the accounting standard, tests were carried out with the inclusion of a dummy variable, which assumes 1 for the years after the change in the accounting framework that removes conservatism as a characteristic of the accounting information, and 0 for previous years. he model can be thus expressed:
X
it/P
it-1=
α
0+
α
1DR
it+
β
0R
it+
β
1R
itDR
it+
α
2DT
it+
α
3DT
itDR
it+
β
2DT
itR
it+β
3DT
itR
itDR
it(2)
for years 2011 to 2013 and 0 for years prior to the change of the conceptual framework. By it is analyzed whether the efects of conservatism were stronger before the change in NBC TG. hus, conservative behavior is expected to be reversed in relation to the initial period, with α3 positive and β3 negative, indicating a reduction in the time of recognition of negative factors, namely eliminating the efect of conservatism
he earnings per share, as well as the returns and prices of the common shares of the companies listed on the BM&FBovespa, were used not to diferentiate oscillations in the companies for the traded share classes. Economatica® obtained the
data for periods from 2008 to 2013, from 438 companies listed on BM&FBovespa, on April 5, 2014. Of these, 355 presented data in the period, but 116 had data in all variables in each of the 6 periods analyzed. hus, i=116 and t=6, with total n =696 observations.
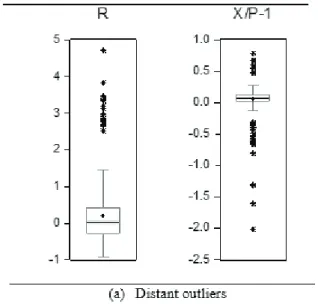
For regression analysis, atypical observations considered as distant outliers were suppressed by the graphic method (boxplot). For the dependent variable, the observation interval was greater than -0.3 and less than 0.42. In the variable R the observations below 2.5 were maintained. Figure 1 illustrates the range of distant outliers in each variable.
Figure 1. Sample Outliers.
Due to the nature of the data dispersion, both have a large number of abnormal observations. he decision to exclude only distant outliers from the range and maintain the number of observations to perform the analysis was based
Table 1
Descriptive statistics n=654
n:654 Mean Median Maximum Minimum Standard
Deviation Asymmetry Kurtosis
Jarque-Bera Prob. JB
X/P-1 0.074 0.072 0.411 -0.280 0.105 -0.073 4.541 65.303 0.000 R 0.128 0.019 2.484 -0.914 0.609 1.185 4.820 243.247 0.000 2008 a 2010; n:319
X/P-1 0.096 0.085 0.411 -0.266 0.107 0.099 4.011 14.109 0.001 R 0.216 0.125 2.388 -0.914 0.757 0.779 3.108 32.443 0.000
2011 a 2013; n:335
X/P-1 0.052 0.060 0.409 -0.280 0.099 -0.386 5.052 67.078 0.000 R 0.045 -0.017 2.484 -0.898 0.406 1.479 7.825 447.156 0.000
The overall sample showed different average returns for recovery of the stock price (R) and proitability of shares (X/P-1), with averages of 12.8% and 7.4%, respectively. his diference is higher from 2008 to 2010 and inverted from 2011 to 2013, in which the return for the accounting proit was greater than the stock price’s appreciation return. Even with a higher average, X/P-1 presented a negative median, indicating that most of the observations presented negative returns, following the reduction of earnings per share, aligned behavior between accounting and capital market performance.
However, when analyzing such behavior, the data indicated a reduction in the relationship between the market performance and the
companies’ accounting result in 2011. In the correlation between the variables, the complete sample presented a significant and positive relationship r=0.4088 (t=11.436; p<0.001), higher in the first period, r=0.449 (t=8.937; p<0.001), dropping after 2011, r=0.323 (t=6.238; p<0.001).
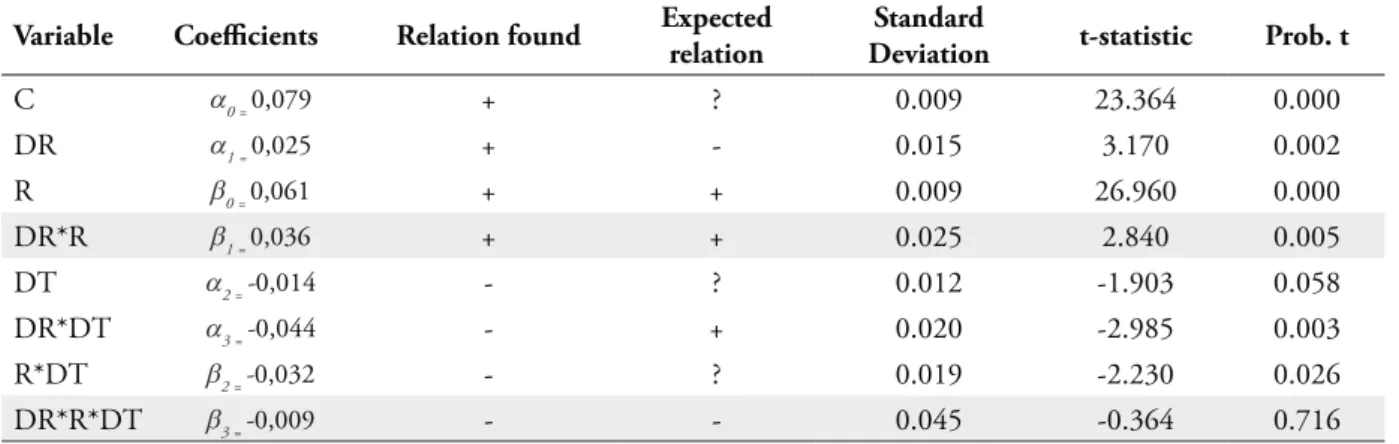
Table 2 presents the regression results of the model, with ixed efects in the data panel, using White’s consistent matrix. Hausman’s test presented a Chi-square=28.847 value, signiicant at 0.1%, rejecting the null hypothesis of no signiicant diference between the ixed efects model estimators of the error component model. hus, the use of ixed efects in panel data is appropriate to the model.
Table 2
Linear regression – data panel with ixed efects – Dependent variable X/Pt-1
Variable Coeicients Relation found Expected relation
Standard
Deviation t-statistic Prob. t
C α0 = 0,079 + ? 0.009 23.364 0.000
DR α1 = 0,025 + - 0.015 3.170 0.002
R β0 = 0,061 + + 0.009 26.960 0.000
DR*R β1 = 0,036 + + 0.025 2.840 0.005
DT α2 = -0,014 - ? 0.012 -1.903 0.058
DR*DT α3 = -0,044 - + 0.020 -2.985 0.003
R*DT β2 = -0,032 - ? 0.019 -2.230 0.026
he Durbin-Watson statistic presented Chi-square value=1.90, falling into the zone of non-rejection of the null hypothesis of absence of autocorrelation. he Breusch-Pagan-Godfrey test for heteroscedasticity showed Chi-square=25.55, not higher than the critical value of Chi-square=67.33, not rejecting the null hypothesis of homoscedasticity. Table 2 shows that test f and values of test t of the constant of the other variables, except for DR*R*DT, were signiicant. he coeicient of determination (adjusted R2) indicates that 56.51% of the total variance of proitability by accounting proit per share (X/ Pt-1) is explained by the analyzed model.
Contrary to expectations, the distribution of residues is considered non-normal by the Jarque-Bera test. However, based on the nature of the data (X/Pt-1 variable data distribution), the general analysis of the model and the tests of the linear regression assumptions, the coeicients found are the real estimators of the equation, even if they cannot be considered the best non-biased estimators (Gujarati, 2006); therefore, the statistical test was maintained. hus, we do not make statistical inferences and test hypotheses about the sample data; rather, we use the analysis about the estimation of the Basu model (1997).
he R relation with X/Pt-1 was positive and signiicant, indicating that the stock price return is related to the return of net income shares. The coefficients that determine the behavior of companies in the face of conservatism were partially identiied. α1 showed a signiicant and positive relationship indicating that negative efects are absorbed at diferent level of positive effects, although a negative relationship was expected. β1 was positive and significant, demonstrating that variations in net income are faster in the presence of negative efects when facing positive efects. hus, the sample data demonstrate the presence of conservatism in accounting proit by faster absorption of negative efects than of positive efects.
The period from 2008 to 2010 is distinguished by the adoption of IFRS
(International Financial Reports Standards) accounting standards. As identiied by Alves and Martinez (2014) and Sousa, Sousa and Demonier (2016), the adherence to this standard did not alter the efect of conservatism in companies when compared to previous periods. Additional testing segregating the effect for post-full adherence years, 2010-2013, did not alter the meaning and statistical signiicance of the previously seen regressors and did not reveal results statistically signiicant.
As for the alteration made in the accounting conceptual framework, analyzed by the coefficients α3 and β3, no evidence was identiied pointing to changes in the accounting information of the characteristics of the sample companies. Hence, even β3 presenting the expected negative relation is not statistically signiicant, not conirming changes in the levels of conservatism of the companies analyzed after changes in NBC TG. herefore, additional tests were performed and discussed in the next section.
3.2
Conservative analysis by the behavior
of accounting indicators
Additional tests were completed on two accounting indicators that suggest modiications in the companies’ behavior regarding the change in the accounting framework. he analysis had abnormal changes for the years 2011, the irst year in which the adoption of the new conceptual framework was forecasted, and 2012, due to possible adjustments not performed in the irst year. Hence, the efect of conservatism withdrawal was analyzed by the following behaviors:
a) Current liquidity: the absence of conservatism can result in abnormal increases in this indicator in 2011 and 2012, when compared to other periods. his can be a result, for example, of the postponement of losses on receivables, inventory maintenance items with low level of sales in the face of equally valid options.
compared to other years. Changes in the level of indebtedness may be the result of choices about provisions for losses with future payments of lower value, as well as post-ixed rates of inancing at lower levels.
Data was collected from Economatica® basis for the periods 2008-2013, having as starting point the companies listed on the BM&FBovespa on April 5, 2014, for 438 companies. he inal number of companies and observations and the results of the statistical tests are presented, as follows.
Current Liquidity
The current liquidity indicator (LCit) represents the company’s ability to pay in the short term, considering elements of current asset (ACit) and current liabilities (PCit) of company i at time t. It may be expressed as follows:
(3)
In the absence of conservatism, assets are expected to be overvalued and liabilities are
undervalued. hus, the behavior of the indicator would increase abnormally in relation to periods in which conservatism determines the accounting information.
H2: With the withdrawal of conservatism from the accounting framework, the average levels of the companies’ current liquidity reveal abnormal increases in the irst few years.
Descriptive statistics, the correlation of companies’ liquidity in diferent years, and the Wilcoxon test were analyzed to evaluate the signiicance of the median diferences. Among the 438 listed companies, 353 presented current liquidity data from 2008 to 2013. For analysis, the cases with no information in at least one of the periods and the exclusion of inancial companies reduced the sample to 271 companies. As outliers (i=126) we considered the observations, for each year, of the values in the irst and last percentile. At the end, we used data (i) from 145 companies in (t) 6 years (n=870).
Table 3
Descriptive statistics
LC2008 LC2009 LC2010 LC2011 LC2012 LC2013
Mean 1.544 1.558 1.586 1.520 1.495 1.552
Median 1.351 1.361 1.445 1.379 1.353 1.336
Maximum 4.505 4.502 4.333 4.030 4.058 4.265
Minimum 0.438 0.431 0.431 0.353 0.369 0.219
Standard Deviation 0.814 0.840 0.792 0.748 0.755 0.851
Jarque-Bera 1.544 1.558 1.586 1.520 1.495 1.552
Prob. JB 1.351 1.361 1.445 1.379 1.353 1.336
By organizing the data of each period as a diferent variable, it was possible to analyze the descriptive statistics and the correlation between the liquidity indexes in each year. It is possible to observe certain regularity in the behavior of the mean, with reduction in the years 2011 and 2012, after the change of the conceptual framework. However, in 2013, the level was similar as in the
Table 4
Spearman’s correlation analysis – Current liquidity
n=177 LC2008 LC2009 LC2010 LC2011 LC2012
LC2009 0.780*
LC2010 0.643* 0.730*
LC2011 0.688* 0.714* 0.752*
LC2012 0.583* 0.602* 0.683* 0.738*
LC2013 0.541* 0.601* 0.670* 0.680* 0.782*
Note. *p-value<0.01%
As expected, all data presented in Table 4 have high correlation value, especially in immediately related years; all are signiicant at 0.1%. However, there is no change in behavior over the period, when analyzed in 2011 and 2012. hus, the correlation between the periods, by the current liquidity variable, does not present evidence of changes in the behavior of the
companies after the change in the conceptual accounting framework.
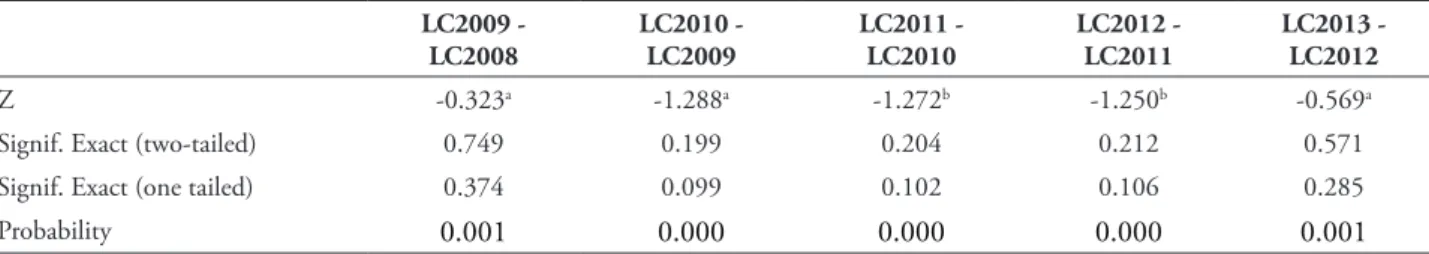
Data were also submitted to the Wilcoxon test, as evidence of changes is sought in company behavior comparing data from diferent periods in paired samples. he results are shown in Tables 5 and 6.
Table 5
Wilcoxon’s test results – Current liquidity
Periods Ranks N (total = 177) Mean Sum
LC2009 - LC2008 Negative posts 73a 70.26 5,129
Positive posts 72b 75.78 5,456
Relations 0c
LC2010 - LC2009 Negative posts 66d 70.30 4,640
Positive posts 79e 75.25 5,945
Relations 0f
LC2011 - LC2010 Negative posts 75g 79.16 5,937
Positive posts 70h 66.40 4,648
Relations 0i
LC2012 - LC2011 Negative posts 83j 71.40 5,926
Positive posts 62k 75.15 4,659
Relations 0l
LC2013 - LC2012 Negative posts 70m 71.49 5,004
Positive posts 75n 74.41 5,581
Relations 0o
Table 6 Statisticc tests
LC2009 - LC2008
LC2010 - LC2009
LC2011 - LC2010
LC2012 - LC2011
LC2013 - LC2012
Z -0.323a -1.288a -1.272b -1.250b -0.569a
Signif. Exact (two-tailed) 0.749 0.199 0.204 0.212 0.571
Signif. Exact (one tailed) 0.374 0.099 0.102 0.106 0.285
Probability 0.001 0.000 0.000 0.000 0.001
Note. a. Based on negative posts; b. Based on positive posts; c. Signs of the Wilcoxon Test Stations
he Wilcoxon test has as null hypothesis the equality in the behavior of the sample variables. he data indicates that there are no elements to reject this hypothesis; there was no change in the liquidity behavior that could indicate a statistically signiicant increase or decrease. hus, H2 in this research is not conirmed, as it is not possible to reject the null hypothesis, equal in the behavior of liquidity in the years following the change of the conceptual framework. his result corroborates with the previous test, and does not identify a change in accounting practices capable of eliminating the efect of conservatism in accounting.
Indebtedness
The indebtedness indicator (Endit) represents the total debt level of the companies in relation to their total liabilities, composed of the liabilities ((PExit) and the shareholders’ equity (PLit) of company i at time t, as follows:
(4)
In the absence of conservatism, it is expected that elements of the Liabilities will be undervalued, whereas the Shareholders’
Equity has overvalued elements, such as retained earnings. hus, the behavior of the indicator would be an abnormal reduction in relation to periods in which conservatism is the determinant of the accounting information.
H3: With the withdrawal of conservatism from accounting’s conceptual framework, the average levels of companies’ indebtedness have abnormal reductions in the early years.
Table 7
Descriptive statistics
End2008 End2009 End2010 End2011 End2012 End2013
Mean 26.758 25.691 25.233 26.636 27.584 28.337
Median 26.581 24.765 24.008 25.948 27.060 27.604
Maximum 55.610 51.318 43.178 48.169 51.271 54.040
Minimum 4.587 7.785 6.847 9.101 9.439 9.247
Standard Deviation 11.401 9.714 9.463 9.313 9.779 10.467
Jarque-Bera 26.758 25.691 25.233 26.636 27.584 28.337
Prob. JB 26.581 24.765 24.008 25.948 27.060 27.604
he mean’s behavior indicates a rise in indebtedness from 2011, contrary to expectations. Moreover, it is another indication of the absence of changes in the behavior of companies referring to conservatism. he correlation analysis is expected
to become weaker for the years 2010-2011 and/or 2011-2012, in the event of accounting information changes, because of the absence of the conservatism characteristic.
Table 8
Spearman’s correlation analysis – Indebtedness
n=109 End2008 End2009 End2010 End2011 End2012
End2009 0.774*
End2010 0.677* 0.746*
End2011 0.465* 0.542* 0.785*
End2012 0.323* 0.405* 0.655* 0.865*
End2013 0.171** 0.261* 0.360* 0.595* 0.676*
Note. *p-valor<0.01%; ** p-valor<0.1%
As expected, the indebtedness of period t is highly correlated to period t-1, signiicant at 0.01%. However, the behavior of the variables over time revealed no change in the result of correlation analysis, as shown in Table 6. hus, there was no change in the correlation coeicient
that promotes alteration in the indicator’s behavior. he indebtedness data of all the periods presented normal distribution by the Jarque-Bera test, so that the indebtedness behavior was analyzed by Test t (Table 9).
Table 9
Test results paired t - Indebtedness – gl=103
Pair Mean t-1 Mean t Diference
between means t Sig. (two-tailed)
Pair 1 End2008 - End2009 26.758 25.691 1.067 1.495 0.138 Pair 2 End2009 - End2010 25.691 25.233 0.458 0.683 0.496
Pair 3 End2010 - End2011 25.233 26.636 -1.403 -2.325 0.022
Pair 4 End2011 - End2012 26.636 27.584 -0.948 -1.942 0.055
he results presented by Test t show that the luctuations in the behavior of the indebtedness are statistically signiicant with the increase of their levels in the years following the alteration of the conceptual framework. For 2010-2011, the ratio is signiicant at 5% and 2011-2012 at 10%. hus, we reject the null hypothesis that the debt behavior is the same compared in both years when pairs 3 and 4 are analyzed. hus, contrary to the expectations of this research, the debt was not afected by the absence of conservatism, but by factors unrelated to the object of this research. In both periods, there was an increase in this indicator while expectations fell to its reduction; there is no indication of changes in accounting practices.
4
Review
In the irst part of the result analysis, section 3.1, tests with data from 109 companies indicated the presence of conservatism in the sample from 2008 to 2013, confirming the expectation. Additionally, the effects of positive and negative returns were expected to be statistically the same for the years following the change in accounting pronouncement, indicative of the annulment of the impacts of conservatism. However, the data did not conirm changes in company behavior as of 2011, showing that the accounting information continued to relect the efects of conservatism. Additional analyzes of changes in the behavior of accounting indicators (liquidity and indebtedness), over which are assumed alterations in the absence of conservatism, showed results that conirm the absence of changes in the behavior of companies as of 2011.
Referring to the Santos et al. (2011) work, a diference in the indings may be observed. While no conservative effects were found in quarterly data, the findings identified here revealed conservatism throughout the period, based on annual data. Both have periods of 2008 and 2009 in common and such diferences may be the result of quarterly intervals from the
study by Santos et al. (2011). In addition to the diference between the total periods analyzed, the time between the news and the relection in the accounting data released quarterly or annually, as well as changes recommended by auditing on the partial (quarterly) and inal (annual) inancial statements may have caused such a diference.
Regarding the presence of conservatism from 2011, these findings may be the result of behaviors similar to other samples. From 2008, compared to the international crisis, these companies may have chosen to maintain the level of conservatism on higher levels of economic uncertainty. Particularly, Dai and Ngo (2013) identiied political uncertainty with the presence of conservatism.
However, the presence of conservatism in the accounting information of the sample contradict the study of Santos et al. (2011). his variation can be explained by the diference in the analysis periods of the studies, having in common only the years 2008 and 2009. Variations in the sample concerning the exclusion of financial companies in Santos, Lima, Freitas and Lima (2011) and the absence of the search for the moderating efects of the variable indicative of the quarterly efects (DT) on the DR and R variables in the 2011 study.
Furthermore, in the companies operating in Brazil, the tax burden may be responsible for a higher level of conservatism, acting as a form of tax planning. Lower levels of proit, resulting from the application of prudence, would incur in a lower tax burden. This association was identiied in Asgari and Behpouri (2013) related to the Iranian stock exchange, and may be an explanatory factor for the absence of change in the companies’ behavior.
5
Conclusion
his research investigated whether the Brazilian Accounting Standard that regulates the conceptual framework for the preparation and disclosure of the accounting and inancial report (NBC TG), altered in 2011, which excludes Prudence or Conservatism from the qualitative characteristics of accounting, caused efects on accounting information of companies listed on BM&FBovespa. herefore, companies’ data from 2008, collected from the Economatica® database, were analyzed through three research hypotheses.
Initially, analyzing the Basu model (1997), Hypothesis 1, on the presence of conservatism was partially conirmed, and there was no evidence capable of conirming the change in behavior in the accounting information with the withdrawal of conservatism as a characteristic of the accounting information. For Hypotheses 2 and 3, the change in the behavior of the accounting indicators of liquidity and indebtedness, respectively, was analyzed. With the withdrawal of conservatism, an increase in liquidity and reduction in indebtedness was expected at abnormal levels for years 2011 and/or 2012 in relation to the other periods. he tests did not present elements capable of conirming such hypotheses, corroborating with Hypothesis 1, that there was no inluence of the change in the Brazilian accounting framework in company information.
Thus, the expected alteration from the change in the accounting framework, aiming to promote neutrality as quality of accounting information through the withdrawal of conservatism, was not conirmed. herefore, because of the indings of this research, analyzes on the inancial statements should not assume neutrality in the information disclosed, since both before and after the withdrawal of prudence as a qualitative aspect of accounting information the standards remain the same, tending to a possible consolidated bias in market practices.
he study serves as an alert for market analysts, stockbrokers, companies, market regulators, indicating a possible formalization practiced by the companies.
In addition, these findings have implications for the analysis of Brazilian accounting standards, such as CPC and CFC, regarding the adoption of the required accounting practices and their efects on company information. For the literature, it reinforces the perception of the superiority of the economic interest, especially for possible tax gains, to the detriment of the quality of the accounting information, whether it is normative regulation efect or of another origin. hus, it aligns itself to the studies on the efects of normative changes without mechanisms that guarantee their fulillment.
However, the reasons why companies maintain this behavior referring to their inancial information were not analyzed, resulting in an opportunity for research, through surveys or case studies to identify them. We also suggest studies that seek to identify the efects of maintaining conservatism on the perceptions of financial analysts and/or other market regulators, as well as identifying the practices of accountants regarding them.
References
Alves, J. de S., & Martinez, A. L. (2014). Efeitos da adoção das IFRS no conservadorismo contábil nas sociedades de grande porte. Advances in Scientiic and Applied Accounting, 7(2), 224-243.
Asgari, M., & Behpouri, M. (2013). Investigating the effect of tax costs on accounting conservatism: evidence from Tehran Stock Exchange. Management Science Letters, 4, 5-10.
Journal of Accounting and Economics, 24, 3-17.
Basu, S. (2009). Conservatism research: historical development and future prospects. China Journal of Accounting Research, 2 (1), 1-20.
Brito, G. A. S., Lopes, A. B., & Coelho, A. C. D. (2012, October-December). Conservadorismo dos lucros contábeis dos bancos no Brasil: a inluência do controle estatal. Revista Universo Contábil, 8(4), 19-39. Blumenau.
CFC – Conselho Federal de Contabilidade (2011). Resolução CFC N.o 1.374/11. Brasília.
CPC – Comitê de Pronunciamentos Contábeis (2011, dezembro). Pronunciamento conceitual básico (R1): estrutura conceitual para elaboração e divulgação de relatório contábil-inanceiro.
Crawdford, S. S., Rountree, B, & Price, R. (2010, October). Regulation and accounting conservatism. Jones Graduate School of Business. Rice University. Disponível em http://www.kellogg.northwestern.edu/ accounting/papers/rountree.pdf. Acesso em 04 abril de 2014.
Dai, L., & Ngo, P. (2013). Political uncertainty and accounting conservatism: evidence from the U.S. presidential election cycle. Munich Personal RePec Archive, n. 43796.
FASB – Financial Accounting Standards Board (2008). Statement of inancial accounting concepts no. 2 – qualitative characteristics of accounting information.
Hamdan, A. M, Abzakh, M. H., & Al-Ataibi, M. H. (2011). Factors inluencing the level of accounting conservatism in the inancial statements. International Business Research, 4(3).
Hendriksen, E. (1982). Accounting theory (4th edition). Irwin: Illinois.
IASB – International Accounting Standards Board (2005). Conceptual framework qualitative characteristics 1: relevance and reliability. London.
Iudícibus, S. (2009). Teoria da contabilidade (9ª edição). São Paulo: Atlas.
Kan, V. (1990). Accounting heory (2th edition). John Wiley & Sons: New York.
Kazemi, H., Hemmati, H., & Faridvand, R. (2011). Investigating the relationship between conservatism accounting and earnings attributes. World Applied Sciences Journal, 9(12), 1385-1396.
Mattessich, R. (1964, October). Accounting and analytical methods. Richard D. Irwin, Inc.: Illinois.
Ouyang, B., Wan, H. (2014). Do analysts understand conservatism? Accounting and Finance Research, 3(1).
Paulo, I. I. S. L. de M., Cavalcante, P. R. N., & Paulo, E. (2013, July-September). Relação entre qualidade da auditoria e conservadorismo contábil nas empresas brasileiras. Revista de Educação e Pesquisa em Contabilidade, 7(3), 305-327. Brasília.
Santos, L. P. G., Lima, G. A. S. F. de, Freitas, S. C. de, & Lima, I. S. (2011, May-August). Efeito da lei 11.638/07 sobre o conservadorismo condicional das empresas listadas BM&FBOVESPA. Revista de Contabilidade & Finanças, 56(22), 174-188.
Watts, R. L. (2003a, September). Conservatism in accounting – part I: explanations and implications. Accounting Horizons, 3(17), 207-221.
Watts, R. L. (2003b, December). Conservatism in accounting – part II: evidence and research
opportunities. Accounting Horizons, 4(17), 287-301.
Xie, Y., Zheng, L., & Amy Lau, H.L. (2012) Reporting incentives for accounting conservatism, evidence from asset and equity tunneling. Paciic Accounting Review, 24(2), 38-160.
About the authors:
1. Clóvis Antônio Kronbauer, PhD in Accounting and Auditing, University of Seville, Spain. E-mail: [email protected].
2. Luiz Henrique Figueira Marquezan, PhD in Accounting Sciences, University of Vale do Rio dos Sinos, Brazil. E-mail: [email protected].
3. Marco Aurélio Gomer Barbosa, Master in Accounting Sciences, University of Vale do Rio dos Sinos, Brazil. E-mail: [email protected].
4. Carlos Alberto Diehl, PhD in Production Engineering, Federal University of Santa Catarina, Brazil. E-mail: [email protected].
Contribution of each author:
Contribution Clóvis Antônio Kronbauer
Luiz Henrique Figueira Marquezan
Marco Aurélio Gomer Barbosa
Carlos Alberto Diehl
1. Deinition of research problem √ √ √ √
2. Development of hypotheses or research questions
(empirical studies) √ √ √ √
3. Development of theoretical propositions (theoretical Work)
4. heoretical foundation/Literature review √ √ √
5. Deinition of methodological procedures √ √
6. Data collection √
7. Statistical analysis √
8. Analysis and interpretation of data √ √ √ √
9. Critical revision of the manuscript √ √ √ √