Scientific Infrastructure and Catching-Up Process: Notes
about a Relationship Illustrated by Science and Technology
Statistics
*Eduardo da Motta e Albuquerque**
Summary: 1. Introduction; 2. The role of science in the catching-up process; 3. Anedoctal evidence from country studies: Korea and Taiwan; 4. Five stylized facts about the catching up of Korea and Taiwan; 5. Comparing the scientific specialization of catching-up and immature systems of innovation; 6. Concluding remarks.
Key words: Scientific infrastructure; catching-up process; patent statistics; development; national systems of innovation; East Asia; Latin America.
JEL codes: O30; O14.
The beginning of the catching-up process has a precondition: a cer-tain level of internal scientific development. This paper’s hypothe-sis suggests that, given the scarce resources for scientific activities, these countries might concentrate their scientific development in key disciplines, specially those that are sources for their industrial devel-opment. This paper surveys the literature and presents data about the role of science during the catching-up process. The literature’s findings and conjectures are evaluated in the light of patent and sci-entific publication statistics.
Este artigo discute a contribui¸c˜ao da infra-estrutura cient´ıfica para processos decatching-up. A hip´otese do artigo sugere que os pa´ıses que realizam processos decatching-up devem simultaneamente am-pliar a sua infra-estrutura cient´ıfica e concentrar seu desenvolvi-mento cient´ıfico em disciplinas chaves, especialmente naquelas que s˜ao fontes de desenvolvimento industrial. O artigo resenha a liter-atura e apresenta dados sobre o papel da ciˆencia durante o processo decatching-up, tomando como referˆencia os casos da Cor´eia e Taiwan.
*This paper was received in Mar. 2000 and approved in Oct. 2000. A preliminary version of this paper presentend at theLatin American and Caribbean Economic Association(LACEA)
Meeting1999, Santiago (Chile)(session “R&D, knowledge and growth”). Research assistance from M´arcia Rapini, Regina Fernandes e Ana Paula Verona is acknowledged. This paper has benefited from the helpful comments of an anonymous referee. The usual disclaimer applies.
**Cedeplar/UFMG.
1. Introduction
This paper investigates the relationship between science and technology in catching-up countries. It analyses two sets of data:
a) patent statistics, using patents granted by the United States Patent and Trademark Office (USPTO) as a proxy for the world patenting activities (SPRU patent database);
b) scientific papers statistics, using the database organized by the Institute for Scientific Information (ISI).
The sample includes 17 countries, organized to cover different stages of development, or different types of national systems of innovation (Freeman, 1995).
The comparison between the output of selected countries in terms of scien-tific publication statistics (a proxy of their scienscien-tific capability) and of patent statistics (a proxy of their industrial and technological capabilities) provides useful and new information. These statistics contribute to differentiate major features of catching-up countriesvis-`a-viscountries in other stages of develop-ment. Therefore, this paper may complement studies that focused in patents (Choung, 1995) or in scientific papers (Lattimore & Revesz, 1996). The stud-ies from Klevorick et alii (1995) and from Pavitt (1998) provide major clues for the establishment of the relationship between science and technology.
The beginning of the catching-up process has a precondition: a certain level of internal scientific development. This paper’s hypothesis suggests that, given the scarce resources for scientific activities, catching-up countries might concentrate their scientific development in key disciplines, especially in sci-entific fields that are sources for their industrial development, and that have high impact upon industrial firms. Therefore, the distribution of scientific ac-tivities before and during the catching-up process might be more concentrated than in other stages of development.
compares Korea, Taiwan, and countries with immature national systems of innovation (Brazil, India, and Mexico). Finally, Section 6 concludes the paper.
2. The Role of Science for the Catching-Up Process
There is an extensive literature discussing the complex and multifarious in-terplay between science and technology (Rosenberg, 1976; Pavitt, 1991; Free-man, 1995; Klevorick et alii, 1995; Dasgupta & David, 1994; Narin et alii, 1997). Nelson and Rosenberg (1993) summarize this relationship, stressing the role of science both as “follower and leader” (and indicate the growing weight of science for modern economic growth).
Surveying this literature, at least five major contributions of science to technologic innovation in developed (OECD) countries can be pinpointed:
a) source of technological opportunities;
b) source of trained researchers;
c) development of improved research techniques;
d) development of instruments;
e) source of tacit and public knowledge.
Narin et alii (1997) describe how the American industry (especially in high tech sectors such as electronics and biotechnology) has increasingly dependent links with public science.
To understand the specificity of the scientific infrastructure for less-developed countries, a tentative typology of national systems of innovation (Albuquerque, 1999) is useful. The starting point for this tentative “typology” is a dividing line between developed and non-developed countries: “catching-up” national systems of innovation (NSIs). Catching-up NSIs constitute a “transitional” category. Therefore, three broad sets of NSIs could be sug-gested:
a) “catching-up” NSIs, as a dividing line (Korea, Taiwan);
b) ahead of “catching-up”, the ”mature” NSIs (USA, Japan, Germany, Swe-den etc.);
c) behind of “catching-up”, the “non-mature” NSIs (Brazil, India, Argentina, South Africa, Russia etc.).1
Regarding the non-developed countries, there are important differences in the role of science. The main difference rests on the contribution of science to the catching-up process. It acts as a “focusing device” in this process. Science at the periphery is important to function as an antenna for the cre-ation of links with interncre-ational sources of technology. In a catching-up and in a “non-mature” NSI, scientific infrastructure provides “knowledge to fo-cus search” (Nelson, 1982). Instead of being a direct source of technological opportunity, as in “mature” NSIs, at the periphery science helps to identify the opportunities generated abroad. In other words, the main role of science in the periphery is to put the NSI in the international scientific and tech-nological flows. The emergence of a “knowledge-based” economy (in more interconnected world) increases the importance of such contribution to the creation of “absorptive capability” (key to the catching-up process).
Other important contributions of science to technology in developed coun-tries are minimized in the peripheral context. First, the development of re-search techniques could be substituted by foreign university training. Second, the development of instruments could be substituted by capital goods imports. Third, trained researchers for certain areas could be supplied by sending stu-dents to foreign graduate programs.
The literature highlights other specific contributions of science at periph-ery: taking part of local technological accumulation (Bell & Pavitt, 1993); b) providing minimum public scientific information to take advantage of “win-dows of opportunity” (Perez & Soete, 1998).
So, the role of science in the periphery does not fit in traditional models. The interplay between science and technology at the periphery indicates that from the beginning of a catching-up process, investments should be made in the scientific infrastructure. As a focusing device, this scientific infrastruc-ture could spot the avenues of technological development that are feasible in the backward country, given the international and national conditions. This
1
means that scientific information is necessary even to advise when the entry is not possible. This is very important to less-developed countries with huge resource scarcity. “Blind search” might be wasteful.
Science is not a simple consequence of initial industrial and technological development. It is not a “natural consequence” of such process. On the contrary, a certain level of scientific capability is a precondition. As this development succeeds, it dynamically changes and upgrades the role of science and its interplay with technology.
Summarizing this section, there is a dual role of science in the catching-up process. First, science can be afocusing device, helping to define policies for technological development, to identify the main international sources of knowledge, and to link the country with the international scientific and tech-nological trends. This first feature demands that the country’s scientific ac-tivities should have some dispersion among all scientific disciplines. Second, the scientific infrastructure is a major support for industrial development, providing the necessary knowledge to enter key industries in the development process. This second feature demands concentration of scientific resources in disciplines with higher impact upon the industrial sectors.
3. Anecdotal Evidence from Country Studies: Korea and Taiwan
Using as a reference a tentative typology for NSIs, catching-up countries such as Korea and Taiwan are clearly different both from more developed countries (mature NSIs) and from less developed countries (immature NSIs).
This section presents evidence about the important efforts that pushed scientific development in Korea and Taiwan. This evidence sheds light on the prior development of certain capabilities in scientific fields vis-`a-vis the development of industrial sectors.
3.1 Taiwan
Hou and Gee (1993:391-2) show that the Taiwanese government adopted in 1959 a “Plan of National Long-Term Development of Science”. In 1967, the former scientific commissions were reorganized as the National Science Coun-cil. According to Hou and Gee (1993:392), “eight fields have been chosen as keys: 1) energy, 2) materials, 3) information, 4) automation, 5) biotechnology, 6) electron optics, 7) hepatitis control, and 8) food technology”.
In 1973 the Industrial Technology Research Institute (ITRI), an essential institution for the Taiwanese system of innovation, was set up. The ITRI is an institution for absorption, development and diffusion of chosen technolo-gies, and its relationship with small and medium enterprises (including the creation of spin-off companies) is essential for the linking between science and technology. In 1979, another government-sponsored research institution was created: the Institute for the Information Industry (III).
There was a division of tasks in the Taiwanese system of innovation: Academia Sinica and the universities conducted basic research; applied re-search and technology development and commercialization of the technology were performed by the institutes and by the firms.
According to Hou and Gee (1993:403), “the major advantage of the system is that limited R&D resources are pooled and the research effort can be aimed at developing generic types of technology that can be beneficial to all firms in the industry”. At the same time, the government policies required ”firms to meet the minimum levels of R&D input levels if they want to qualify for the tax exemption provision”.
3.2 Korea
Kim (1993) discusses the increasing importance of scientific and techno-logical efforts in the Korean economy as the earlier stages of development were overcome. Initially, according to Kim (1993:366), “R&D in the formal sense of the term was not important for Korea during this stage of imitating mature technologies. Industries in fact reversed the sequence of R&D&E: it started with engineering (E) for products and processes imported from abroad, and then progressively evolved into the position of undertaking a substantial de-velopment (D). But research (R) was not relevant to Korea’s industrialization through the 1970s”.2
The first government-sponsored research institute (GRI) in Korea was the Korean Institute of Science and Technology (Kist), established in 1966. Nam (1996:220-1) analyses the GRIs in an evolutionary way: their missions change
2
During this phase, the Korean GDPper capitaincreased from US$920 in 1959 to US$3,093
as the country progresses through new stages of development. During the ini-tial phase (1960s and 1970s), the missions of GRIs were to provide positions for returnees, to promote technology awareness, and to act as government think-tank. In the “consolidation stage” (1980s), the GRIs should function as reserves of researchers and administrative staff for private R&D centers, channels for new technological information, nucleus of industry-GRI joint re-search teams, and as consultants for S&M firms regarding their technological problems. During the 1990s, “research of GRIs should concentrate on the upstream of the R&D. They should conduct research on pre-commercial tech-nology or multiyear multidisciplinary research that cannot be performed by individual firms. They should function as collectors and channels of foreign high technology related to their specialized areas and as a nucleus for joint research” (Nam, 1996:221).
In the Korean case, the chaebols had an important role: the country’s technological effort relied strongly upon them. For instance, various govern-ment programs were promoted to induce the private sector to set up formal R&D laboratories. “Spurred by these programs, the number of corporate R&D laboratories increased from one in 1970 to 122 in 1983 and 604 in 1987” (Kim, 1983:370-1).
The co-ordination of efforts between industry and research institutions was an essential characteristic of the new stage of Korean development. The electronics industry illustrates this point. In the Eight-Year Electronics In-dustry Development Plan (1974), according to Wade (1990:313), there were three main thrusts:
a) to create mission-oriented research institutes;
b) to expand advanced training in electronics; and
c) to encourage imports via licensing and consultants rather than by foreign direct investment.
In 1976, the government established the Korean Institute of Electronics Technology (Kiet). In 1984, the Kiet sold most of its industrial facilities to one chaebol, “changed its name to the Electronics and Telecommunica-tions Research Institute (ETRI), and initiated parallel basic research efforts in semiconductors, computers, and telecommunications” (Wade, 1990:315).
Commenting on the shifts of the technological policies of the Korean govern-ment from the 1970s to the 1980s, Wade points out that the country shifted from a leading role (1970s and 1980s) to that of more of a follower: “It has been concentrating more on basic R&D, leaving commercialization and mar-keting to the firms and setting its R&D agenda in consultation with them” (Wade, 1990:318-9). Kim (1993:372), adds that “in the view of the absence of R&D capability in universities, public R&D institutes have been a back-bone of advanced R&D in Korea. They have also been major instruments for national R&D projects, as they are recipients of over 90% of research grants awarded by the national government in ’new’ technology areas”. Amsden (1989:83) discusses the VLSI project as one of “many high-priority ’national projects’ involving collaboration between private sector R&D labs and public sector research institutes”.
This section summarizes the description of important scientific efforts in Korea and Taiwan. This summary helps to identify a sequence between sci-entific and industrial initiatives. There are situations were there were ini-tial investments in scientific infrastructure and other cases where a more co-ordinated and concomitant growth took place.
4. Five Stylized Facts about the Catching Up of Korea and Taiwan
This section presents the data and their simple statistical description. It investigates whether or not these data could differentiate the Korean and Taiwanese cases (catching-up NSIs) from the others. The basic data area presented in table 1 (and other tables in this section complete the statistical description).
Table 1 shows data for 17 countries:
a) GDP per capita (1981 and 1996);
b) world shares in scientific output (1981 and 1996, data form the ISI) and the respective Herfindahl indexes;
Table 5
Spatial distribution of the labor force, average wages, log-wages and alternative measures for the standardized wage gap between public and private sectors
Country GDP per capita Scientific papers Patents
1981 1992 1981 1996 1981 1994
HI world share HI world share HI world share HI world share
(%) (%) (%) (%)
USA 15,502 17,945 0,085 40,73 0,092 36,49 0,0474 59,63 0,0473 55,13
Japan 10,380 15,105 0,117 6,20 0,1106 9,16 0,0529 12,75 0,0616 22,02
UK 10,017 12,724 0,095 9,00 0,098 9,49 0,0515 3,76 0,0560 2,20
Canada 14,555 16,362 0,076 4,53 0,079 4,95 0,0562 1,73 0,0512 1,97
Germany 11,806 14,709 0,1069 7,50 0,1075 8,11 0,0541 9,59 0,0553 6,62
France 11,746 13,918 0,12 5,21 0,100 6,19 0,0471 3,32 0,0494 2,73
Switzerland 14,387 15,887 0,124 1,38 0,114 1,73 0,0750 1,88 0,0626 1,15
Australia 12,689 14,458 0,083 2,41 0,086 2,77 0,0632 0,48 0,0608 0,46
Finland 10,903 12,000 0,149 0,60 0,129 0,92 0,0803 0,21 0,0677 0,31
Sweden 112,370 13,986 0,1518 1,62 0,119 2,05 0,0622 1,16 0,0524 0,69
Hungary 5,147 4,645 0,1032 0,57 0,1039 0,44 0,1370 0,15 0,1985 0,05
Netherlands 11,079 13,281 0,089 1,65 0,107 2,56 0,0505 0,97 0,0567 0,84
Brazil 3,997 3,882 0,087 0,44 0,092 0,88 0,1002 0,03 0,0656 0,06
India 908 1,282 0,109 3,04 0,107 2,14 0,2778 0,01 0,0947 0,03
Mexico 6,467 6,253 0,131 0,21 0,089 0,48 0,0698 0,07 0,0661 0,04
Korea 3,212 7,251* 0,115 0,055 0,134 0,98 0,1557 0,03 0,1173 0,93
Taiwan 4,593 8,063** 0,087 0,122 0,114 1,13 0,1013 0,12 0,0723 1,42
Observation of these data highlights some distinctive features of the Ko-rean and Taiwanese processes. These data suggest five stylized facts about the relationship between scientific infrastructure and catching-up process.
4.1 High correlation between the growth of scientific and technological
output
The concomitant (high) growth in GDP per capita, patent statistics and scientific publications is highlighted by these data.
To investigate this relationship, a correlation ranking was calculated (cor-relation between scientific output and patent output for all countries and for all years between 1981 and 1994). Table 2 shows this ranking.
Table 2
Correlation between scientific publications and patent granted: selected countries (1981-94)
Country Correlation
Taiwan 0.99327
Korea 0.985068
Japan 0.955751
Canada 0.942476
USA 0.938298
Brazil 0.888944
Finland 0.829146
France 0.7688816
India 0.734766
Australia 0.692026
Netherlands 0.6317
Germany 0.471637
Mexico 0.231337
Switzerland 0.130865
UK 0.094229
Sweden -0.18928
Hungary -0.53389
This high correlation hints that the industrial development of the 1980s has depended heavily on the interaction between research institutions and firms, possibly with mutual self-reinforcing mechanisms and dual feedback.
4.2 High opportunity taking indicators (Otis): interaction between
scientific output and industrial tecnology
This indicator hints the efficiency in the use of scientific resources, and measures the interaction between these two components of the NSIs (Albu-querque, 1999). OTI is a ratio between two different wrld shares: the country’s share of world scientific publications, represented by ISI data (as a proxy for national scientific production); the country’s share of world patenting, repre-sented by its share in USPTO patents (as a proxy for technological activities).
OTI is calculated dividing the share of world patents by the share of world papers. Of course, OTI has many statistical and methodological problems that the literature identifies in patent and scientific publication statistics. Proba-bly, as OTI is a relationship between these already problematic indicators, it magnifies their respective problems.
Because of these magnified measurement problems, OTI can only be used as an auxiliary tool. It can only help to evaluate a relationship between patents and papers.
The intuition behind the OTI is simple: given the complex relationship between science and technology, a comparison between two relative perfor-mances might indicate how well they are interacting.
Moreover, NSIs are institutional structures where different building blocks interact. If there is a big gap between key institutions like, for example, firms, universities and research centers, this means a low level of interconnection of its component parts.
Thus, OTI could be a useful device to provide clues about (some aspects of) the interplay between the scientific and technological dimensions of a NSI. Comparing the two shares (patents and papers) might provide this clue.
To evaluate a possible meaning of OTI, a starting point is a situation where, hypothetically, the two shares are similar. For example, a country has 10% of world scientific papers and 10% of USPTO patents: its OTI is 1. It seems to be a balanced situation, with a balanced interaction between the two dimensions of its NSI. Theoretically, its scientific infrastructure is a
good source of technological opportunities, trained researchers etc. And its productive sector feeds the scientific community with problems, demands, and resources.
Table 3 presents the countries’ ranking.
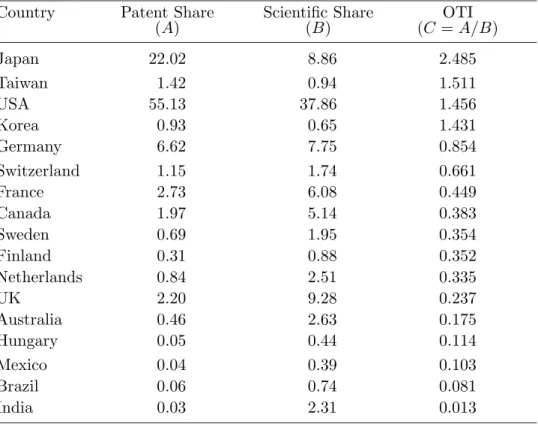
Table 3
Uspto patent shares (patent share), world scientific publication shares (scientific share), and opportunity taking indicator (OTI):
selected countries (1994)
Country Patent Share Scientific Share OTI
(A) (B) (C=A/B)
Japan 22.02 8.86 2.485
Taiwan 1.42 0.94 1.511
USA 55.13 37.86 1.456
Korea 0.93 0.65 1.431
Germany 6.62 7.75 0.854
Switzerland 1.15 1.74 0.661
France 2.73 6.08 0.449
Canada 1.97 5.14 0.383
Sweden 0.69 1.95 0.354
Finland 0.31 0.88 0.352
Netherlands 0.84 2.51 0.335
UK 2.20 9.28 0.237
Australia 0.46 2.63 0.175
Hungary 0.05 0.44 0.114
Mexico 0.04 0.39 0.103
Brazil 0.06 0.74 0.081
India 0.03 2.31 0.013
Source: USPTO, ISI, author’s elaboration.
Korea and Taiwan are among the only four countries that have OTI greater than unity. Japan tops the ranking, possibly a mixture of path-dependence features (the mark of the Japanese catching-up phase), and features of a country that is at the technological frontier. The USA’s position is a result of its technological strengths.
a somehow important scientific output, they may have important problems in the interactions between the scientific and the industrial sectors.
4.3 High concentration in scientific disciplines
The Herfindahl indices for 1996, both for Korea and Taiwan, are among the highest in the sample. Taiwan has the highest index for 1996, and Korea follows Finland and Sweden, and equalizes Switzerland.3
Lattimore and Revesz organized a ranking of “international specialization” using another indicator (variance of scientific revealed comparative advantage per country, VSRCA, hereafter),4
and aggregating the totals from 1981 to 1994. As Lattimore & Revesz explain, this indicator measures the “broadness” of a country’s scientific capability.
A combination between Herfindahl indexes (table 1) and VRSCA (now calculated for 1996, according to table 4) is interesting.
Table 4 presents results that are compatible with Lattimore and Revesz (1996:14) in two aspects. First, for those authors, USA, Japan, United King-dom, France and Germany (mature NSIs) show a mixed “pattern of special-ization”, as these countries have comparative advantage in a broad range of scientific disciplines: table 4 shows low VSRCA for them. Second, for Latti-more and Revesz, Korea and Taiwan (catching-up countries) have a pattern of comparative advantage in publications which are “industry based”: table 4 shows high VSRCA for them.
The VRSCA (especially for 1996 data) differentiates the case of catching-up countries and the small dynamic countries (Sweden, Switzerland and Netherlands). Korea and Taiwan have, like these small countries, high Herfindahl indexes (table 1). However, Korea and Taiwan maintain high fig-ures for VSRCA (0.498 and 0.523, respectively), while Sweden, Switzerland and Netherlands show lower figures (0.168, 0.186, and 0.107, respectively). The small dynamic countries have, on the one hand, a high concentration on some disciplines (shown by the Herfindahl index), but their distribution is less uneven, given their reasonable capabilities in a broader range of scientific disciplines.
3
Catching-up countries and small dynamic economies have in common the need for special-ization in their scientific investments.
4
VSRCA = var [(P i,j/P i,world)/(Pallfields,j/Pallfields,world)] (Lattimore&Revesz, 1996:
15), whereP = scientific papers, from countryi, and scientific fieldj.
Table 4
Variance of scientific revealed comparative advantage (VSRCA): selected countries (1981 and 1996)
Country 1981 1996
Mature NSIs
UK 0.157 0.063
Netherlands 0.219 0.107
Germany 0.165 0.133
Finland 0.281 0.137
Canada 0.156 0.151
Sweden 0.438 0.168
USA 0.157 0.169
Australia 0.157 0.170
Switzerland 0.178 0.186
France 0.198 0.231
Japan 0.300 0.239
Catching-Up NSIs
Korea 0.447 0.498
Taiwan 0.658 0.523
Immature NSIs
Hungary 0.504 0.259
Brazil 0.433 0.331
Mexico 0.240 0.398
India 0.531 0.519
Source: ISI, author’s elaboration.
In sum: catching-up countries have high concentration in certain scientific
disciplines and narrow scientific capabilities; small dynamic countries (with old traditions in science) keep concentration in scientific fields (high Herfindahl indices), but have broader scientific capabilities (low VSCRA). This indicates
that countries like Sweden may “spread its scientific and technological risks” better than countries with later and fresher scientific development like Ko-rea (because KoKo-rea has a high VSCRA). Possibly, the trend for a successful
4.4 Increase in the concentration in scientific disciplines during the
catching-up
The Herfindahl indices for Korea and Taiwan have increased between 1981 and 1996 (table 1). This is an indication that the concentration in scientific disciplines has increased during this phase.
The increase in this concentration probably shows a more efficient allo-cation of scarce resources for scientific development, by focusing in key disci-plines for provision of public knowledge necessary for the industrial develop-ment (Perez & Soete, 1988).
This is a qualification of Pavitt’s (1998:801) suggestion that the scientific specialization should decrease as the country develops. Pavitt used as support the study of Lattimore and Revesz (1996). In this study, the aggregation of scientific publications from 1981 to 1994 added data from two different stages of development of Korea and Taiwan.
The disaggregated data are more adequate to capture the important struc-tural changes that took place in Korea and Taiwan. Using Herfindahl indices, there is an increase of concentration both in Korea and Taiwan (table 1). However, using VSRCA, there are different trends: Korea increases its figures (from 0.447 to 0.498), while Taiwan decreases (from 0.658 to 0.523).
4.5 Decrease in the concentration in patent classes during the
catching-up phase
Concomitantly with the increase in the scientific concentration, Korea and Taiwan presented a decreasing concentration in the patent statistics. As table 1 shows, Korea reduced its concentration in patent classes from 0.156 (Herfindahl index) in 1981 to 0,117 in 1996, and Taiwan from 0.101 to 0.072.
There is coherence between these inverse correlated movements. Klevorick et alii (1995) have studied the different impact of scientific disciplines and uni-versity science upon industrial technology. There are scientific disciplines with a broader impact. Adapting Klevorick’s findings (1995:194 and 196, tables 1 and 3) to ISI’s scientific classification and to SPRU’s patent classes, it is shown that two scientific fields are relevant to more than 10 industrial sectors: en-gineering (15 SPRU patent classes, like metallurgical and metal treatment, industrial apparatus – electrical and non-electrical –, transport equipment, aircraft, instruments etc.); chemistry (11 patent classes, like inorganic chem-istry, organic chemchem-istry, agricultural chemicals, drugs and bioengineering,
terials, plastic and rubber etc.). In this ranking ofindustrial impact of scien-tific disciplinescomputer science comes next (with seven patent classes), then mathematics (with six), and finally materials science and physics (both with impact upon five patent classes).
Therefore, concentration in key scientific fields magnifies their industrial impacts. Korea and Taiwan concentrated their scientific activities in this kind of scientific fields. In 1996, the five leading scientific disciplines (measured by the top country shares in disciplines of world totals) were as follows:
a) Korea – materials science, physics, engineering, computer science, and chemistry;
b) Taiwan – computer science, engineering, materials science, physics, and chemistry.
5. Comparing the Scientific Specialization of Catching-Up and
Imma-ture Systems of Innovation
According to tables 1 to 4, the differences between catching-up countries and immature NSIs can be summarized as follows:
a) catching-up countries have high HIs, high VSRCA, high correlation be-tween scientific and patent outputs, high OTIs, and a concomitant in-crease in the HI for scientific output and a dein-crease in the HI for patent output;
b) immature NSIs (Brazil, Mexico, and India) have lower HIs for scientific output, low OTIs, and lower correlation between scientific and patent output.
To classify the catching-up and immature countries, a more disaggregated level of analysis is used: ISI’s scientific 102 sub-disciplines (the available data aggregate publications from 1992 to 1996). And a sub-discipline is considered as a sub-field of research strength when its “scientific revealed comparative advantage” (SRCA, hereafter) is greater than 2.5
Table 5 shows the results for catching-up countries and Table VI for immature NSIs.
Table 5
Isi scientific sub-disciplines* with Scra greater than 2: catching-up countries (1992-1996)
Country Ranking Sub-Disciplines
Taiwan
1 Artificial intelligence, robotics, and automation control 2 Mechanical engineering
3 Electric and electronic engineering
4 Information technology and communication systems 5 Computer engineering, technology, and application 6 Aerospace engineering
7 Engineering mathematics
8 Engineering management/general 9 Materials science and engineering 10 Chemical engineering
11 Civil engineering Korea
1 Biotechnology and applied microbiology
2 Artificial intelligence, robotics, and automation control
3 Chemistry
4 Engineering management/general 5 Mechanical engineering
6 Materials science and engineering 7 Chemical engineering
8 Information technology and communication systems 9 Electric and electronic engineering
10 Applied physics/conducting materials/materials science 11 Metallurgy
12 Organic chemistry/polymer science 13 Engineering mathematics
Source: ISI database, author’s elaboration. *There are 102 ISI sub-disciplines.
5
SRCA = (P i,j/P i,world)/(Pallfields,j/Pallfields,world).
Table 6
Isi scientific sub-disciplines* with Scra greater than 2: immature NSIs countries (1992-1996)
Country Ranking Sub-Disciplines
Brazil
1 Agriculture/agronomy
2 Biology
3 Medical Research, general topics
4 Physics
Mexico
1 Entomology/pest control
2 Space science
3 Biology
4 Physics
5 Rheumatology
6 Aquatic Sciences
7 Public Health and health care
8 Biotechnology and applied microbiology
9 Plant sciences
10 Optics and acoustics India
1 Agriculture/agronomy
2 Engineering management/general 3 Veterinary medicine/animal health 4 Biotechnology and applied microbiology 5 Inorganic and nuclear chemistry
6 Organic chemistry/polymer science
7 Animal sciences
8 Chemistry
9 Metallurgy
Source: ISI database, author’s elaboration. *There are 102 ISI sub-disciplines.
Korea and Taiwan continue to be fitted in the industry-based category (their top sub-disciplines are all directly related to the fields Lattimore and Revesz identify in this category, with the unique exception of biotechnology, one of the 13 sub-disciplines with SRCA greater than 2 for Korea).
In this mixed category, according to Lattimore and Revesz (1996:14), there are two distinct groups: “the most scientifically dominant in the world (USA, Japan, France, and Germany)”; and “the least developed scientifically (Papua New Guinea, Thailand)”. Of course, Brazil, Mexico and India are not fitted in this category of ”least developed scientifically”, but they could be fitted in an intermediary category, as the NSI typology suggests: immature systems.
The tentative typology of NSIs (section 1) can be enriched by this new distinction: catching-up countries concentrate their scientific resources for very specific uses, while the immature NSIs do not focus their efforts, keeping a certain level of dispersion throughout disciplines not closely related.
However, as discussed in section 1, science in the periphery has a dual role: a focusing device and a support for interactions with industrial technol-ogy. Therefore, the data presented in table 6 (combined with all the informa-tion from secinforma-tion 3) point at the existence of capability for the first role: an available focusing device. This suggests that an initial precondition for the beginning of a catching – process already exists in Brazil, Mexico, and India.
In the Brazilian case, another feature of the NSI is presented: its uneven nature, that combines more developed sectoral systems, as the agro-industrial sector, as shown by Lemos (1992),6
with other strategic sectors that are clearly underdeveloped (for instance, electronics and biomedical).
6. Concluding Remarks
The mutual feedback and interaction between science and technology in the catching-up process (Korea and Taiwan) and some stylized facts are pre-sented in this paper. There is a final question for further investigation: what are the forces and features that underlie this positive feedback?
The scientific infrastructureper seis not sufficient to detonate this process. It seems that there are some key preconditions:
6
The sub-discipline agriculture/agronomy leading the Brazilian specialization (table 6) might be an indicator of this sectoral maturity: there seems to be links between scientific infrastruc-ture and business firms working in Brazil.
a) an income threshold to be overcome (a minimum level of GDPper capita);
b) a certain level of articulation with world scientific, technological and com-mercial flows;
c) a set of active established firms, with capable of absorbing foreign tech-nology and interacting with national research institutions;
d) institutions and policies for building and guiding these relationships and interactions;
e) the capability of scientific institutions to act as focusing devices for the international search processes;
f) educational institutions.
The contrasting cases of, on the one hand, Brazil, Mexico and India, and, on the other, Korea and Taiwan exemplify the presence (or lack) of those preconditions.
What very general lessons cautiously could be drawn from the East Asian example? One is the need of that set of preconditions for the beginning of a consistent catching-up process. However, three questions differentiate a coun-try like Brazil from Korea and Taiwan. First, the size of the councoun-try and the diversity of needs points towards a more diverse and variegated system of innovation (the concentration of scientific resources might be defined in a way that provides broader specialization for the industrial sector and for the welfare-state institutions). Second, the democratic phase of the country indicates that the necessary negotiations between different actors might take more complex and open forms. And, finally, the scientific content of industrial technology is greater now than it was in the early 1980s, therefore the con-tributions of the scientific infrastructure may be greater now than they were during the Korean and Taiwanese catching-up processes.
References
Albuquerque, E. National systems of innovation and non-OECD countries: notes about a tentative typology. Revista de Economia Pol´ıtica, 19(4):35-52, 1999.
Bell, M. & Pavitt, K. Technological accumulation and industrial growth. In-dustrial and Corporate Change, 2(2):157-211, 1993.
Choung, Jae-Yong. Technological capabilities of Korea and Taiwan: an anal-ysis using us patenting statistics. Brighton, Spru, 1995. (Steep Discussion Paper, 26.)
Dasgupta, P. & David, P. Toward a new economic of science. Research Policy, 23(4), Sept. 1994.
Freeman, C. The “National System of Innovation” in historical perspective.
Cambridge Journal of Economics, 19(1), 1995.
Hou, C. & Gu, S. National systems supporting technical advance in industry: the case of Taiwan. In: Nelson, R. (ed.). National innovation systems: a comparative analysis. New York; Oxford, Oxford University, 1993. p. 76-114.
Kim, L. National system of industrial innovation: dynamics of capability building in Korea. In: Nelson, R. (ed.). National innovation systems: a comparative analysis. New York; Oxford, Oxford University, 1993. p. 357-83.
Klevorick, A.; Levin, R.; Nelson, R. & Winter, S. On the sources and signif-icance of inter-industry differences in technological opportunities. Research Policy, 24:185-205, 1995.
Lattimore, R. & Revesz, J. Australian science: performance from published papers. Canberra, Australian Government Printing Office, 1996. (Bureau of Industry Economics Report, 96/3.)
Lemos, M. B. The agro-food system in semi-industrialized countries: the Brazilian case. London, University of London College/University of London, 1992. (Ph.D. Dissertation.)
Nam, Y-H. The changing roles of government-supported research institutes in Korea: analysis of their mission from their inception to the present. In: Science and Technology Policy Institute. Review of science and technology policy for industrial competitiveness in Korea. Seoul, Stepi, 1996.
Narin, F.; Hamilton, K. S. & Olivastro, D. The increasing linkage between U.S. technology and public science. Research Policy, 26(3):317-30, 1997.
Nelson, R. The role of knowledge in R&D efficiency. The Quaterly Journal of Economics. Cambridge,97(3):453-71, Aug. 1982.
. National innovation systems: a comparative analysis. New York, Oxford, Oxford University, 1993.
& Rosenberg, N. Technical innovation and national systems. In: Nelson, R. (ed.). National innovation systems: a comparative analysis. New York; Oxford, Oxford University, 1993. p. 3-21.
Patel, P. & Pavitt, K. National innovation systems: why they are important, and how they might be measured and compared. Economics of Innovation and New Technology, 3(1):77-95, 1995.
Pavitt, K. What makes basic research economically useful? Research Policy, 20(2):109-19, 1991.
. The social shape of the national science base. Research Policy, 27(8):793-805, 1998.
Perez, C. & Soete, L. Catching-up in technology: entry barriers and windows of opportunity. In: Dosi, G. et alii (eds.). Technical change and economic theory. London, Pinter, 1988. p. 458-79.
Rosenberg, N.Perspectives on technology. Cambridge, Cambridge University, 1976.