Population analysis of vitamin D receptor polymorphisms
and the role of genetic ancestry in an admixed population
Tulio C. Lins
1, Rodrigo G. Vieira
1, Dario Grattapaglia
1,2and Rinaldo W. Pereira
1 1Programa de Pós-Graduação em Ciências Genômicas e Biotecnologia, Universidade Católica de Brasília,
Brasília, DF, Brazil.
2
Hereditas Tecnologia em Análise de DNA, Brasília, DF, Brazil.
Abstract
The vitamin D receptor (VDR) is an essential protein related to bone metabolism. SomeVDR alleles are differentially distributed among ethnic populations and display variable patterns of linkage disequilibrium (LD). In this study, 200 unrelated Brazilians were genotyped using 21 VDR single nucleotide polymorphisms (SNPs) and 28 ancestry infor-mative markers. The patterns of LD and haplotype distribution were compared among Brazilian and the HapMap populations of African (YRI), European (CEU) and Asian (JPT+CHB) origins. Conditional regression and haplotype-specific analysis were performed using estimates of individual genetic ancestry in Brazilians as a quantitative trait. Similar patterns of LD were observed in the 5’ and 3’ gene regions. However, the frequency distribution of haplotype blocks varied among populations. Conditional regression analysis identified haplotypes associated with European and Amerindian ancestry, but not with the proportion of African ancestry. Individual ancestry estimates were associ-ated withVDR haplotypes. These findings reinforce the need to correct for population stratification when performing genetic association studies in admixed populations.
Key words:Brazilian population, HapMap, haplotype, population diversity, VDR. Received: February 7, 2011; Accepted: April 27, 2011.
Introduction
The vitamin D receptor (VDR) is a member of the superfamily of nuclear receptors for steroid hormones that functions as a ligand-activated transcription factor (Dusso
et al., 2005). The VDR associated with the secosteroid hor-mone 1,25-dihydroxyvitamin D3 (1,25(OH)2 Vitamin D3) and heterodimerized with the retinoid X receptor (RXR) binds to vitamin D3 response elements in the promoter re-gion of responsive genes (Dussoet al., 2005). The genes that are up- or down-regulated by the complex of vitamin D3, VDR, RXR and other recruited proteins are associated with calcium homeostasis, bone metabolism, cell cycle, immunomodulation and other hormonal systems (Dussoet al., 2005; Lips, 2007). The broad range of vitamin D func-tions has focused attention on theVDRgene as an important candidate gene that could explain variations in specific phenotypes possibly connected with vitamin D metabolism (Valdivielso and Fernandez, 2006).
Much information has been generated since the first description ofVDRpolymorphism (Morrisonet al., 1994) and has led to intense investigation of the allelic variation in
theVDRgene in different ethnic populations (Nejentsevet al., 2004; Thakkinstianet al., 2004; Fanget al., 2005). The conflicting data on the association ofVDRpolymorphisms with specific phenotypes is sometimes confusing. The rea-sons commonly given to explain the difficulty in reproduc-ing many results include uncontrolled environmental factors, population stratification, locus heterogeneity and different linkage disequilibrium (LD) patterns (Nejentsev
et al., 2004; Thakkinstianet al., 2004; Fanget al., 2005). The VDR region consists essentially of three haplotype blocks located in the intergenic region of the VDR and
COL1A1gene, the 5’ promoter region and the 3’ region en-compassing the untranslated region, with the frequency dis-tributions of LD and haplotypes varying among European, African and Asian populations (Nejentsev et al., 2004; Fanget al., 2005).
Specific variations in the allelic frequencies ofVDR
polymorphisms among Europeans, Africans, Amerindians and Asians could increase the risk of spurious associations in studies of recently admixed populations such as ians (Rosenberg and Nordborg, 2006). The current Brazil-ian population is one of the most heterogeneous in the world, descending from an admixture of Europeans, Ame-rindians and Africans during the last five centuries. The use of ancestry informative markers (AIMs) has revealed
www.sbg.org.br
Send correspondence to Rinaldo Wellerson Pereira. Universidade Católica de Brasília, SGAN 916, módulo B, bloco C, 2° andar, sala S-220, Asa Norte, 70790-160 Brasília, DF, Brazil. E-mail: [email protected].
ample genetic heterogeneity in the Brazilian population (Callegari-Jacqueset al., 2003; Parraet al., 2003; Marrero
et al., 2005; Linset al., 2010) and this characteristic may be used to control population stratification in association stud-ies (Suarez-Kurtzet al., 2007).
Association studies in admixed populations relying only on self-reported ancestry or physical features to ar-range volunteers in homogenous groups may produce spu-rious associations because of stratification generated by ad-mixture (Cardon and Palmer, 2003; Ziv and Burchard, 2003; Suarez-Kurtzet al., 2007). This is particularly impor-tant when DNA markers used to conduct association stud-ies and the phenotype investigated display different fre-quency distributions among the reference groups that gave rise to the admixed population (Pritchard and Donnelly, 2001; Rosenberg and Nordborg, 2006). Bone phenotypes differ among Africans and Europeans (Gilsanzet al., 1998; Joneset al., 2004) and several polymorphisms, including those of theVDR gene, have been investigated as candi-dates to explain its quantitative variation. The purpose of this study was to perform a greater in-depth analysis of variability in theVDRgene in admixed Brazilians and cor-relate this variability with individual genetic ancestry esti-mates in order to identify possible pitfalls when performing association studies in an admixed population.
Material and Methods
Population sample
The Brazilian population sample (BRZ) consisted of 200 unrelated healthy subjects randomly chosen from indi-viduals involved in no-cost paternity investigations from 2003 to 2005. All subjects signed an informed consent form that allowed the use of their DNA samples for paternity testing and further population genetics research. To avoid bias during analysis no attempt was made to classify the subjects according to morphological or social traits. The subjects were allocated to one of five groups (n = 40 each) based on their birthplace in one of the five geopolitical re-gions (Midwest, Northeast, North, Southeast and South) of Brazil. The research protocol was approved by the univer-sity Ethics Committee.
HapMap data and genotyping
TheVDRgenotypes of the HapMap population sam-ples were retrieved from an online database (Data Rel 21a/phaseII Jan07, on NCBI B35 assembly, dbSNP b125). The total sample consisted of 89 unrelated East-Asian indi-viduals (ASN) comprising 45 Han Chinese from Beijing (CHB) and 44 Japanese from Tokyo (JPT), 60 unrelated in-dividuals from northern and western European origin (CEU) and 60 unrelated Yoruba individuals (YRI) from Ibadan, Nigeria.
The choice ofVDRSNPs was based on markers of HapMap phase I and phase II data that were polymorphic in
at least one population and dispersed with average inter-vening distances of 5 kb; Haploview software (Barrettet al., 2005) was used to establish the LD patterns. Subse-quently, a minimum set of SNPs representing the original LD blocks was selected with a 90% prediction coverage (Linset al., 2009). Sixteen SNPs were selected in addition to the five most studied VDR polymorphisms (rs11568820-Cdx2, rs10735810-FokI, rs1544410-BsmI, rs7975232-ApaI and rs731236-TaqI) used in our previous studies (Gentilet al., 2007, 2009; Linset al., 2007, 2009; Moreno Limaet al., 2007).
Estimates of genetic admixture in the Brazilian sam-ples were calculated using a set of 28 autosomal ancestry informative markers (AIMs) selected from previous studies that reported large differences in allele frequency among European, African and Native American populations. De-tailed procedures for calculating the ancestry estimates are described by Linset al.(2010) who used the same popula-tion as the present study.
PCR primers and single base extension primers were designed using Primer3 based on recommendations of the SNaPshot Multiplex Kit protocol (Applied Biosystems). The SNPs were assembled into three multiplex panels and then genotyped by a modified single base extension meth-odology described elsewhere (Linset al., 2007).
Statistical analysis
Estimates of allele frequency, deviations from Har-dy-Weinberg equilibrium and pairwise genetic distance es-timates based on Wright’s Fst statistics were calculated using Arlequin v. 3.01 (Excoffieret al., 2005).
significant (Purcellet al., 2007). For quantitative traits, the conditional analysis approach is more robust and was cho-sen to model genotype conditional on trait, instead of trait conditional on genotype (the usual approach in such analy-ses) (Purcellet al., 2007). In addition, a standard approach run in Phase version 2.0.2 software (Stephens and Donnel-ly, 2003) was used to estimate recombination hotspots by comparing the median of recombination parameters among SNP pairs with the background rate assumed for the general human population (Crawfordet al., 2004).
Results
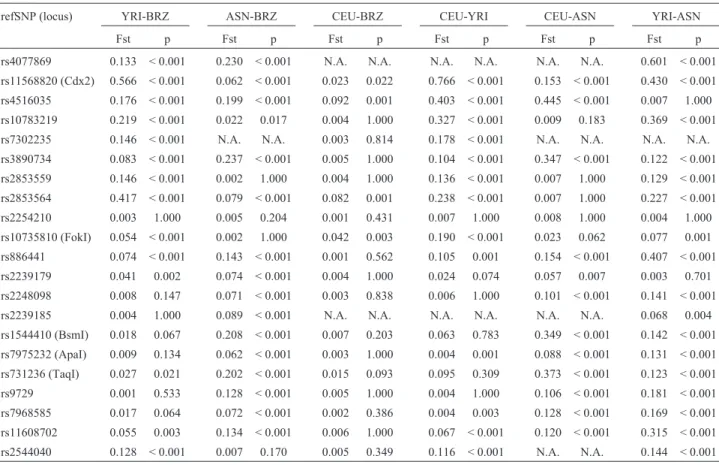
The allele frequency distribution for theVDR gene was similar in the five geopolitical regions (Table 1) and a pairwise Fst test identified no significant difference among them (allp-values were > 0.050). However, a significant difference was found when the Brazilian subgroups were combined to form one group (BRZ) and compared with the HapMap populations in a pairwise Fst test. In this case, the Brazilian population was genetically more distant from the HapMap African derived population (BRZ-YRI Fst = 0.154; p < 0.001) than from the HapMap population with European background (BRZ-CEU Fst = 0.012; p = 0.009). The analysis of individual loci showed that only four out of 19 loci were significantly different (p < 0.05) in
the pair BRZ-CEU (Table 2). In contrast, in the other popu-lation pairs, only a few loci did not differ significantly in their allele frequencies (Table 2).
Information on theVDR haplotype structure in the HapMap data showed that haplotype extension was greater in CEU, followed by ASN and YRI, which had more blocks of lower extension, compared to the others (Figure 1). The CEU and ASN populations had similar LD patterns, with two blocks in the 5’ region, one of them identical, and one block in the 3’ region. A difference was observed only in the length of the first 5’ and 3’ haplotype blocks.
For a comparative inter-population analysis of haplo-type block diversity, four SNPs were excluded from the BRZ dataset either because they lacked genotypes in HapMap (e.g., rs4077869 and rs2239185 missing in the CEU population and rs7302235 missing in the ASN popu-lation) or deviated from Hardy-Weinberg expectations in BRZ (rs4516035 p = 0.001). Overall, two blocks were ob-served in the Brazilian population, one in the 5’ gene region and another at the end of the transcription region and the 3’ UTR region of theVDRgene (Figure 1). The 5’ haplotype block contained the Cdx2, rs10783219 and rs3890734 SNPs and extended 13 kb, with mean linkage disequilib-rium measures of D’ = 0.924 and r2 = 0.175. The 3’ haplotype block consisted of rs2248098, BsmI, ApaI, TaqI,
Table 1- SNPs genotyped in theVDRgene and their chromosomal position (chromosome 12 genomic contig, NT_029419.11) and allelic frequencies in the samples from the HapMap populations, the total Brazilian population and the five geopolitical regional samples.
SNP (locus) Position Allele CEU YRI ASN BRZ N NE MW SE S
rs4077869 46591911 A N.A. 0.400 0.978 0.667 0.538 0.650 0.650 0.731 0.769
rs11568820 (Cdx2) 46588812 C 0.792 0.017 0.506 0.684 0.663 0.705 0.637 0.688 0.731
rs4516035 46586093 A 0.575 0.992 0.989 0.788 0.778 0.786 0.789 0.684 0.958
rs10783219 46581755 A 0.331 0.000 0.416 0.306 0.244 0.325 0.333 0.282 0.346
rs7302235 46579105 A 0.741 0.425 N.A. 0.703 0.637 0.776 0.724 0.643 0.731
rs3890734 46575622 C 0.675 0.877 0.994 0.684 0.679 0.688 0.700 0.675 0.676
rs2853559 46569072 A 0.424 0.169 0.421 0.449 0.414 0.544 0.545 0.395 0.361
rs2853564 46564754 A 0.583 0.908 0.579 0.372 0.262 0.338 0.410 0.488 0.363
rs2254210 46559981 C 0.633 0.658 0.624 0.688 0.700 0.712 0.675 0.613 0.738
rs10735810 (FokI) 46559162 C 0.525 0.833 0.646 0.674 0.675 0.744 0.667 0.628 0.658
rs886441 46549231 A 0.808 0.583 0.978 0.767 0.800 0.718 0.868 0.705 0.744
rs2239179 46544033 C 0.417 0.292 0.247 0.443 0.462 0.408 0.500 0.463 0.371
rs2248098 46539623 A 0.425 0.381 0.663 0.465 0.387 0.551 0.425 0.450 0.512
rs2239185 46530826 A N.A. 0.542 0.347 0.568 0.552 0.574 0.600 0.615 0.500
rs1544410 (BsmI) 46526102 C 0.525 0.712 0.921 0.605 0.637 0.590 0.618 0.526 0.654
rs7975232 (ApaI) 46525104 G 0.424 0.375 0.645 0.460 0.475 0.500 0.425 0.385 0.512
rs731236 (TaqI) 46525024 A 0.526 0.750 0.933 0.627 0.625 0.603 0.700 0.551 0.654
rs9729 46522890 G 0.414 0.337 0.657 0.390 0.375 0.395 0.412 0.295 0.474
rs7968585 46518360 A 0.592 0.633 0.326 0.525 0.500 0.483 0.433 0.645 0.528
rs11608702 46515035 A 0.358 0.183 0.618 0.347 0.275 0.350 0.395 0.295 0.423
rs2544040 46509213 C 1.000 0.885 1.000 0.985 1.000 1.000 1.000 1.000 0.925
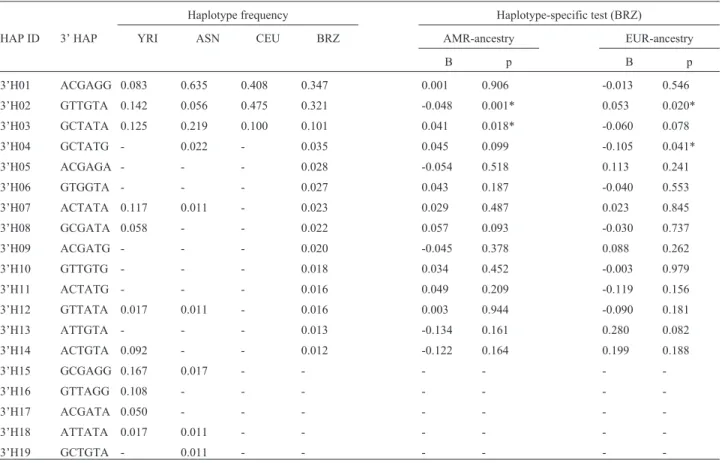
rs9729, rs7968585 SNPs and spanned 21 kb, with mean linkage disequilibrium measures of D’ = 0.849 and
r2= 0.475. The estimated haplotypes for each block identi-fied five haplotypes in the 5’ region (Table 3) and 19 in the 3’ region of the gene (Table 4) when all populations were considered.
Regions with no haplotype blocks and a low LD were found between SNPs rs3890734 and rs2853559 and be-tween SNPs rs2254210, FokI and rs886441, for which no block structure was found in any of the populations studied (Figure 1). The test to identify possible recombination hotspots showed two regions of greater intensity relative to the background recombination rate. In Brazilians, the re-gion at FokI and rs886441 had a recombination rate 60 times higher than the background rate, whereas between rs3890734 and rs2853559 the rate was 18 times higher (Figure 1).
The test for population structure in the Brazilian pop-ulation using autosomal AIMs identified a higher probabil-ity for a three-hybrid population, and assigned estimates of contributions as 0.771±0.044 for European, 0.143±0.019 for African and 0.085±0.015 for Amerindian. The individ-ual estimates of ancestry proportion showed that most indi-viduals had a widely distributed three-hybrid pattern of variation with a trend towards a higher contribution by
Eu-ropean ancestry. The individual estimates were later used as a quantitative trait in conditional regression tests. Table 2- Pairwise population differences (Fst) for locus-by-locus analysis for the HapMap samples and total Brazilian population.
refSNP (locus) YRI-BRZ ASN-BRZ CEU-BRZ CEU-YRI CEU-ASN YRI-ASN
Fst p Fst p Fst p Fst p Fst p Fst p
rs4077869 0.133 < 0.001 0.230 < 0.001 N.A. N.A. N.A. N.A. N.A. N.A. 0.601 < 0.001
rs11568820 (Cdx2) 0.566 < 0.001 0.062 < 0.001 0.023 0.022 0.766 < 0.001 0.153 < 0.001 0.430 < 0.001
rs4516035 0.176 < 0.001 0.199 < 0.001 0.092 0.001 0.403 < 0.001 0.445 < 0.001 0.007 1.000
rs10783219 0.219 < 0.001 0.022 0.017 0.004 1.000 0.327 < 0.001 0.009 0.183 0.369 < 0.001
rs7302235 0.146 < 0.001 N.A. N.A. 0.003 0.814 0.178 < 0.001 N.A. N.A. N.A. N.A.
rs3890734 0.083 < 0.001 0.237 < 0.001 0.005 1.000 0.104 < 0.001 0.347 < 0.001 0.122 < 0.001
rs2853559 0.146 < 0.001 0.002 1.000 0.004 1.000 0.136 < 0.001 0.007 1.000 0.129 < 0.001
rs2853564 0.417 < 0.001 0.079 < 0.001 0.082 0.001 0.238 < 0.001 0.007 1.000 0.227 < 0.001
rs2254210 0.003 1.000 0.005 0.204 0.001 0.431 0.007 1.000 0.008 1.000 0.004 1.000
rs10735810 (FokI) 0.054 < 0.001 0.002 1.000 0.042 0.003 0.190 < 0.001 0.023 0.062 0.077 0.001
rs886441 0.074 < 0.001 0.143 < 0.001 0.001 0.562 0.105 0.001 0.154 < 0.001 0.407 < 0.001
rs2239179 0.041 0.002 0.074 < 0.001 0.004 1.000 0.024 0.074 0.057 0.007 0.003 0.701
rs2248098 0.008 0.147 0.071 < 0.001 0.003 0.838 0.006 1.000 0.101 < 0.001 0.141 < 0.001
rs2239185 0.004 1.000 0.089 < 0.001 N.A. N.A. N.A. N.A. N.A. N.A. 0.068 0.004
rs1544410 (BsmI) 0.018 0.067 0.208 < 0.001 0.007 0.203 0.063 0.783 0.349 < 0.001 0.142 < 0.001
rs7975232 (ApaI) 0.009 0.134 0.062 < 0.001 0.003 1.000 0.004 0.001 0.088 < 0.001 0.131 < 0.001
rs731236 (TaqI) 0.027 0.021 0.202 < 0.001 0.015 0.093 0.095 0.309 0.373 < 0.001 0.123 < 0.001
rs9729 0.001 0.533 0.128 < 0.001 0.005 1.000 0.004 1.000 0.106 < 0.001 0.181 < 0.001
rs7968585 0.017 0.064 0.072 < 0.001 0.002 0.386 0.004 0.003 0.128 < 0.001 0.169 < 0.001
rs11608702 0.055 0.003 0.134 < 0.001 0.006 1.000 0.067 < 0.001 0.120 < 0.001 0.315 < 0.001
rs2544040 0.128 < 0.001 0.007 0.170 0.005 0.349 0.116 < 0.001 N.A. N.A. 0.144 < 0.001
HapMap populations: CEU = European derived ancestry, YRI = African derived ancestry, ASN = Asian derived ancestry; BRZ = total Brazilian popula-tion. N.A. = Data not available (includes monomorphic loci and missing data). p < 0.05 indicates a significant difference.
The conditional regression omnibus test indicated a significant correlation with the 5’ haplotypes only when es-timates of European ancestry were used (p = 0.027) and for 3’ haplotypes there was a significant correlation when us-ing estimates of Amerindian and European ancestry (p = .018 and 0.041, respectively); there was no signifi-cance when using African ancestry proportions (p > 0.111).
Haplotype-specific tests in the 5’ region identified two haplotypes with opposing raw regression coefficients (B) indicating that the first haplotype (5’H01) was positively related to European ancestry while the second (5’H02) had a negative correlation (Table 3). In the 3’ region, haplo-types with opposing raw regression coefficient signs (B) were significant for Amerindian ancestry (3’H02 and Table 3- Distribution of the 5’ haplotype frequencies among different populations and the association between Brazilian populations and European an-cestry.
Haplotype frequency Haplotype-specific test (BRZ)
HAP ID 5’ HAP YRI ASN CEU BRZ EUR-ancestry
B p
5’H01 CTT 0.017 - 0.325 0.314 0.048 0.036 *
5’H02 TTC 0.883 0.494 0.208 0.309 -0.059 0.013 *
5’H03 CAC - 0.410 0.342 0.292 0.020 0.395
5’H04 CTC - 0.090 0.125 0.086 -0.039 0.281
5’H05 TTT 0.100 - - - -
-HAP ID = Haplotype identity; 5’ -HAP = Haplotypes in the 5’ gene region consisting of Cdx2, rs10783219 and rs3890734 SNPs. HapMap populations: ASN = Asian derived ancestry, CEU = European derived ancestry, YRI = African derived ancestry; BRZ = total Brazilian population. EUR = European genetic ancestry. B = raw regression coefficient. p < 0.05 indicates a significant correlation.
Table 4- Distribution of the 3’ haplotype frequencies among different populations and the association between Brazilian populations and European (EUR) and Amerindian (AMR) ancestry.
Haplotype frequency Haplotype-specific test (BRZ)
HAP ID 3’ HAP YRI ASN CEU BRZ AMR-ancestry EUR-ancestry
B p B p
3’H01 ACGAGG 0.083 0.635 0.408 0.347 0.001 0.906 -0.013 0.546
3’H02 GTTGTA 0.142 0.056 0.475 0.321 -0.048 0.001* 0.053 0.020*
3’H03 GCTATA 0.125 0.219 0.100 0.101 0.041 0.018* -0.060 0.078
3’H04 GCTATG - 0.022 - 0.035 0.045 0.099 -0.105 0.041*
3’H05 ACGAGA - - - 0.028 -0.054 0.518 0.113 0.241
3’H06 GTGGTA - - - 0.027 0.043 0.187 -0.040 0.553
3’H07 ACTATA 0.117 0.011 - 0.023 0.029 0.487 0.023 0.845
3’H08 GCGATA 0.058 - - 0.022 0.057 0.093 -0.030 0.737
3’H09 ACGATG - - - 0.020 -0.045 0.378 0.088 0.262
3’H10 GTTGTG - - - 0.018 0.034 0.452 -0.003 0.979
3’H11 ACTATG - - - 0.016 0.049 0.209 -0.119 0.156
3’H12 GTTATA 0.017 0.011 - 0.016 0.003 0.944 -0.090 0.181
3’H13 ATTGTA - - - 0.013 -0.134 0.161 0.280 0.082
3’H14 ACTGTA 0.092 - - 0.012 -0.122 0.164 0.199 0.188
3’H15 GCGAGG 0.167 0.017 - - -
-3’H16 GTTAGG 0.108 - - -
-3’H17 ACGATA 0.050 - - -
-3’H18 ATTATA 0.017 0.011 - - -
-3’H19 GCTGTA - 0.011 - - -
3’H03) and two haplotypes (3’H02 and 3’H04) were signif-icant for European ancestry (Table 4). When the 3’ type block was reduced to only the Bsm-Apa-Taq haplo-type, a similar effect of ancestry was observed, but in this case the haplotype with a positive regression in Amerindian ancestry had a negative regression in European ancestry and vice-versa (Table 5).
Discussion
In this work, a panel of allelic diversity at theVDR
gene locus was generated and the effect of genetic ancestry on haplotype distribution in an admixed population was evaluated. The results described here extend the informa-tion aboutVDRgenotypes and provide the first map ofVDR
haplotypes for a Brazilian population.
The measures of population admixture evaluated with AIMs revealed that the biogeographical ancestral structure of the Brazilian population was European, African and Am-erindian (in this order), as previously described (Linset al., 2010). However, Fst analysis of VDR SNPs revealed a greater distinction between the Brazilian population and the HapMap population of African origin than with the HapMap population of European origin. These results indi-cate that, in an admixed population, recent admixture can-not always eliminate ancestral LD block structures along chromosomes (Sawyeret al., 2005; Tanget al., 2006). Con-sequently, complex levels of population admixture can cre-ate analytical risks in research involving loci associcre-ated with susceptibility to disease and in populations with dif-ferent profiles, especially in those undergoing admixture. This is likely the case of theVDRgene and bone metabo-lism phenotypes, such as bone mineral density and osteopo-rosis (Thakkinstianet al., 2004; Uitterlindenet al., 2004).
Some studies have clearly demonstrated significant associations between European ancestry and body compo-sition traits in admixed populations (Bonillaet al., 2004;
Shafferet al., 2007), while others have shown the relation-ship betweenVDRhaplotypes and fracture risk in Whites or osteoporosis in European and Asian populations (Thak-kinstianet al., 2004; Fanget al., 2005). The present work improves our understanding of the effect of genetic ances-try on the distribution ofVDRgene haplotypes in admixed populations and reinforces the importance of correcting for population admixture in genetic association studies that en-compass bone-related phenotypes.
The comparative analysis ofVDR revealed genetic heterogeneity involving different haplotype blocks in the four populations studied. Considering the recent admixture of Latin American people, especially Brazilians, the varia-tion in the patterns of LD seen here is not surprising in view of demographic events and genetic factors such as drift and recombination during the process of admixture (Gabrielet al., 2002; Liuet al., 2004; Sawyeret al., 2005). Haplotype structure analysis in other admixed populations has also re-vealed the importance of genetic heterogeneity since link-age disequilibrium increases or breaks down differently in different populations (Moraes et al., 2003; Boldt et al., 2006; Lohmuelleret al., 2006; Nakamotoet al., 2006).
Random genetic drift generates large diversity among populations with the same continental origin,e.g., African, European, Amerindian or Asian (Rosenberget al., 2002). In the present case, the HapMap populations used for com-parison were not the most representative sources for the Brazilian parental population studied here and differed from those used to estimate individual autossomic ancestry (which also do not represent the Brazilian parental popula-tions). This limitation is extremely important since the groups used here represent more general continental popu-lations and their characteristics should therefore not be ex-trapolated to specific populations such as the many that constituted the admixture in current Brazilians, particularly when studying disease-related polymorphisms. As with
Table 5- Distribution of the Bsm-Apa-Taq haplotype frequencies among different populations and the association between Brazilian populations and European (EUR) and Amerindian (AMR) ancestry.
Bsm-Apa-Taq Haplotype frequency Haplotype-specific test (BRZ)
HAP ID HAP YRI ASN CEU BRZ AMR-ancestry EUR-ancestry
B p B p
baT CGA 0.367 0.657 0.417 0.418 0.013 0.279 -0.006 0.766
BAt TTG 0.158 0.062 0.475 0.332 -0.044 0.001* 0.058 0.008*
bAT CTA 0.258 0.258 0.108 0.175 0.037 0.005* -0.065 0.007*
Bat TGG - - - 0.023 -0.090 0.189 0.071 0.422
BAT TTA 0.125 0.017 - 0.022 -0.008 0.858 -0.089 0.155
BaT TGA - - - 0.017 -0.022 0.760 -0.022 0.800
bAt CTG 0.083 - - 0.013 -0.073 0.286 0.121 0.242
considerations about genetic ancestry and disease-associated SNPs, the patterns of LD and identification of genetic ancestry blocks should also be addressed prior to the selection of tagSNPs for association studies in admixed populations (Linset al., 2009).
The distribution of the 5’ haplotype for theVDRgene in BRZ was similar to that of the CEU population. The re-gression coefficient confirmed this relationship. In this case, the haplotype that showed a positive association with European ancestry in Brazilians (5’H01) was absent in the ASN population and had a low frequency in YRI (Table 3). In contrast, the haplotype that correlated negatively with European ancestry (5’H02) had a higher frequency in YRI and ASN than in CEU. These results indicate that both Eu-ropean and non-EuEu-ropean ancestries contributed to haplo-type variation in our admixed population. Notably, this same phenomenon occurred in the 3’ region haplotypes, but in this case there was also a significant association with the Amerindian contribution (Table 4).
The African ancestry showed no correlation with any of the haplotypes examined. Indeed, variation in the extent and amount of LD in theVDRgene is lower in African pop-ulations than in European or East-Asians (Nejentsevet al., 2004; Fanget al., 2005), suggesting that extensive recom-bination precluded the extension of LD in African popula-tions. In agreement with this, the 3’ haplotypes defined by the BRZ population exhibited high diversity and low fre-quencies in YRI (Table 4) when compared to Bsm-Apa-Taq haplotypes, which had a higher LD (Table 5). More-over, the FokI SNP was not in linkage disequilibrium with any of the SNPs in the populations tested. This observation corroborates previous findings (Nejentsev et al., 2004; Fanget al., 2005) and suggests a major site of haplotype breakage and recombination in theVDRgene that is inde-pendent of ethnicity.
Previous studies of theVDRgene in Brazilians only sampled a few loci but some complex phenotypes (Laza-retti-Castroet al., 1997; Hauacheet al., 1998; de Brito Ju-nioret al., 2004; Maistroet al., 2004; Goulartet al., 2006; Gentilet al., 2007, 2009; Moreno Limaet al., 2007; Re-zendeet al., 2007). Some studies have tried to correct the genetic heterogeneity of the Brazilian population by using self-reported ancestry or physical traits as proxy for differ-ent ethnic groups. For instance, Rezendeet al.(2007) re-ported no difference in the distribution ofVDRhaplotypes in Brazilian self-reported Blacks and Whites. This may be explained by the fact that dissociation between physical ap-pearance and genetic ancestry in Brazilians (Parraet al., 2003; Marreroet al., 2005) may have created spurious sim-ilarity in genotype and haplotype frequencies among these groups because of the population substructure. As shown here, admixture in the Brazilian population provides the op-portunity to segregate the contribution of individual ances-try from genetic ancesances-try blocks at theVDRgene locus.
In conclusion, the results of this investigation provide a large map of haplotypes for the entire VDR gene and intragenic regions in a carefully sampled Brazilian popula-tion. Comparison with the HapMap data was essential for understanding the patterns of LD and haplotype variation among populations and for elucidating the effects of ad-mixture on this diversity. Our findings also support studies that involve tagSNP selection between different ethnic po-pulations (Nejentsevet al., 2004; Linset al., 2009). Genetic polymorphisms such as those observed here may partly ex-plain ethnic differences in vitamin D3 status and their rela-tionship to bone phenotype and hormonal homeostasis, particularly in elderly women, as well as the role of envi-ronmental factors such as diet, lifestyle and sun exposure (Uitterlindenet al., 2004; Dussoet al., 2005; Valdivielso and Fernandez, 2006).
Acknowledgments
This work was supported by Conselho Nacional de Desenvolvimento Científico e Tecnológico (CNPq) and Pró-Reitoria de Pós-Graduação e Pesquisa da Universidade Católica de Brasília (PRPGP-UCB). TCL was supported by a CAPES scholarship. We thank Luciana Rollemberg No-gueira and Meiriele Luisa da Silva (both undergraduate stu-dents) for their valuable help in this work during their academic training.
References
Barrett JC, Fry B, Maller J and Daly MJ (2005) Haploview: Anal-ysis and visualization of LD and haplotype maps. Bio-informatics 21:263-265.
Boldt AB, Culpi L, Tsuneto LT, de Souza IR, Kun JF and Petzl-Erler ML (2006) Diversity of the MBL2 gene in various Bra-zilian populations and the case of selection at the man-nose-binding lectin locus. Hum Immunol 67:722-734. Bonilla C, Parra EJ, Pfaff CL, Dios S, Marshall JA, Hamman RF,
Ferrell RE, Hoggart CL, McKeigue PM and Shriver MD (2004) Admixture in the Hispanics of the San Luis Valley, Colorado, and its implications for complex trait gene map-ping. Ann Hum Genet 68:139-153.
Callegari-Jacques SM, Grattapaglia D, Salzano FM, Salamoni SP, Crossetti SG, Ferreira ME and Hutz MH (2003) Historical genetics: Spatiotemporal analysis of the formation of the Brazilian population. Am J Hum Biol 15:824-834. Cardon LR and Palmer LJ (2003) Population stratification and
spurious allelic association. Lancet 361:598-604.
Crawford DC, Bhangale T, Li N, Hellenthal G, Rieder MJ, Ni-ckerson DA and Stephens M (2004) Evidence for substantial fine-scale variation in recombination rates across the human genome. Nat Genet 36:700-706.
de Brito Junior RB, Scarel-Caminaga RM, Trevilatto PC, de Souza AP and Barros SP (2004) Polymorphisms in the vita-min D receptor gene are associated with periodontal disease. J Periodontol 75:1090-1095.
Excoffier L, Laval G and Schneider S (2005) Arlequin v. 3.0: An integrated software package for population genetics data analysis. Evol Bioinform Online 1:47-50.
Fang Y, van Meurs JB, d’Alesio A, Jhamai M, Zhao H, Riva-deneira F, Hofman A, van Leeuwen JP, Jehan F, Pols HAet al.(2005) Promoter and 3’-untranslated-region haplotypes in the vitamin D receptor gene predispose to osteoporotic fracture: The Rotterdam Study. Am J Hum Genet 77:807-823.
Gabriel SB, Schaffner SF, Nguyen H, Moore JM, Roy J, Blu-menstiel B, Higgins J, DeFelice M, Lochner A, Faggart Met al.(2002) The structure of haplotype blocks in the human genome. Science 296:2225-2229.
Gentil P, de Lima Lins TC, Lima RM, de Abreu BS, Grattapaglia D, Bottaro M, de Oliveira RJ and Pereira RW (2009) Vita-min-D-receptor genotypes and bone-mineral density in post-menopausal women: Interaction with physical activity. J Aging Phys Act 17:31-45.
Gentil P, Lima RM, Lins TC, Abreu BS, Pereira RW and Oliveira RJ (2007) Physical activity, Cdx-2 genotype, and BMD. Int J Sports Med 28:1065-1069.
Gilsanz V, Skaggs DL, Kovanlikaya A, Sayre J, Loro ML, Kau-fman F and Korenman SG (1998) Differential effect of race on the axial and appendicular skeletons of children. J Clin Endocrinol Metab 83:1420-1427.
Goulart LR, Ferreira FR and Goulart IMB (2006) Interaction of TaqI polymorphism at exon 9 of the vitamin D receptor gene with the negative lepromin response may favor the occur-rence of leprosy. FEMS Immunol Med Microbiol 48:91-98. Hauache OM, Lazaretti-Castro M, Andreoni S, Gimeno SG,
Brandão C, Ramalho AC, Kasamatsu TS, Kunii I, Hayashi LF, Dib SAet al.(1998) Vitamin D receptor gene polymor-phism: Correlation with bone mineral density in a Brazilian population with insulin-dependent diabetes mellitus. Osteo-poros Int 8:204-210.
Jones Jr A, Shen W, St-Onge MP, Gallagher D, Heshka S, Wang Z and Heymsfield SB (2004) Body-composition differences between African American and white women: Relation to resting energy requirements. Am J Clin Nutr 79:780-786. Lazaretti-Castro M, Duarte-de-Oliveira MA, Russo EM and
Viei-ra JG (1997) Vitamin D receptor alleles and bone mineViei-ral density in a normal premenopausal Brazilian female popula-tion. Braz J Med Biol Res 30:929-932.
Lins TC, Nogueira LR, Lima RM, Gentil P, Oliveira RJ and Pereira RW (2007) A multiplex single-base extension proto-col for genotyping Cdx2, FokI, BsmI, ApaI, and TaqI poly-morphisms of the vitamin D receptor gene. Genet Mol Res 6:316-324.
Lins TC, Abreu BS and Pereira RW (2009) TagSNP transferabil-ity and relative loss of variabiltransferabil-ity prediction from HapMap to an admixed population. J Biomed Sci 16:73.
Lins TC, Vieira RG, Abreu BS, Grattapaglia D and Pereira RW (2010) Genetic composition of Brazilian population samples based on a set of twenty-eight ancestry informative SNPs. Am J Hum Biol 22:187-192.
Lips P (2007) Vitamin D status and nutrition in Europe and Asia. J Steroid Biochem Mol Biol 103:620-625.
Liu N, Sawyer SL, Mukherjee N, Pakstis AJ, Kidd JR, Kidd KK, Brookes AJ and Zhao H (2004) Haplotype block structures show significant variation among populations. Genet Epi-demiol 27:385-400.
Lohmueller KE, Wong LJ, Mauney MM, Jiang L, Felder RA, Jose PA and Williams SM (2006) Patterns of genetic variation in the hypertension candidate gene GRK4: Ethnic variation and haplotype structure. Ann Hum Genet 70:27-41. Maistro S, Snitcovsky I, Sarkis AS, da Silva IA and Brentani MM
(2004) Vitamin D receptor polymorphisms and prostate can-cer risk in Brazilian men. Int J Biol Markers 19:245-249. Marrero AR, Das Neves Leite FP, De Almeida Carvalho B, Peres
LM, Kommers TC, Da Cruz IM, Salzano FM, Ruiz-Linares A, Da Silva Junior WA and Bortolini MC (2005) Heteroge-neity of the genome ancestry of individuals classified as White in the state of Rio Grande do Sul, Brazil. Am J Hum Biol 17:496-506.
Moraes MO, Santos AR, Schonkeren JJ, Vanderborght PR, Ottenhoff TH, Moraes ME, Moraes JR, Sampaio EP, Sarno EN and Huizinga TW (2003) Interleukin-10 promoter haplotypes are differently distributed in the Brazilian versus the Dutch population. Immunogenetics 54:896-899. Moreno Lima R, de Abreu BS, Gentil P, de Lima Lins TC,
Grattapaglia D, Pereira RW and de Oliveira RJ (2007) Lack of association between vitamin D receptor genotypes and haplotypes with fat-free mass in postmenopausal Brazilian women. J Gerontol A Biol Sci Med Sci 62:966-972. Morrison NA, Qi JC, Tokita A, Kelly PJ, Crofts L, Nguyen TV,
Sambrook PN and Eisman JA (1994) Prediction of bone density from vitamin D receptor alleles. Nature 367:284-287.
Nakamoto K, Wang S, Jenison RD, Guo GL, Klaassen CD, Wan YJ and Zhong XB (2006) Linkage disequilibrium blocks, haplotype structure, and htSNPs of human CYP7A1 gene. BMC Genetics 7:29.
Nejentsev S, Godfrey L, Snook H, Rance H, Nutland S, Walker NM, Lam AC, Guja C, Ionescu-Tirgoviste C, Undlien DEet al.(2004) Comparative high-resolution analysis of linkage disequilibrium and tag single nucleotide polymorphisms be-tween populations in the vitamin D receptor gene. Hum Mol Genet 13:1633-1639.
Parra FC, Amado RC, Lambertucci JR, Rocha J, Antunes CM and Pena SD (2003) Color and genomic ancestry in Brazilians. Proc Natl Acad Sci USA 100:177-182.
Pritchard JK and Donnelly P (2001) Case-control studies of asso-ciation in structured or admixed populations. Theor Popul Biol 60:227-237.
Purcell S, Daly MJ and Sham PC (2007) WHAP: Haplotype-based association analysis. Bioinformatics 23:255-256. Rezende VB, Barbosa Jr F, Montenegro MF, Sandrim VC,
Gerlach RF and Tanus-Santos JE (2007) An interethnic comparison of the distribution of vitamin D receptor geno-types and haplogeno-types. Clin Chim Acta 384:155-159. Rosenberg NA and Nordborg M (2006) A general
population-genetic model for the production by population structure of spurious genotype-phenotype associations in discrete, ad-mixed or spatially distributed populations. Genetics 173:1665-1678.
Rosenberg NA, Pritchard JK, Weber JL, Cann HM, Kidd KK, Zhivotovsky LA and Feldman MW (2002) Genetic structure of human populations. Science 298:2381-2385.
Shaffer JR, Kammerer CM, Reich D, McDonald G, Patterson N, Goodpaster B, Bauer DC, Li J, Newman AB, Cauley JAet al.(2007) Genetic markers for ancestry are correlated with body composition traits in older African Americans. Osteo-poros Int 18:733-741.
Stephens M and Donnelly P (2003) A comparison of Bayesian methods for haplotype reconstruction from population geno-type data. Am J Hum Genet 73:1162-1169.
Suarez-Kurtz G, Perini JA, Bastos-Rodrigues L, Pena SD and Struchiner C (2007) Impact of population admixture on the distribution of the CYP3A5*3 polymorphism. Pharmaco-genomics 8:1299-1306.
Tang H, Coram M, Wang P, Zhu X and Risch N (2006) Recon-structing genetic ancestry blocks in admixed individuals. Am J Hum Genet 79:1-12.
Thakkinstian A, D’Este C and Attia J (2004) Haplotype analysis of VDR gene polymorphisms: A meta-analysis. Osteoporos Int 15:729-734.
Uitterlinden AG, Fang Y, Van Meurs JB, Pols HA and Van Leeuwen JP (2004) Genetics and biology of vitamin D re-ceptor polymorphisms. Gene 338:143-156.
Valdivielso JM and Fernandez E (2006) Vitamin D receptor polymorphisms and diseases. Clin Chim Acta 371:1-12. Ziv E and Burchard EG (2003) Human population structure and
genetic association studies. Pharmacogenomics 4:431-441.
Internet Resources
Primer3, http://frodo.wi.mit.edu/cgi-bin/primer3/primer3_www. cgi.
Associate Editor: Francisco Mauro Salzano