Association of serum lipid components and obesity with genetic ancestry
in an admixed population of elderly women
Tulio C. Lins
1,2, Alause S. Pires
3, Roberta S. Paula
3, Clayton F. Moraes
3,4, Rodrigo G. Vieira
1,
Lucy G. Vianna
3, Otávio T. Nobrega
3,4and Rinaldo W. Pereira
1,2,51
Programa de Pós-Graduação em Ciências Genômicas e Biotecnologia, Universidade Católica de Brasília,
Brasília, DF, Brazil.
2
Programa de Pós-Graduação em Patologia Molecular, Universidade de Brasília, Brasília, DF, Brazil.
3Programa de Pós-Graduação em Gerontologia, Universidade Católica de Brasília, Taguatinga, DF, Brazil.
4Programa de Pós-Graduação em Ciências Médicas, Universidade de Brasília, Brasília, DF, Brazil.
5Programa de Pós Graduação em Educação Física, Universidade Católica de Brasília, DF, Brazil.
Abstract
The prevalence of metabolic disorders varies among ethnic populations and these disorders represent a critical health care issue for elderly women. This study investigated the correlation between genetic ancestry and body com-position, metabolic traits and clinical status in a sample of elderly women. Clinical, nutritional and anthropometric data were collected from 176 volunteers. Genetic ancestry was estimated using 23 ancestry-informative markers. Pearsons correlation test was used to examine the relationship between continuous variables and an independent samplest-test was used to compare the means of continuous traits within categorical variables. Overall ancestry was a combination of European (57.49%), Native American (25.78%) and African (16.73%). Significant correlations were found for European ancestry with body mass index (r = 0.165; p = 0.037) and obesity (mean difference (MD) = 5.3%; p = 0.042). African ancestry showed a significant correlation with LDL (r = 0.159, p = 0.035), VLDL (r = -0.185; p = 0.014), hypertriglyceridemia (MD = 6.4%; p = 0.003) and hyperlipidemia (MD = 4.8%; p = 0.026). Amerindian an-cestry showed a significant correlation with triglyceride levels (r = 0.150; p = 0.047) and hypertriglyceridemia (MD = 4.5%; p = 0.039). These findings suggest that genetic admixture may influence the etiology of lipid metabo-lism-related diseases and obesity in elderly women.
Key words:dyslipidemia, genetic ancestry, lipid profile, obesity, postmenopausal women.
Received: January 26, 2012; Accepted: May 14, 2012.
Introduction
Obesity and lifestyle factors are the main contribu-tors to an increased risk of chronic non-communicable (non-transmissible) diseases, especially type 2 diabetes (T2D), lipid disorders, hypertension and other metabolic-related comorbidities (Sullivan et al., 2005). Many of these conditions may ultimately lead to cardiovascular disease. In the elderly, the risk of these disorders increases progressively with age (Wilson and Kannel, 2002; Ca-breraet al., 2007). As ageing progresses, overweight in-creases the risk for cardiovascular disease, mostly in women with high-risk LDL and HDL cholesterol profiles (Perissinottoet al., 2002). As the incidence of these dis-eases incrdis-eases worldwide there is an ever greater need to study the underlying genetic factors.
Recent findings from genome-wide association stud-ies have identified several loci associated with chronic met-abolic and cardiovascular diseases. However, the allelic architecture that can explain the heritability accounting for these complex phenotypes is not well understood. Informa-tive single nucleotide polymorphisms (SNPs) have been used to characterize the structure of the main continental populations, and the data indicate that ancestry estimates are the most important correction factors in genetic associa-tion studies, especially in studies using admixed popula-tions such as those of Latin America (Bonillaet al., 2004a; Tsaiet al., 2005; Gentilet al., 2007; Moreno Limaet al., 2007; Gentilet al., 2009; Laiet al., 2009; Ruiz-Narvaezet al., 2010). Consequently, the clinical application of genetic risk markers may not be straightforward across different ethnic populations and may be vulnerable to spurious allelic association in genetic studies (Tsaiet al., 2005).
The risk factors for metabolic syndrome and other phenotypes related to postmenopausal biology have dis-www.sbg.org.br
Send correspondence to Rinaldo Wellerson Pereira. SGAN 916, módulo B, bloco C, 2° andar, sala S-220, Asa Norte, 70790-160 Brasília, DF, Brazil. E-mail: [email protected].
tinct frequencies among populations of different ethnic backgrounds (Deurenberget al., 1998; Wulanet al., 2010). Genetic studies of admixed populations have substantially increased our knowledge of various genetic diseases through the detection and correction for population stratifi-cation (Bonillaet al., 2004a; Laiet al., 2009; Ruiz-Narvaez et al., 2010).
Most genetic studies of metabolic phenotypes have investigated adult and middle-aged populations, with stud-ies on elderly women being underrepresented. This group is more susceptible to chronic illnesses (Perissinotto et al., 2002; Wilson and Kannel, 2002; Cabreraet al., 2007) and is the fastest growing population group in developing coun-tries (Nobregaet al., 2009). The aim of the present study was therefore to investigate in a sample of elderly Brazilian women the contribution of admixture to several body com-position measurements, metabolic traits and parameters of clinical status based on their correlation with genetic ances-try, estimated by ancestry-informative markers.
Subjects and Methods
Subjects
This cross-sectional study was done using data ob-tained from apparently healthy female outpatients from the low-income suburbs of Brasília, Brazil, who volunteered to undergo health screenings and medical, nutritional and/or pharmacological interventions as part of a larger research project entitled the Elderly Health Promotion Project (EHPP). Additional characterization of the subjects is pre-sented elsewhere (Paulaet al., 2010; Nobregaet al., 2011). Project eligibility criteria consisted of being female, aged 60 years or older, completing the clinical course of assess-ment for hypertension, diabetes and dyslipidemia, and re-cording and informing their dietary profile. Since clinical data and laboratory results were obtained more than once, only the most recent data collected prior to any health inter-vention (especially blood pressure therapy) were consid-ered. All volunteers provided written informed consent and the research protocol was approved by the Catholic Univer-sity of Brasília Ethics Committee.
Data collection
Venous blood samples were collected in EDTA-con-taining tubes after 12 h overnight fast. Laboratory tests in-volved routine clinical analyses with reagents from Boeh-ringer-Mannheim (Germany). Low-density lipoprotein (LDL) was quantified by using Friedewald’s formula. Dur-ing consultation, blood pressure was measured after at least a 10 min rest in a sitting position. The blood pressure value of each subject was the mean of three physician-obtained measurements recorded 3 min apart. The body mass index (BMI = weight (kg)/height2 (m2)) of each patient was cal-culated by measuring body weight (kg) while the subject was wearing light clothing, and the subject’s height (m),
without shoes, was assessed to the nearest millimeter. Obe-sity was defined as a BMI = 30 kg/m2. Body composition (fat and fat-free soft tissue) was measured using a dual-energy X-ray absorptiometer (DXA; Lunar DPX-IQ model, software version 4.7e, Lunar Radiation Corp., Mad-ison, WI, USA) according to standard procedures provided by the manufacturer.
Each subject was classified based on the consensus of Brazilian Medical Societies, particularly the 5th Brazilian Guidelines in Arterial Hypertension (Diretrizes, 2007) and the 4th Brazilian Guidelines for Dyslipidemia and Athero-sclerosis Prevention (Spositoet al., 2007). Briefly, hyperten-sion was defined as a systolic blood pressure³130 mm Hg or a diastolic blood pressure ³85 mm Hg, or the current use of antihypertensive medication. Type 2 diabetes mellitus (DM) was characterized by fasting blood glucose ³ 126 mg/dL or the current use of insulin or oral anti-diabetic drugs. Glucose intolerance included DM cases and any cases with a fasting blood glucose³110 mg/dL. Hypertriglyce-ridemia was defined as triglyceride levels³150 mg/dL, and hypercholesterolemia was defined as total cholesterol ³ 200 mg/dL or LDL-cholesterol³130 mg/dL. The current use of any anti-lipemic medication was considered to repre-sent the presence of both entities. Hyperlipidemia was de-fined as isolated or combined hypertriglyceridemia and hy-percholesterolemia, whereas dyslipidemia encompassed all cases of hyperlipidemia with or without a HDL-cholesterol < 50 mg/dL.
The study design included an estimation of fat con-sumption based on each subject’s natural,ad libitumfood intake. Dietary analysis was performed based on an average 3-day food intake (two weekdays and one weekend day) re-corded by the patient at home. Clinical dietitians and assis-tants instructed each patient on how to record food intake by defining the size and number of each serving. The forms were returned at a clinical interview during which the amounts and qualities of food were checked for completion and missing data were collected. Diet composition was cal-culated using Diet-Pro® software, version 4.0 (A.S. Sis-temas, Viçosa, MG, Brazil). Software was set for all food tables and completed with Philippi’s composition table for local food (Philippi, 2002). Total lipid was expressed as the percentage of total energy. To construct categorical vari-ables of fat consumption, intakes were classified into two groups: those with a normal lipid diet (10%-35%) and those with a hyperlipid diet (> 35%).
Marker selection and genotyping
cross-sectional studies to correct for population structure (Gentilet al., 2007, 2009; Moreno Limaet al., 2007) and the informativeness of these SNPs for a three hybrid popu-lation panel has been evaluated in a Brazilian popupopu-lation (Linset al., 2010). The AIMs were genotyped using a mod-ified, single-base extension protocol, as previously de-scribed (Lins et al., 2007). Briefly, genomic DNA was extracted using a modified salting-out method and ampli-fied by the polymerase chain reaction (PCR). Products were treated with Exo I/SAP enzymes and genotyping was done by single-base extension using the SNaPshot Multi-plex System (Applied Biosystems, Foster City, CA), fol-lowed by capillary electrophoresis on an ABI Prism 3130XL genetic analyzer. The data were analyzed using GeneMapper software (Applied Biosystems).
Statistical analysis
Individual genetic ancestry was estimated using an al-gorithm based on maximum likelihood estimation (MLE) (Tsaiet al., 2005) that uses allele frequencies from the pa-rental populations (European – EUR, African – AFR and Native American – AMR). Allelic frequencies were re-trieved via genomic mapping in multiple panels of unre-lated ethnic samples (Fernandezet al., 2003; Bonillaet al., 2004b; Shriveret al., 2005).
The Kolmogorov-Smirnov test was used to check for normal distribution and Pearsons correlation test was applied to each continuous variable: age, weight, height, body mass index (BMI), fat mass (FM), fat-free mass (FFM), triglycerides (TG), total lipids (TL), total low-density lipoprotein (LDL), very-low low-density lipoprotein (VLDL), high-density lipoprotein (HDL), fasting plasma glucose (GLU), systolic blood pressure (SBP), diastolic blood pressure (DBP), dietary intake of total lipids (LIP), European ancestry proportion (EUR), African ancestry proportion (AFR) and Native American, or Amerindian, ancestry proportion (AMR). Cases were labeled as posi-tive (affected) or negaposi-tive (unaffected) with regard to met-abolic and clinical features, including medication status determined from medical records, to assemble categorical variables for each metabolic disorder or trait (obesity, hypertriglyceridemia, hypercholesterolemia, hyperli-pidemia, dyslihyperli-pidemia, glucose intolerance, type 2 diabe-tes, hypertension and normolipid diet). An independent samplest-test was used to compare the means of continu-ous traits across carriers and non-carriers of the aforemen-tioned metabolic disorders. Linear regression analysis was used to assess possible covariance for ancestry esti-mates and the variable rendered as interferential was later included in a covariance analysis with Bonferroni adjust-ments to correct for its effects. A value of p < 0.05 was considered statistically significant for all tests. The soft-ware SPSS, version 13 (SPSS Inc., Chicago, IL) was used for statistical calculations.
Results
The Kolmogorov-Smirnov test showed that the data for all continuous traits were normally distributed. The quantitative and categorical traits of the subjects are sum-marized in Table 1 and Table 2, respectively.
The allelic frequencies of the AIMs in the sample population differed from those reported for reference an-cestral populations, thereby indicating the admixture
struc-Table 1- Continuous variables in the studied population (n = 176).
Variable Mean SD Min Max
Age (years) 68.31 5.77 58.00 83.00
Weight (kg) 63.21 9.58 32.00 89.00 Height (m) 1.52 0.06 1.38 1.72 Body mass index (kg/m2) 27.28 4.04 14.61 37.69
Fat mass (%) 37.28 6.84 8.05 57.74 Fat free mass (%) 58.88 6.41 39.80 87.00
Triglycerides (mg/dL) 157.24 97.11 38.00 967.00 Total lipids (mg/dL) 744.73 143.26 218.00 1117.00 Total cholesterol (mg/dL) 233.24 43.07 126.00 343.00
LDL (mg/dL) 139.93 39.58 43.00 250.00 VLDL (mg/dL) 29.84 13.12 7.60 76.00
HDL (mg/dL) 61.65 10.07 35.00 92.00 Fasting glucose (mg/dL) 104.33 29.67 70.00 324.00 SBP (mmHg) 136.42 26.54 70.00 210.00
DBP (mmHg) 81.16 15.74 40.00 120.00 LIP (%) 34.31 5.15 19.09 65.52
EUR (%) 57.49 17.21 2.00 100.00 AFR (%) 16.73 14.73 0.00 80.00 AMR (%) 25.78 14.50 0.00 65.00
AFR = African ancestry; AMR = Amerindian ancestry; DBP = diastolic blood pressure; EUR = European ancestry; HDL = high density lipopro-tein; LDL = low density lipoprolipopro-tein; LIP = lipid dietary intake; Max = maximum; Min = minimum; SD = standard deviation; SBP = sys-tolic blood pressure; VLDL = very low density lipoprotein.
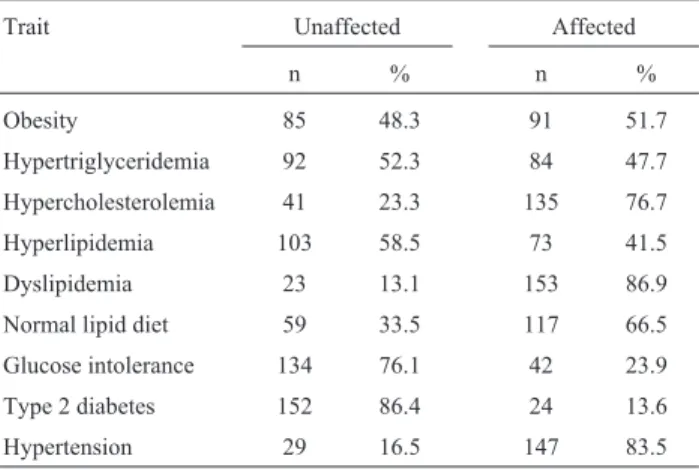
Table 2- Categorical variables of the clinical and nutritional assessments in the sampled population.
Trait Unaffected Affected
n % n %
Obesity 85 48.3 91 51.7
Hypertriglyceridemia 92 52.3 84 47.7 Hypercholesterolemia 41 23.3 135 76.7 Hyperlipidemia 103 58.5 73 41.5
Dyslipidemia 23 13.1 153 86.9 Normal lipid diet 59 33.5 117 66.5
ture (Table 3). The distribution of the individual ancestry estimates (IAE) comprised a wide range of ancestry pro-portions in a diverse three-hybrid pattern of variation (Fig-ure 1). The sample population displayed a genetic constitu-tion with a marked contribuconstitu-tion from European ancestry (57.49%) followed by Native American (25.78%) and Afri-can (16.73%) ancestries. Fewer individuals displayed a di-hybrid ancestral arrangement,e.g., AFR or EUR-AMR.
When ancestry proportions were used as continuous traits, significant results were found for the European an-cestry proportion, which was positively correlated with weight (r = 0.157, p = 0.037) and BMI (r = 0.165, p = 0.028), and negatively correlated with DBP (r = -0.187, p = 0.013). For the African ancestry proportion, there was a positive significant correlation with LDL (r = 0.159, p = 0.035) and a negative correlation with VLDL (r = -0.185; p = 0.014). For the Native American ancestry
Table 3- Ancestry informative markers with chromosomal positions and allele frequencies in Europeans (EUR), Africans (AFR), Amerindians (AMR) and the sampled population.
Locus Position Allele EUR AFR AMR Sample Reference
FY-null (rs2814778) 1q23 C 0.006 0.983 0.018 0.209 Smithet al.(2004) rs1129038 15q13 C 0.224 0.996 0.983 0.783 Smithet al.(2004)
rs3796384 3p14 C 0.154 0.783 0.875 0.626 Smithet al.(2004) rs1480642 6q23 C 0.993 0.121 0.621 0.791 Smithet al.(2004) rs1871534 8q24.3 C 0.981 0.071 1.000 1.000 Smithet al.(2004)
rs267071 5q22 C 0.654 0.088 1.000 0.421 Smithet al.(2004) rs4280128 13q22 A 0.357 0.941 0.034 0.494 Smithet al.(2004)
rs6034866 20p12 A 0.083 0.954 0.143 0.100 Smithet al.(2004) rs7349 10p11.2 A 0.067 0.969 0.000 0.221 Smithet al.(2004) rs803733 9q33 C 0.880 0.013 0.410 0.636 Smithet al.(2004)
rs1426654 15q21 C 0.013 0.967 0.931 0.291 Smithet al.(2004) TSC1102055 (rs2065160) 1q32 C 0.088 0.487 0.875 0.231 Smithet al.(2004)
rs730570 14q32 A 0.896 0.197 0.054 0.646 Smithet al.(2004) rs1240709 1p36.3 A 0.766 0.050 0.103 0.526 Smithet al.(2004) rs2278354 5p15.2 T 0.120 0.703 0.839 0.713 Smithet al.(2004)
rs803733 9q33 C 0.880 0.013 0.410 0.636 Smithet al.(2004) rs1980888 9q22 T 0.100 0.143 0.950 0.204 Shriveret al.(2005)
rs1415878 Xq26 A 0.917 1.000 0.025 0.708 Shriveret al.(2005) CYP3A4 (rs2740574) 7q22 G 0.040 0.800 0.040 0.211 Fernandezet al.(2003) AT3 (rs3138521) 1q25 Insertion 0.282 0.858 0.061 0.429 Bonillaet al.(2004a)
WI-11153 (rs17203) 3p12.1 G 0.171 0.785 0.805 0.621 Bonillaet al.(2004a) MID-93 (rs16383) 22q13.2 A 0.220 0.739 0.895 0.391 Bonillaet al.(2004a)
RB (rs2252544) 13q14 C 0.320 0.930 0.180 0.253 Bonillaet al.(2004a)
proportion, there was a positive correlation only with tri-glyceride levels (r = 0.150; p = 0.047). The correlation be-tween variants other than ancestry also yielded significant associations and are shown in Table S1 (Supplementary Material).
Regarding the affected status, the mean difference (MD) of the African ancestry proportion was significantly different for hypertriglyceridemia (MD= 6.4%, p = 0.004) and hyperlipidemia (MD= 4.8% p = 0.026) (Figure 2). The contribution of European ancestry was significantly differ-ent for obesity (MD = 5.3%, p = 0.042) and the Native American ancestry for hypertriglyceridemia (MD= 4.5%, p = 0.039). The mean differences for traits other than those previously described also yielded significant associations and are shown in Table S2 (Supplementary Material). Given that lipid- and obesity-related variables yielded a significant association with ancestry, linear regression analysis used to select these phenotypes as possible covariates for African, Native American and European as-sociations. These analyses revealed that SBP and DBP could be included as covariates for the African ancestry proportion (SBPbcoefficient = -0.319, p = 0.014 and DBP bcoefficient = 0.389, p = 0.003) and for the European an-cestry proportion (SBPbcoefficient = 0.256, p = 0.042 and
DBPbcoefficient = -0.404, p = 0.002). No potential predic-tors were identified for the Native American ancestry.
There was no divergence in the mean difference of the African ancestry proportion in the category of hyper-triglyceridemia for the corrected model with SBP and DBP as covariates. For hyperlipidemia, an increase of 0.1% oc-curred in the corrected model for the African ancestry pro-portion (MDfrom 4.8% to 4.9%, p = 0.034). Using blood pressures as covariates for obesity status, the mean differ-ence of the European ancestry levels among groups in-creased from 5.3% (p = 0.042) to 6.5% (p = 0.011). No other association was found for covariate-corrected mod-els.
Discussion
The present study identified significant correlations between genetic ancestry and lipid profiles and a fluctua-tion in the metabolic parameters in a heterogeneous and ad-mixed group of elderly Brazilian women. Interestingly, population ancestry estimates were relatively higher for the Native American and slightly lower for the African and Eu-ropean ancestry proportions than those in the general Bra-zilian population (Lins et al., 2010) or in other elderly samples (Gentilet al., 2007, 2009; Moreno Lima et al.,
2007), however, no significant differences in standard devi-ations or variance were found between the present sample population and other populations from the same region (data not shown) (Linset al., 2010, 2011). Although self-reported ancestry is socially correlated with income in most parts of Brazil, income and education status were not as-sessed in the present study. Notwithstanding, total lipid in-take was considered as a covariate that correlates with increased income in Brazilian women (Bonomo et al., 2003) and may represent an additional risk for cholesterol and lipid disorders.
Genetic and environmental factors, such as age, diet and lifestyle are known to contribute to phenotypic traits such as those evaluated in this study. Genetic ancestry has an inherent influence on the etiology of lipid and metabo-lism-related diseases, as demonstrated in cases such as Af-rican ancestry associations with triglyceride, LDL-cholesterol and HDL-LDL-cholesterol levels in admixed Afri-can-Americans (Deoet al., 2009), or an inverse association in individuals with European ancestry (Basuet al., 2009). In the present study, increased African ancestry was signifi-cantly associated with decreased levels of triglyceride-rich serum components (TG and VLDL) and augmented levels of cholesterol-rich lipoproteins (LDL), as has been reported by others (Deoet al., 2009). No correlation was found for HDL levels, as previously reported (Basuet al., 2009; Deo et al., 2009). Although the effect of European ancestry ob-served here was modest, it was nevertheless significant; based on this finding, we suggest that European ancestry is an additional risk factor and that higher levels of African ancestry account for a more beneficial lipid profile in el-derly women with admixed ethnicity.
The levels of LDL expression in African-American women are often described as being higher than those in European-American women. Conversely, increments of triglycerides in lean African-Americans are described as lower than in lean European-American women (Boweret al., 2002). Here, African ancestry exerted a protective ef-fect against hyperlipidemia and hypertriglyceridemia since it was correlated with higher levels of LDL and lower levels of VLDL. Therefore, in this sample population, African an-cestry influenced lipid profiles, but, in contrast to previous studies (Fernandezet al., 2003; Laiet al., 2009), was not correlated to obesity, diabetes or hypertension. This lack of association may reflect a difference in genetic stratification (Wulanet al., 2010), and the levels and range of admixture (Linset al., 2011) may confound results because of pro-nounced genetic effects on phenotype expression. For this reason, association studies should not be labeled as analyz-ing deterministic, causal relationships, but rather as an elucidative contribution to the pathophysiology of these complex phenotypes.
The prevalence of obesity varies significantly among ethnic groups, especially African- and European-Ameri-cans (Deurenberget al., 1998). In addition, some studies
have demonstrated associations between European ancestry and body composition traits in admixed popula-tions, especially bone mineral density (BMD) (Bonillaet
al., 2004b) and BMI (Basuet al., 2009). Others have
re-ported an association between African ancestry and BMI, FM, FFM and BMD in African-American women (Fernandezet al., 2003). In the present admixed cohort, Eu-ropean ancestry was significantly correlated with BMI and with obesity, but in a previous study (Gentilet al., 2009) this association was not detected. Fat mass and fat-free mass were not correlated with any ancestry estimate, nei-ther in the present nor in a previous study of elderly Brazil-ian women (Moreno Limaet al., 2007). Such associations are particularly important for understanding the role of ge-netic ancestry in metabolic-related traits and how interact-ing variables modulate these phenotypes.
Although lipid intake had no effect on overall traits, we do not advocate excluding this variable in future assess-ments in view of possible environmental influences on the risk of obesity and metabolic syndrome (Sichieri, 2002) or heart disease (Nobrega et al., 2011). Notably, Brazilian women display significant differences in their pattern of lipid macronutrient consumption, with a trend toward in-creased consumption with inin-creased income (Bonomo et al., 2003) and a suggestive risk for heart disease (Nobrega et al., 2011). With regard to ethnicity, in a study of the di-etary pattern of a Brazilian-urban population, a correlation was identified between categories of skin color (defined by the interviewer) and dietary patterns, in which lighter skin was associated with a more varied diet (Sichieri et al., 2003). However, this study was not income-adjusted, and categorical ethnicity groups might comprise a wide degree of admixture (Linset al., 2011). Consequently, other fac-tors relating ancestry and dietary patterns to obesity and comorbidities should be investigated.
Other associations found in this study are of interest to the clinical status of elderly women. However, they are merely well-established descriptions of metabolic health risk conditions, such as the association between lipid pro-file, diabetes and/or hypertension, but do not represent a novel addition to our current knowledge. The supplemental tables, available as part of the online article, contain all the association tests and their significance. Although a body of evidence advocates that the overall ancestry background in-fluences the lipid profile of individuals, the novelty of the present paper is the approach used to address this matter. The Brazilian population displays an extensive degree of admixture that it renders suitable for estimating a variety of ancestries under standardized socio-economic conditions (Linset al., 2011).
re-quirement for genetic studies. This scenario might help identify the relationship between ancestry backgrounds and specific phenotypes. The present study may also have been subject to other unmeasured confounders, such as the im-portant contribution of individual interactions with envi-ronmental factors. Lifestyle behaviors in the elderly popu-lation that may be used as a covariant, such as smoking, alcohol intake, stress or depression, were not assessed here. Since this study used a cohort of elderly women, these re-sults cannot be extended to another population strata or gender.
In conclusion, our results support the role of genetic ancestry in chronic non-communicable diseases prevalent in elderly women and suggest that caution should be taken when performing gene-based association studies in ad-mixed populations because of the genetic heterogeneity. Our results raise the possibility of undertaking association studies based on admixture linkage disequilibrium; such studies may identify genomic loci that could explain corre-lations between lipid metabolic traits and ancestry.
Acknowledgments
The authors thank Cristiane Urcina Lima, Fernanda Colares-Bento and Sarah Peres da Silveira for gathering the nutritional data and for ensuring adherence to the food reg-istration procedure. This research was supported by CNPq (grants 484318/2006-3 and 402699/2007-6) and FAPDF (grants 193.000.309/2007 and 193.000.449/2008). R.S. Paula was supported by a studentship from CAPES (PROSUP), A.S. Pires was supported by a student scholar-ship from CNPq (grant 550315/2008-0) and R.W. Pereira was supported by a research fellowship from CNPq.
References
Basu A, Tang H, Arnett D, Gu CC, Mosley T, Kardia S, Luke A, Tayo B, Cooper R, Zhu X,et al.(2009) Admixture mapping of quantitative trait loci for BMI in African Americans: Evi-dence for loci on chromosomes 3q, 5q, and 15q. Obesity 17:1226-1231.
Bonilla C, Shriver MD, Parra EJ, Jones A and Fernandez JR (2004a) Ancestral proportions and their association with skin pigmentation and bone mineral density in Puerto Rican women from New York city. Hum Genet 115:57-68. Bonilla C, Parra EJ, Pfaff CL, Dios S, Marshall JA, Hamman RF,
Ferrell RE, Hoggart CL, McKeigue PM and Shriver MD (2004b) Admixture in the Hispanics of the San Luis Valley, Colorado, and its implications for complex trait gene map-ping. Ann Hum Genet 68:139-153.
Bonomo E, Caiaffa WT, Cesar CC, Lopes AC and Lima-Costa MF (2003) Food intake according to socioeconomic and de-mographic profile: The Bambui Project. Cad Saude Publica 19:1461-1471 (in Portuguese, Abstract in English). Bower JF, Deshaies Y, Pfeifer M, Tanenberg RJ and Barakat HA
(2002) Ethnic differences in postprandial triglyceride re-sponse to a fatty meal and lipoprotein lipase in lean and
obese African American and Caucasian women. Metabo-lism 51:211-217.
Cabrera MA, Gebara OC, Diament J, Nussbacher A, Rosano G and Wajngarten M (2007) Metabolic syndrome, abdominal obesity, and cardiovascular risk in elderly women. Int J Cardiol 114:224-229.
Deo RC, Reich D, Tandon A, Akylbekova E, Patterson N, Walis-zewska A, Kathiresan S, Sarpong D, Taylor Jr HA and Wil-son JG (2009) Genetic differences between the determinants of lipid profile phenotypes in African and European Ameri-cans: The Jackson Heart Study. PLoS Genetics 5:e1000342. Deurenberg P, Yap M and van Staveren WA (1998) Body mass
index and percent body fat: A meta analysis among different ethnic groups. Int J Obes Relat Metab Disord 22:1164-1171. Diretrizes (2007) V Brazilian guidelines in arterial hypertension.
Arq Bras Cardiol 89:e24-79 (in Portuguese).
Fernandez JR, Shriver MD, Beasley TM, Rafla-Demetrious N, Parra E, Albu J, Nicklas B, Ryan AS, McKeigue PM, Hog-gart CL,et al.(2003) Association of African genetic admix-ture with resting metabolic rate and obesity among women. Obes Res 11:904-911.
Gentil P, Lima RM, Lins TC, Abreu BS, Pereira RW and Oliveira RJ (2007) Physical activity, Cdx-2 genotype, and BMD. Int J Sports Med 28:1065-1069.
Gentil P, de Lima Lins TC, Lima RM, de Abreu BS, Grattapaglia D, Bottaro M, de Oliveira RJ and Pereira RW (2009) Vita-min-D-receptor genotypes and bone-mineral density in post-menopausal women: Interaction with physical activity. J Aging Phys Act 17:31-45.
Lai CQ, Tucker KL, Choudhry S, Parnell LD, Mattei J, Gar-cia-Bailo B, Beckman K, Burchard EG and Ordovas JM (2009) Population admixture associated with disease preva-lence in the Boston Puerto Rican health study. Hum Genet 125:199-209.
Lins TC, Nogueira LR, Lima RM, Gentil P, Oliveira RJ and Pereira RW (2007) A multiplex single-base extension proto-col for genotyping Cdx2, FokI, BsmI, ApaI, and TaqI poly-morphisms of the vitamin D receptor gene. Genet Mol Res 6:216-224.
Lins TC, Vieira RG, Abreu BS, Grattapaglia D and Pereira RW (2010) Genetic composition of Brazilian population samples based on a set of twenty-eight ancestry informative SNPs. Am J Hum Biol 22:187-192.
Lins TC, Vieira RG, Abreu BS, Gentil P, Moreno-Lima R, Oli-veira RJ and Pereira RW (2011) Genetic heterogeneity of self-reported ancestry groups in an admixed Brazilian popu-lation. J Epidemiol 21:240-245.
Moreno Lima R, Silva de Abreu B, Gentil P, Cesar de Lima Lins T, Grattapaglia D, Pereira RW and Jaco de Oliveira R (2007) Lack of association between vitamin D receptor genotypes and haplotypes with fat-free mass in postmenopausal Brazil-ian women. J Gerontol A Biol Sci Med Sci 62:966-972. Nobrega OT, Faleiros VP and Telles JL (2009) Gerontology in the
developing Brazil: Achievements and challenges in public policies. Geriatr Gerontol Int 9:135-139.
Nobrega OT, Paula RS, Silveira SR, Pires AS, Toledo JO, Moraes CF and Cordova C (2011) Usual dietary intake and cardio-vascular risk factors in older Brazilian women. Aging Clin Exp Res DOI: 10.3275/7674.
Dietary fat and apolipoprotein genotypes modulate plasma lipoprotein levels in Brazilian elderly women. Mol Cell Biochem 337:307-315.
Perissinotto E, Pisent C, Sergi G and Grigoletto F (2002) Anthro-pometric measurements in the elderly: Age and gender dif-ferences. Br J Nutr 87:177-186.
Philippi ST (2002) Tabela de Composição de Alimentos: Suporte para Decisão Nutricional. Coronário, São Paulo, 135 pp. Ruiz-Narvaez EA, Bare L, Arellano A, Catanese J and Campos H
(2010) West African and Amerindian ancestry and risk of myocardial infarction and metabolic syndrome in the Cen-tral Valley population of Costa Rica. Hum Genet 127:629-638.
Shriver MD, Mei R, Parra EJ, Sonpar V, Halder I, Tishkoff SA, Schurr TG, Zhadanov SI, Osipova LP, Brutsaert TD,et al.
(2005) Large-scale SNP analysis reveals clustered and con-tinuous patterns of human genetic variation. Hum Genomics 2:81-89.
Sichieri R (2002) Dietary patterns and their associations with obe-sity in the Brazilian city of Rio de Janeiro. Obes Res 10:42-48.
Sichieri R, Castro JF and Moura AS (2003) Factors associated with dietary patterns in the urban Brazilian population. Cad Saude Publica 19(Suppl 1):S47-53 (in Portuguese, Abstract in English).
Smith MW, Patterson N, Lautenberger JA, Truelove AL, McDon-ald GJ, Waliszewska A, Kessing BD, Malasky MJ, Scafe C, Le E,et al.(2004) A high-density admixture map for disease gene discovery in African Americans. Am J Hum Genet 74:1001-1013.
Sposito AC, Caramelli B, Fonseca FA, Bertolami MC, Afiune Neto A, Souza AD, Lottenberg AM, Chacra AP, Faludi AA, Loures-Vale AA,et al.(2007) IV Brazilian Guideline for Dyslipidemia and Atherosclerosis Prevention: Department
of Atherosclerosis of the Brazilian Society of Cardiology. Arq Bras Cardiol 88(Suppl 1):2-19 (in Portuguese, Abstract in English).
Sullivan PW, Morrato EH, Ghushchyan V, Wyatt HR and Hill JO (2005) Obesity, inactivity, and the prevalence of diabetes and diabetes-related cardiovascular comorbidities in the U.S., 2000-2002. Diabetes Care 28:1599-1603.
Tsai H-J, Choudhry S, Naqvi M, Rodriguez-Cintron W, Burchard E and Ziv E (2005) Comparison of three methods to estimate genetic ancestry and control for stratification in genetic as-sociation studies among admixed populations. Hum Genet 118:424-433.
Wilson PW and Kannel WB (2002) Obesity, diabetes, and risk of cardiovascular disease in the elderly. Am J Geriatr Cardiol 11:119-125.
Wulan SN, Westerterp KR and Plasqui G (2010) Ethnic differ-ences in body composition and the associated metabolic pro-file: A comparative study between Asians and Caucasians. Maturitas 65:315-319.
Supplementary Material
The following online material is available for this ar-ticle:
- Table S1 - Pearson correlation for continuous traits. - Table S2 - Independent-samplest-test comparing the means of continuous traits among categorical groups.
This material is available as part of the online article from http://www.scielo.br/gmb.
Associate Editor: Carlos F.M. Menck
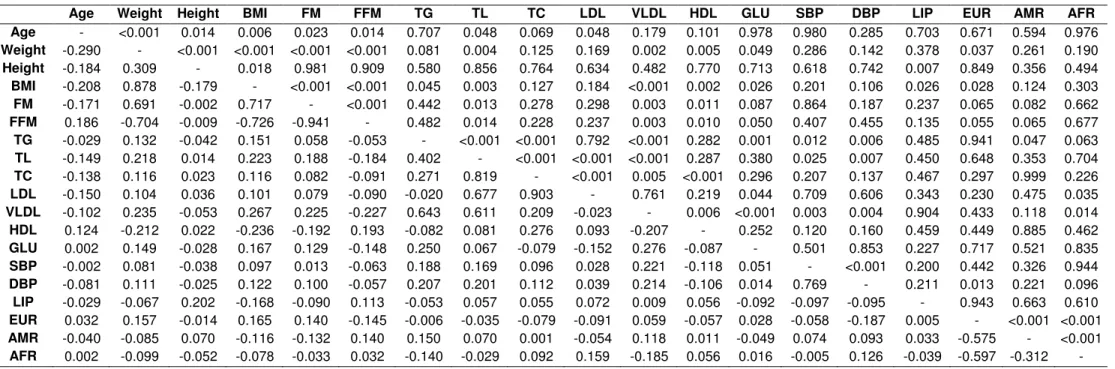
Table S1: Pearson Correlation of continuous traits. Correlation coefficient (r) below and p-values above the diagonal. Correlation significant at a 95% confidence level.
Age Weight Height BMI FM FFM TG TL TC LDL VLDL HDL GLU SBP DBP LIP EUR AMR AFR
Age - <0.001 0.014 0.006 0.023 0.014 0.707 0.048 0.069 0.048 0.179 0.101 0.978 0.980 0.285 0.703 0.671 0.594 0.976
Weight -0.290 - <0.001 <0.001 <0.001 <0.001 0.081 0.004 0.125 0.169 0.002 0.005 0.049 0.286 0.142 0.378 0.037 0.261 0.190
Height -0.184 0.309 - 0.018 0.981 0.909 0.580 0.856 0.764 0.634 0.482 0.770 0.713 0.618 0.742 0.007 0.849 0.356 0.494
BMI -0.208 0.878 -0.179 - <0.001 <0.001 0.045 0.003 0.127 0.184 <0.001 0.002 0.026 0.201 0.106 0.026 0.028 0.124 0.303
FM -0.171 0.691 -0.002 0.717 - <0.001 0.442 0.013 0.278 0.298 0.003 0.011 0.087 0.864 0.187 0.237 0.065 0.082 0.662
FFM 0.186 -0.704 -0.009 -0.726 -0.941 - 0.482 0.014 0.228 0.237 0.003 0.010 0.050 0.407 0.455 0.135 0.055 0.065 0.677
TG -0.029 0.132 -0.042 0.151 0.058 -0.053 - <0.001 <0.001 0.792 <0.001 0.282 0.001 0.012 0.006 0.485 0.941 0.047 0.063 TL -0.149 0.218 0.014 0.223 0.188 -0.184 0.402 - <0.001 <0.001 <0.001 0.287 0.380 0.025 0.007 0.450 0.648 0.353 0.704 TC -0.138 0.116 0.023 0.116 0.082 -0.091 0.271 0.819 - <0.001 0.005 <0.001 0.296 0.207 0.137 0.467 0.297 0.999 0.226
LDL -0.150 0.104 0.036 0.101 0.079 -0.090 -0.020 0.677 0.903 - 0.761 0.219 0.044 0.709 0.606 0.343 0.230 0.475 0.035
VLDL -0.102 0.235 -0.053 0.267 0.225 -0.227 0.643 0.611 0.209 -0.023 - 0.006 <0.001 0.003 0.004 0.904 0.433 0.118 0.014
HDL 0.124 -0.212 0.022 -0.236 -0.192 0.193 -0.082 0.081 0.276 0.093 -0.207 - 0.252 0.120 0.160 0.459 0.449 0.885 0.462
GLU 0.002 0.149 -0.028 0.167 0.129 -0.148 0.250 0.067 -0.079 -0.152 0.276 -0.087 - 0.501 0.853 0.227 0.717 0.521 0.835
SBP -0.002 0.081 -0.038 0.097 0.013 -0.063 0.188 0.169 0.096 0.028 0.221 -0.118 0.051 - <0.001 0.200 0.442 0.326 0.944
DBP -0.081 0.111 -0.025 0.122 0.100 -0.057 0.207 0.201 0.112 0.039 0.214 -0.106 0.014 0.769 - 0.211 0.013 0.221 0.096
LIP -0.029 -0.067 0.202 -0.168 -0.090 0.113 -0.053 0.057 0.055 0.072 0.009 0.056 -0.092 -0.097 -0.095 - 0.943 0.663 0.610
EUR 0.032 0.157 -0.014 0.165 0.140 -0.145 -0.006 -0.035 -0.079 -0.091 0.059 -0.057 0.028 -0.058 -0.187 0.005 - <0.001 <0.001 AMR -0.040 -0.085 0.070 -0.116 -0.132 0.140 0.150 0.070 0.001 -0.054 0.118 0.011 -0.049 0.074 0.093 0.033 -0.575 - <0.001
Obesity Hypertrygliceridemia Hypercholesterolemia Hyperlipidemia Dyslipidemia
Trait Group N Mean p N Mean p N Mean p N Mean p N Mean p
Age (years) Aff. 91 67.59 0.091 84 67.90 0.380 135 67.99 0.164 73 67.71 0.256 153 68.05 0.122
Unaff. 85 69.07 92 68.67 41 69.34 103 68.73 23 70.00
Weight (kg) Aff. 91 69.02 <0.001 84 64.93 0.022 135 64.23 0.030 73 65.23 0.016 153 64.03 0.036
Unaff. 85 57.00 * 92 61.65 * 41 59.87 * 103 61.79 * 23 57.78 *
Height (cm) Aff. 91 151.05 0.004 84 151.54 0.108 135 152.53 0.224 73 151.70 0.260 153 152.25 0.983
Unaff. 85 153.52 * 92 152.89 41 151.32 103 152.63 23 152.22
BMI (kg/m²) Aff. 91 30.22 <0.001 84 28.28 0.001 135 27.64 0.052 73 28.37 0.002 153 27.65 0.017
Unaff. 85 24.13 * 92 26.37 * 41 26.08 103 26.51 * 23 24.83 *
FM (%) Aff. 91 40.94 <0.001 84 38.18 0.088 135 37.64 0.287 73 38.39 0.056 153 37.63 0.241
Unaff. 85 33.35 * 92 36.45 41 36.07 103 36.49 23 34.91
FFM (%) Aff. 91 55.55 <0.001 84 57.99 0.073 135 58.55 0.297 73 57.81 0.050 153 58.58 0.285
Unaff. 85 62.44 * 92 59.70 41 59.96 103 59.64 * 23 60.91
Triglycerides (mg/dL) Aff. 91 167.49 0.152 84 217.64 <0.001 135 166.82 0.002 73 219.26 <0.001 153 166.98 <0.001
Unaff. 85 146.26 92 102.09 * 41 125.68 * 103 113.28 * 23 92.43 *
Total lipids (mg/dL) Aff. 91 756.23 0.272 84 804.80 <0.001 135 791.69 <0.001 73 832.06 <0.001 153 769.94 <0.001
Unaff. 85 732.43 92 689.89 * 41 590.12 * 103 682.84 * 23 577.04 *
Total cholesterol (mg/dL) Aff. 91 233.15 0.977 84 238.01 0.160 135 248.67 <0.001 73 247.67 <0.001 153 240.24 <0.001
Unaff. 85 233.34 92 228.89 41 182.46 * 103 223.02 * 23 186.74 *
LDL (mg/dL) Aff. 91 140.31 0.897 84 136.57 0.280 135 152.65 <0.001 73 145.75 0.082 153 145.27 <0.001
Unaff. 85 139.53 92 143.00 41 98.05 * 103 135.81 23 104.43 *
VLDL (mg/dL) Aff. 91 31.92 0.029 84 39.86 <0.001 135 31.32 0.004 73 39.65 <0.001 153 31.58 <0.001
Unaff. 85 27.61 * 92 20.69 * 41 24.95 * 103 22.89 * 23 18.30 *
HDL (mg/dL) Aff. 91 59.52 0.003 84 60.04 0.043 135 62.29 0.099 73 60.02 0.076 153 61.50 0.498
Unaff. 85 63.93 * 92 63.12 * 41 59.53 103 62.81 23 62.65
Fasting glucose (mg/dL) Aff. 91 107.99 0.088 84 112.54 0.001 135 106.48 0.008 73 114.23 0.001 153 106.22 <0.001
Unaff. 85 100.40 92 96.83 * 41 97.20 * 103 97.30 * 23 91.75 *
SBP (mmHg) Aff. 91 140.11 0.056 84 143.04 0.001 135 138.14 0.102 73 145.14 <0.001 153 137.29 0.240
Unaff. 85 132.47 92 130.38 * 41 130.73 103 130.24 * 23 130.65
DBP (mmHg) Aff. 91 83.79 0.021 84 83.69 0.041 135 81.67 0.449 73 84.66 0.013 153 81.14 0.966
Unaff. 85 78.35 * 92 78.86 * 41 79.52 103 78.69 * 23 81.30
Lipid intake (%) Aff. 91 33.66 0.083 84 34.49 0.653 135 34.54 0.244 73 34.66 0.460 153 34.41 0.512
Unaff. 85 35.00 92 34.14 41 33.53 103 34.05 23 33.59
EUR (%) Aff. 91 60.15 0.042 84 58.57 0.472 135 57.69 0.896 73 59.51 0.198 153 57.50 0.808
Unaff. 85 54.87 * 92 56.72 41 57.32 103 56.25 23 58.26
AMR (%) Aff. 91 24.27 0.192 84 28.01 0.039 135 25.13 0.415 73 26.56 0.476 153 26.05 0.307
Unaff. 85 27.13 92 23.50 * 41 27.39 103 25.01 23 23.00
AFR (%) Aff. 91 15.57 0.281 84 13.42 0.003 135 17.19 0.434 73 13.93 0.026 153 16.44 0.447
Glucose intolerance Type 2 Diabetes Hypertension Normolipidic diet
Trait Group N Mean p N Mean p N Mean p N Mean p
Age (years) Aff. 42 68.93 0.432 24 69.46 0.329 147 68.30 0.970 117 68.26 0.902
Unaff. 134 68.11 152 68.13 29 68.34 59 68.39
Weight (kg) Aff. 42 64.33 0.369 24 65.33 0.238 147 63.86 0.047 117 63.97 0.132
Unaff. 134 62.86 152 62.88 29 59.97 * 59 61.71
Height (m) Aff. 42 151.81 0.553 24 152.25 0.996 147 152.33 0.647 117 151.94 0.318
Unaff. 134 152.38 152 152.24 29 151.83 59 152.85
BMI (kg/m²) Aff. 42 27.97 0.221 24 28.22 0.229 147 27.54 0.055 117 27.73 0.028
Unaff. 134 27.07 152 27.13 29 26.00 59 26.40 *
FM (%) Aff. 42 37.60 0.732 24 37.32 0.976 147 37.30 0.922 117 38.11 0.025
Unaff. 134 37.17 152 37.27 29 37.17 59 35.62 *
FFM (%) Aff. 42 58.62 0.774 24 58.79 0.949 147 58.84 0.845 117 58.19 0.048
Unaff. 134 58.96 152 58.89 29 59.07 59 60.24
Triglycerides (mg/dL) Aff. 42 205.95 0.010 24 203.29 0.023 147 163.39 0.015 117 160.32 0.473
Unaff. 134 141.97 * 152 149.97 * 29 126.03 * 59 151.12
Total lipids (mg/dL) Aff. 42 767.52 0.309 24 767.06 0.544 147 750.59 0.164 117 738.11 0.385
Unaff. 134 737.59 152 741.21 29 715.03 59 757.86
Total cholesterol (mg/dL) Aff. 42 235.02 0.777 24 231.58 0.844 147 234.27 0.435 117 232.07 0.603
Unaff. 134 232.69 152 233.51 29 228.03 59 235.58
LDL (mg/dL) Aff. 42 134.31 0.295 24 130.87 0.225 147 139.82 0.927 117 138.42 0.465
Unaff. 134 141.69 152 141.36 29 140.52 59 142.93
VLDL (mg/dL) Aff. 42 35.82 0.002 24 38.30 0.006 147 30.80 0.036 117 29.58 0.693
Unaff. 134 27.97 * 152 28.51 * 29 24.97 * 59 30.37
HDL (mg/dL) Aff. 42 62.10 0.767 24 62.08 0.852 147 61.54 0.725 117 61.43 0.673
Unaff. 134 61.51 152 61.58 29 62.24 59 62.10
Fasting glucose (mg/dL) Aff. 42 135.45 <0.001 24 149.04 <0.001 147 106.23 0.001 117 105.00 0.625
Unaff. 134 94.57 * 152 97.26 * 29 94.67 * 59 102.98
SBP (mmHg) Aff. 42 138.69 0.459 24 140.63 0.310 147 141.63 <0.001 117 134.62 0.232
Unaff. 134 135.71 152 135.76 29 110.00 * 59 140.00
DBP (mmHg) Aff. 42 80.24 0.612 24 82.29 0.641 147 83.78 <0.001 117 80.81 0.680
Unaff. 134 81.46 152 80.99 29 67.93 * 59 81.86
Lipid intake (%) Aff. 42 33.99 0.592 24 33.40 0.269 147 34.13 0.313 117 31.74 <0.001
Unaff. 134 34.41 152 34.45 29 35.22 59 39.39 *
EUR (%) Aff. 42 60.48 0.195 24 62.29 0.100 147 57.03 0.293 117 57.72 0.902
Unaff. 134 56.70 152 56.86 29 60.48 59 57.37
AMR (%) Aff. 42 23.05 0.124 24 21.83 0.071 147 26.52 0.087 117 26.24 0.470
Unaff. 134 26.47 152 26.26 29 21.24 59 24.49
AFR (%) Aff. 42 16.48 0.900 24 15.88 0.800 147 16.44 0.522 117 16.04 0.406