Placental Growth Measures in Relation to Birth
Weight in a Latin American Population
Medidas de crescimento placentário em relação ao peso
de nascimento em uma população latino-americana
Carlos Grandi
1Angélica Veiga
2Nancy Mazzitelli
3Ricardo de Carvalho Cavalli
4Viviane Cardoso
51Department of Pediatrics, Hospital Maternidad Sardá, Universidad de Buenos Aires, Buenos Aires, Argentina
2Department of Obstetrics, Hospital Maternidad Sardá, Universidad de Buenos Aires, Buenos Aires, Argentina
3Department of Pathology, Hospital Maternidad Sardá, Universidad de Buenos Aires, Buenos Aires, Argentina
4Department of Ginecology & Obsterics, Faculdade de Medicina de Ribeirão Preto, Universidade de São Paulo, Ribeirão Preto, Brazil 5Department of Pediatrics, Faculdade de Medicina de Ribeirão Preto,
Universidade de São Paulo, Ribeirão Preto, SP, Brazil Rev Bras Ginecol Obstet 2016;38:373–380.
Address for correspondence Carlos Grandi, PhD, Department of Pediatrics, Hospital Maternidad Sardá, Luca 2151, Buenos Aires, Argentina (e-mail: [email protected]).
Keywords
►
Placenta
►
placental weight
►
placental
characteristics
►
birth weight
►
gestational age
Abstract
Introduction
The placenta, translates how the fetus experiences the maternal
environment and is a principal in
fl
uence on birth weight (BW).
Objective
To explore the relationship between placental growth measures (PGMs)
and BW in a public maternity hospital.
Methods
Observational retrospective study of 870 singleton live born infants at
Hospital Maternidad Sardá, Universidad de Buenos Aires, Argentina, between
Janu-ary 2011 and August 2012 with complete data of PGMs. Details of history, clinical and
obstetrical maternal data, labor and delivery and neonatal outcome data, including
placental measures derived from the records, were evaluated. The following manual
measurements of the placenta according to standard methods were performed:
placental weight (PW, g), larger and smaller diameters (cm), eccentricity, width
(cm), shape, area (cm
2), BW/PW ratio (BPR) and PW/BW ratio (PBR), and ef
fi
ciency.
Associations between BW and PGMs were examined using multiple linear regression.
Results
Birth weight was correlated with placental weight (R
2¼
0.49,
p
<
0.001),
whereas gestational age was moderately correlated with placental weight (R
2¼
0.64,
p
<
0.001). By gestational age, there was a positive trend for PW and BPR, but an
inverse relationship with PBR (
p
<
0.001). Placental weight alone accounted for 49% of
birth weight variability (
p
<
0,001), whereas all PGMs accounted for 52% (
p
<
0,001).
Combined, PGMs, maternal characteristics (parity, pre-eclampsia, tobacco use),
gestational age and gender explained 77.8% of BW variations (
p
<
0,001). Among
preterm births, 59% of BW variances were accounted for by PGMs, compared with 44%
at term. All placental measures except BPR were consistently higher in females than in
received April 7, 2016 accepted June 27, 2016 published online August 8, 2016
DOIhttp://dx.doi.org/ 10.1055/s-0036-1586721. ISSN 0100-7203.
Copyright © 2016 by Thieme Publicações Ltda, Rio de Janeiro, Brazil
Introduction
Genetic, environmental and socioeconomic factors1,2infl u-ence birth weight (BW), as well as illnesses that occur during pregnancy, such as infections, hypertensive disorders and diabetes mellitus.3
The placenta, to a large degree, translates how the fetus experiences the maternal environment, and genetic infl u-ences aside, is the main factor to influence BW. The growth of the placenta is directly related to its functional efficiency as the only fetal source of both nutrients and oxygen. Placental weight (PW) is one way to characterize placental size, but it is a collection of many dimensions of growth, including its surface area and its width.
The placental surface area reflects the laterally expand-ing growth of the chorionic disc (measured by disc shape
and chorionic disc diameters), whereas disc width reflects the arborization of the villous and vascular nutrient exchange surface. Placental weight and other placental growth measures (PGMs: larger and smaller diameters, disc width) are routinely collected in pathology laborato-ries across the world, but limited data regarding these placental dimensions in the Latin American population are available.
These PGMs were designed to capture different aspects of the placenta that,first of all, relate to placental function, theoretically influencing BW by different mechanisms; secondly, PGMs are conventionally considered to have different ‘critical periods of development’,4 and, finally, they are most relevant to the ‘fetal origins’ hypothesis, which posits that a wide variety of lifelong health risks are influenced by the fetal experience.
males, which was also not signi
fi
cant. Indices of placental ef
fi
ciency showed weakly
clinical relevance.
Conclusions
Reliable measures of placental growth estimate 53.6% of BW variances
and project this outcome to a greater degree in preterm births than at term. These
fi
ndings would contribute to the understanding of the maternal
–
placental
program-ming of chronic diseases.
Resumo
Introdução
A placenta traduz como o feto experimenta o ambiente materno, além de
ser a principal in
fl
uência sobre o peso ao nascer (PN).
Objetivo
Explorar a relação entre medidas de crescimento da placenta (MCPs) e PN
em uma maternidade pública.
Métodos
Estudo retrospectivo observacional de 870 recém-nascidos vivos únicos na
Maternidade Sardá, Universidade de Buenos Aires, Argentina, entre janeiro de 2011 e
agosto de 2012 com os dados completos das MCPs. Foram avaliados dados da história
clínica e obstétrica materna, trabalho de parto e resultados neonatais, incluindo medidas da
placenta derivadas dos registros médicos. Foram realizadas as seguintes medições manuais
da placenta: peso da placenta (PP, g), diâmetros maior e menor (cm), excentricidade,
espessura (cm), forma, área (cm
2), razões PN/PP e PP/PN e e
fi
ciência. Associações entre PN
e MCPs foram examinadas por meio de regressão linear múltipla.
Resultados
Peso ao nascer foi correlacionado com peso placentário (R
2¼
0,49,
p
<
0,001), enquanto idade gestacional foi moderadamente correlacionada com
peso placentário (R
2¼
0,64,
p
<
0,001). Por idade gestacional, houve uma tendência
positiva para a relação PP e PN/PP, mas uma relação inversa com a razão PP/PN
(
p
<
0,001). Somente peso da placenta respondeu por 49% da variabilidade do peso ao
nascer (
p
<
0,001), ao passo que todas as MCPs foram responsáveis por 52%
(
p
<
0,001). Combinados, MCPs, características maternas (paridade, pré-eclâmpsia,
fumo), idade gestacional e sexo explicaram 77,8% da variação do peso ao nascer
(
p
<
0,001). Entre nascimentos pré-termo, 59% da variância do PN foi contabilizada
pelas MCPs, em comparação com 44% a termo. Todas as medidas placentárias, exceto a
razão PN/PP, foram consistentemente maiores em mulheres do que em homens, mas
não signi
fi
cativas. Índices de e
fi
ciência placentária mostraram fraca relevância clínica.
Conclusões
medidas con
fi
áveis de crescimento placentário estimam 53,6% da
va-riância do peso ao nascer, e projetam esse resultado a um maior grau em nascimentos
pré-termo do que a termo. Estes resultados contribuiriam para a compreensão da
programação materno-placentária de doenças crónicas.
Palavras-chave
►
Placenta
►
peso da placenta
►
características da
placenta
Additionally, PW and other PGMs were found to be predic-tive of maternal disease, obstetric outcome, perinatal morbid-ity and mortalmorbid-ity and childhood growth and development.5
The aim of this study was to explore the relationships of PGMs with BW in a Latin American population.
Methods
This was an observational, retrospective study on 875 sin-gleton live born infants at the Department of Obstetrics and Gynecology of Hospital Maternidad Sardá, Universidad of Buenos Aires, Argentina, between January 2011 and Au-gust 2012 with complete data for placental measures. Details of history, clinical and obstetrical maternal data, labor and delivery and neonatal outcome data, including placental measures derived from the records, were evaluated. Exclu-sion criteria were gestational age (GA) less than 22þ0weeks
and over 42þ6weeks, twin gestation, PW lower than 100 g or
higher than 2,500 g.
Chronic hypertension was defined as the presence of elevated blood pressure (>140/90 mm Hg) before pregnancy
or before the 20th week of gestation. Preeclampsia was defined as hypertension presenting beyond 20 weeks of gestation with>300 mg protein in a 24-hour urine collection.
Eclamp-sia was defined as the occurrence of seizures in a pregnant woman with preeclampsia.6Women were diagnosed as having gestational diabetes according to the criteria of the World Health Organization (WHO) protocol.7The diagnosis of clinical chorioamnionitis was based on a maternal temperature of
>38°C with or without uterine tenderness and/or foul vaginal
discharge with no other cause of fever. Gestational age was ascertained by menstrual dates and early ultrasound measure-ments. Small for gestational age was defined when the BW for GA and sex were less than the ten percentile according to a local intrauterine growth chart.8
Preparation of the Placenta
After delivery, the placenta was placed in a self-sealing plastic bag and stored in a refrigerator; the date and time of birth were added to the label.9 A series of manual measurements of the placenta’s gross structure were then made in accordance with standard methods used in pathol-ogy examinations.10
Placental weights (g) were taken using an electronic scale; cord and membranes were cut before weighing. Leary et al suggested that the fetal weight/placental weight correlation does not change when placentas are weighed trimmed compared when they are weighed untrimmed.11The longest diameter of the surface (length) was measured using a transparent plastic ruler placed on the surface and recorded in centimeters. The diameter perpendicular to the length was defined as the smallest diameter, and was measured in the same way. Chorionic plate eccentricity was calculated as the ratio of the largest to the smallest diameters of the chorionic plate. Eccentricity measures the relative asymmetry of nor-mal placental growth, and may mark the uterine constraint of placental growth. Placental width at the center of the chorionic disc was measured by piercing the disc with a
needle onto which millimeter marks were inscribed, and analyzed in units of 0.1 cm.12Placental shape was defined as the difference between the larger and smaller diameters: oval placenta3 cm; round placenta<3 cm.13 Placental
area (cm2) was calculated assuming an elliptical surface,
using the formula length x breadth x π/4.14 The placental weight (g) to birth weight (g)ratio ([PW/BW], PBR) , a proxy for placental efficiency (“efficiency 1”), was calculated as a percentage ([PW/BW] x 100).15 The birth weight (g) to placental weight (g) ratio ([BW/PW], BPR) has been used to indicate fetal nutrition adequacy.16Finally, 2 other measures of placental efficiency were calculated using the ratios of length (“efficiency 2”) and breadth (“efficiency 3”) to BW.13 The placental measurements were obtained blinded from pregnancy and childbirth data.
Statistical Analysis
Sexual dimorphism and differences between term and pre-term were explored for all placental measures. As the PGMs are all measures of the same organ, they are necessarily interdependent. As there was no strong correlation among the PGMs (data not shown), unadjusted and multiple linear regression techniques explored the associations of PGMs to BW, and present the point estimates of effects with 95% confidence intervals (95%CI) and R-squared.
For the regression models, the following criteria were predefined. Firstly, when a PGM included the dependent variable (BW) as well as any other predictors, it was excluded from the adjusted models. Secondly, the goodness of fit of each regression model was carefully assessed according to Royston and Wright.17 This resulted in four placental pre-dictors (placental weight, largest and smallest diameters and disc width). Thirdly, three models were predefined: a)unad-justed included each PGMs; b) model 1 ada)unad-justed for all PGMs, and c) the full model included PGMs, maternal character-istics (gestational age [weeks], parity, pre-eclampsia, tobacco use) and infant gender.
A sample size of 47 subjects to obtain a statistical power of 80% withαset at 0.05 and an expected adjusted coefficient of determination of 0.40 was calculated (as this seemed to possibly reveal a clinically relevant prediction of BW).
The Stata 12 software (College Station, Texas, USA) was used for all statistical calculations, and significance was set at a 0.05 level.
The study was submitted and approved by the Research Ethics Committee of Hospital Maternidad Sardá.
Results
mean GA at birth of 35.6 weeks (22.2–42.5 weeks), and a mean BW of 2,581 g (380–4,860 g); 6.3% (n¼55) of the infants were born at28 gestational weeks; 8.7% (n¼76) at 29–32 weeks;
36.6% (n¼319) at 33–36 weeks; and 48.2% (n¼420) at37 weeks. Small for gestational age represented 18.8% of the sample, and it was greater for term (31.2%) than preterm
Table 1 Placental characteristics
Characteristic na Mean SD Range
Weight (g) 870 432 120 110–838
Gestational age (w):
22–28 55 266 81.9
29–32 76 350 90.5
33–36 319 428 101.4
37–42 420 474 115.6
Weight z scoreb 870 1.1 0.9 5.0
–2.1
Term neonates 420 1.4 0.9 5.0–1.3
Preterm neonates 450 0.9 0.8 4.3–2.1
Largest diameter of placenta (cm) 862 16.6 2.5 5.0–29.0
Smallest diameter of placenta (cm) 862 12.4 2.9 3.0–23.0
Chorionic plate eccentricityc 862 1.4 0.4 0.8
–5.6
Disc thickness (cm) 820 3.0 0.6 1.0–7.0
Chorionic plate area (cm2) 862 164.8 55.8 15.7
–397
Placental shape 870 4.1 2.6 2–18
Oval (3 cm): 612/870 (70.4%) Round (<3): 258/870 (29.6%)
BPR 870 5.9 1.5 2.1–23.5
Term neonates 420 6.6 1.4 2.2–23.5
Preterm neonates 450 5.4 1.3 2.1–10.8
Gestational age (w):
22–28 55 3.7 1.0
29–32 76 4.8 0.9
33–36 319 5.8 1.1
37–42 420 6.6 1.5
PBR 870 17.6 5.1 4.2 - 46.0
Term neonates 420 15.5 3.5 4.1–44.6
Preterm neonates 450 19.5 5.6 9.1–46.0
Gestational age (w):
22–28 55 28.4 6.8
29–32 76 21.5 4.3
33–36 319 17.5 3.7
37–42 420 15.5 3.5
Efficiency 1d 866 176.8 50.4 42.5
–460
Efficiency 2d 855 7.1 2.9 1.4
–31.5
Efficiency 3d 815 1.3 0.6 0.4–6.4
Abbreviations: BPR, birth weight to placental weight ratio; PBR, placental weight to birth weight ratio; SD, standard deviation; w, weeks.
aThe denominator, when specified, indicates that there were some missing values. bSource: Thompson et al., 2007. There were no available values for 22
–23 weeks of gestational age.
cRatio of larger to smaller diameter.
dRatio of placental weight (1), length (2) and breadth (3) to birth weight (efficiency).
t-test,p<0.001.
ANOVA,
neonates (8.3%), whereas congenital anomalies were present in 7.1%. The elective cesarean section rate was of 40.7%, and the vaginal birth rate, 43.2%; the remainder was induced labor.
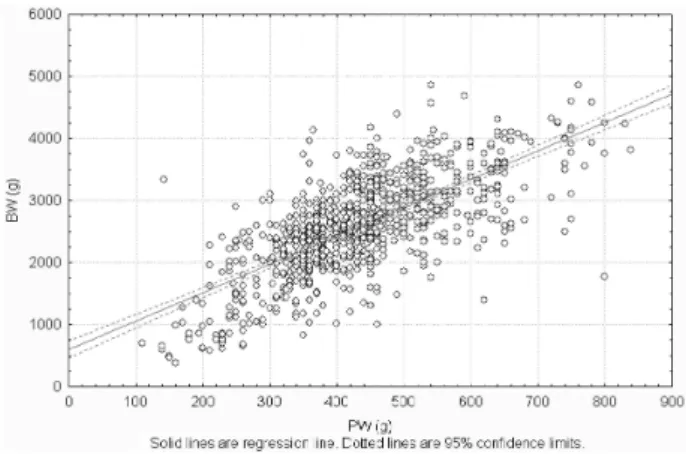
A description of the placental variables is presented in ►Table 1. Birth weight was correlated with PW
(r¼0.70, R2¼0.49,
p<0.001), but there was a wide
varia-tion in PW for any given BW, suggesting that there are large differences in placental efficiency. For example, babies weighing around 3,000 g had placentas ranging from 300 to 700 g in weight. (►Fig. 1) Birth weight was weakly
correlated with other placental measures, ranging from -0.11 (efficiency 2) to 0.47 for the chorionic plate area (all
p<0.001).
Gestational age was strongly correlated with PW (r¼0.80, R2¼0.64,
p<0.001), but there was a wide
varia-tion in PW for any given GA For example: babies around 36 weeks had placentas ranging from 200 to 700 g in weight. Combined, PW and GA reached 76.8% of BW variability (p<0.001).
Significant differences between term and preterm pla-centas were only observed for weight z score, BPR and PBR (data not shown). When examined by GA intervals, there was a positive trend for BPR (►Fig. 2), but an inverse relationship
with PBR (data not shown, all p<0.001). Two-thirds of
placental shapes were oval. Furthermore, all placental meas-ures except BPR were consistently higher in females than in males, which was also not significant.
Comparing univariable and multivariable point estimates of effect (►Table 2) revealed important results: R-squared
values increased steadily from the unadjusted model (5– Fig. 2 Birth weight to placental weight ratio (BPR) according to gestational age. Mean BPR increases with gestational age. Results were obtained from all placentas submitted to the Department of Pathology at Hospital Maternidad Sardá in 2011–2012. Data are similar to those of a previously published study (Benirschke, Kauf-mann; 2000).4There appear to be three tiers of significantly in-creasing workload (relatively increased fetal demand based on weight). The interval between 28–37 weeks of gestation is the most pronounced, followed by a plateau until 39 weeks, and then another increase until 41 weeks of gestation.
Fig. 1 Birth weight according to placental weight. r¼0.704 (p<0.001), BW¼569.63þ4.57PW. Abbreviations: BW, birth weight; PW, placental weight.
Table 2 Point estimates of effects for regression model of placental measures predicting birth weight (g)
Unadjusted models Multivariate models#
Point estimate (95%CI)
R-squared Model 1a Full Modelb
Point estimate (95%CI)
Adjusted R-squared
Point estimate (95%CI)
Adjusted R-squared
Placental weight (g) 4.5 (4.2–4.8)
0.49 3.8
(3.4–4.3)
0.52 2.4
(2.1–2.7)
0.78
Largest diameter (cm) 142.4 (1237–161.1)
0.21 23.3
(3.4–43.2)
16.4 (2.7–30.9)
Smallest diameter (cm) 115.8 (99.0–132.6)
0.18 27.8
(11.6–44.1)
5.1( 6.0
–16.3)
Disc width (cm) 299.1 (210.7–387.5)
0.05 61.3
( 7.9–130.5)
17.1
( 30.7–65.1)
Abbreviation: 95%CI, 95% confidence interval.
#Predictors include placental measures (placental weight, largest diameter, smallest diameter and disc width), gestational age (weeks), parity,
pre-eclampsia, tobacco use and infant gender.
aModel 1: adjusted for all placental measures (no adjustments for maternal variables, gestational age and sex). bFull Model: adjusted for all placental measures, maternal variables, gestational age and sex.
Signi
ficant at the 0.05 level.
Signi
49%) to 52% in the four placental growth models, whereas the multivariable model, including the maternal characteristics, GA, sex and the PGMs, accounted for 78% of BW variability (regression equation: BW (g)¼ 3186.667þ2.47PW þ14.9largest diameterþ5.52smallest diameterþ17.19
disc width [p<0.001]). In the full model, only placental
weight and largest diameter retained an independent effect. Additionally, when excluding smallest diameter and disc width from the model, there was a minimal change in the adjusted R-squared value.
For preterm and term neonates, placental weight alone accounted for 52.5% and 37.4% of BW variances respectively (p<0.001).
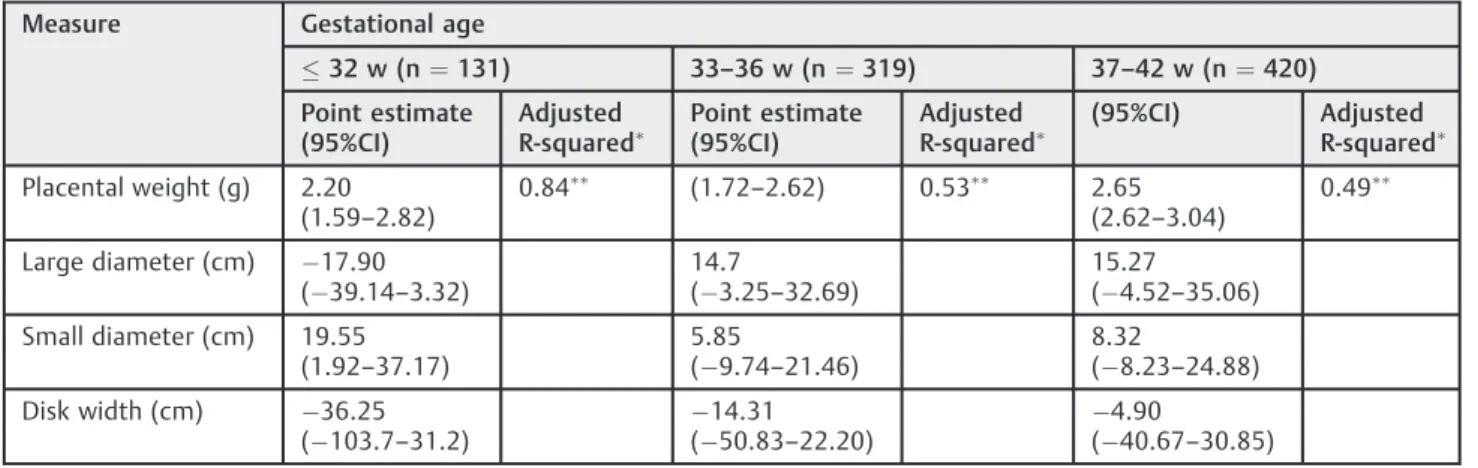
►Table 3shows regression models of placental measures
predicting BW according to GA. Overall, an inverse relation-ship between GA and the adjusted R-squared of all placental measures were observed; the adjusted R-squared for the PGMs were smaller at or over 33 weeks of gestation com-pared with<33 weeks.
Discussion
To our knowledge, this is the most comprehensive descrip-tion of PGMs and their reladescrip-tion to BW in a selected popula-tion reported to date in Latin America, and it may provide a useful guide for future analyses of placental gross anatomy. Although the BW of male neonates showed a marginal difference from that of females (58.3 g,p¼0.499), an oppo-site effect was observed for placental measures, suggesting that the growth of female placentas may not be the same as that of male placentas.
One hypothesis that explains this fact would be the
“Feminine Eco-stability Hypothesis”, which holds that the female sex is less sensitive to external factors that modulate ontogenetic development; in contrast, the male sex would be more negatively affected by environmental factors.18
The ratio of fetal to placental weight (or its inverse) is used as an endpoint measure of placental nutrient transport
efficiency across species.19 A small BPR was associated with higher odds of small for gestational age (SGA) infants, and may serve as an indicator suggestive of adverse intra-uterine environment.20Our BPRfindings increased with GA, suggesting a more dynamic growth during prematurity, in agreement with a previous study.21
The PBR has been associated with health throughout the lifespan, and has been shown to decrease with GA.22 The present study confirms these results and reveals values in a comparable range with other studies.15,23 Moreover, an elevated PBR may be an expression of a relatively inefficient placenta with reduced ability to maintain fetal growth, and thus can be used as a predictor of hypertension in adulthood for assumed lack of“placental functional efficiency”.24
In our study, we also measured placental efficiency using the ratios of the length and breadth of the surface to BW in addition to the customary PBR.25Ourfindings are in agree-ment with a previous study,13but in an attempt to define the mechanisms for this from our data, a subgroup analysis was run; in a multiple regression analysis, all indices were weakly associated with several maternal characteristics, GA and sex. Only the ratio of the length to BW showed clinical relevance, indicated by the adjusted R-squared (62%,p<0.001). This
suggests that when placental growth across the major axis in early pregnancy is adequate, there is increased thickening of the placenta, reflecting a different aspect of the control of the placental exchange surface.
In all regression analyses, we focused on the adjusted R-squared rather than on the magnitude of theβcoefficients, because R-squared changes would be unaffected by collinearity.
Surprisingly, our results showed a higher R-squared for prediction of BW compared with other studies, although it was methodologically different.26–28
After adjustment for maternal characteristics, GA and infant gender, 77% of BW variances were accounted for, suggesting‘partial mediation’of their effects on BW by the feature of the four placental measures.
Table 3 Point estimates of effects for regression model of placental measures predicting birth weight (g) according to gestational age
Measure Gestational age
32 w (n¼131) 33–36 w (n¼319) 37–42 w (n¼420)
Point estimate (95%CI)
Adjusted
R-squared Point estimate
(95%CI)
Adjusted
R-squared (95%CI) Adjusted
R-squared
Placental weight (g) 2.20 (1.59–2.82)
0.84 (1.72
–2.62) 0.53 2.65
(2.62–3.04)
0.49
Large diameter (cm) 17.90 ( 39.14–3.32)
14.7
( 3.25–32.69)
15.27
( 4.52–35.06)
Small diameter (cm) 19.55 (1.92–37.17)
5.85
( 9.74–21.46)
8.32
( 8.23–24.88)
Disk width (cm) 36.25 ( 103.7–31.2)
14.31 ( 50.83–22.20)
4.90
( 40.67–30.85)
Abbreviation: 95%CI, 95% confidence interval.
Predictors include placental measures, parity, preeclampsia, tobacco use and infant gender.
►Table 2 shows that only placental weight and largest
diameter retained an independent effect on BW after adjust-ment for mother and infant conditions, in consonance with another study.26 Barker et al14 observed that placental growth along the major axis (a proxy of volume) is qualita-tively different from growth along the minor axis, and postulated that the minor axis is more important for nutrient transfer to the fetus, partially explaining our results.
We speculate that one of the main reasons for the com-paratively low explanatory power of smallest diameter and disc thickness is that these measures have limitations, and incompletely capture the variability that characterizes the human placenta.
The difference in prediction of BW using PGMs in preterm versus term (80.8% versus 49.8% respectively) denotes dif-ferent abilities of PGMs to account for BW across pregnancy, and suggests that PGMs are more powerful at gestational ages when they are considered to be more dynamic, which occurs prior to the third trimester.4In other words, PGMs will have their strongest associations with BW variances when they themselves are changing.
Chorionic plate measures complement the ability of PW to account for BW variances.
These novels PGMs are related to both GA and BW at delivery, but their relations are not identical. In the present study, PGMs accounted for 25.8% of GA variances and 52.7% of BW variances. One explanation might be that growth param-eters naturally change across gestation, independent of any environmental effectors.12
These measures are highly reproducible, and may clarify the complex interrelations among mother, placenta and fetus to maintain pregnancy and support fetal growth. The reliance on R-squared is sufficient to demonstrate the power of these novel measures.
While sample size was relatively large, the placental exami-nations were performed at the request of attending physicians. Consequently, our study was derived from a convenience sample in which preterm birth, SGA and congenital anomalies were overrepresented. Therefore, our findings may not be generalized to the general population. However, they do closely mirror the hospital registry because they present similar de-mographic, clinical and obstetrical maternal data.
Moreover, these data are cross-sectional, and longitudinal studies would be necessary to validate the results. However, longitudinal studies of a cohort of placentas to register morphometry in real time throughout pregnancy are very difficult to perform; they could be developed using ultra-sound or magnetic resonance imaging, considering that their estimates have an error of 10 to 20%.29On the other hand, information on placental morphometry is rarely collected and evaluated in Latin America. Thesefindings would con-tribute to the understanding of the maternal–placental programming of chronic disease.
As it was a retrospective analysis, a variety of health behaviors and environmental exposures has not been con-trolled for. Nevertheless, to ensure an accurate and complete report of this observational study, the Strengthening the
Reporting of Observational Studies in Epidemiology (STROBE) Statement was followed.30
In conclusion, we have demonstrated that 52% of the variability of BW may be accounted for by the effects of four simple placental measures. In association with well-appreci-ated maternal and infant influences, thisfigure raised to 78%.
References
1 England LJ, Kendrick JS, Wilson HG, Merritt RK, Gargiullo PM, Zahniser SC. Effects of smoking reduction during pregnancy on the birth weight of term infants. Am J Epidemiol 2001;154(8):694–701
2 Andersson SW, Niklasson A, Lapidus L, Hallberg L, Bengtsson C, Hulthén L. Sociodemographic characteristics influencing birth outcome in Sweden, 1908-1930. Birth variables in the Population Study of Women in Gothenburg. J Epidemiol Community Health 2000;54(4):269–278
3 Ananth CV, Peedicayil A, Savitz DA. Effect of hypertensive diseases in pregnancy on birthweight, gestational duration, and small-for-gestational-age births. Epidemiology 1995;6(4): 391–395
4 Benirschke K, Kaufmann P. Placental shape aberrations. In: Benirschke K, Kaufmann P, editors. Pathology of the human placenta. 4th ed. New York: Springer-Verlag; 2000. p. 399–418 5 Risnes KR, Romundstad PR, Nilsen TI, Eskild A, Vatten LJ. Placental
weight relative to birth weight and long-term cardiovascular mortality:findings from a cohort of 31,307 men and women. Am J Epidemiol 2009;170(5):622–631
6 Report of the National High Blood Pressure Education Program Working Group on High Blood Pressure in Pregnancy. Am J Obstet Gynecol 2000;183(1):S1–S22
7 World Health Organization. Definition, diagnosis and classifi ca-tion of diabetes mellitus and its complicaca-tions. Report of a WHO consultation. Part 1: Diagnosis and classification of diabetes mellitus. Geneva: WHO; 1999
8 Urquia ML, Alazraqui M, Spinelli HG, Frank JW. [Reference birth-weights for the Argentine population by multiplicity of birth, sex, and gestational age]. Rev Panam Salud Publica 2011;29(2): 108–119 Spanish.
9 Bendon RW, Sander CM. Examination of the placenta. In: Lewis SH, Perrin E, editors. Pathology of the placenta. 2nd ed. Phila-delphia: Churchill Livingstone; 1999. p. 27–47
10 Lewis S, Benirschke K. Overview of placental pathology and justification for examination of the placenta. In: Lewis SH, Perrin E, editors. Pathology of the placenta. 2nd ed. Philadelphia: Churchill Livingstone; 1999. p. 1–26
11 Leary SD, Godfrey KM, Greenaway LJ, Davill VA, Fall CH. Contri-bution of the umbilical cord and membranes to untrimmed placental weight. Placenta 2003;24(2–3):276–278
12 Salafia CM, Maas E, Thorp JM, Eucker B, Pezzullo JC, Savitz DA. Measures of placental growth in relation to birth weight and gestational age. Am J Epidemiol 2005;162(10):991–998 13 Winder NR, Krishnaveni GV, Veena SR, et al. Mother’s lifetime
nutrition and the size, shape and efficiency of the placenta. Placenta 2011;32(11):806–810
14 Barker DJ, Thornburg KL, Osmond C, Kajantie E, Eriksson JG. The surface area of the placenta and hypertension in the offspring in later life. Int J Dev Biol 2010;54(2–3):525–530
15 Burkhardt T, Schäffer L, Schneider C, Zimmermann R, Kurmana-vicius J. Reference values for the weight of freshly delivered term placentas and for placental weight-birth weight ratios. Eur J Obstet Gynecol Reprod Biol 2006;128(1–2):248–252
17 Royston P, Wright EM. Goodness-of-fit statistics for age-specific reference intervals. Stat Med 2000;19(21):2943–2962
18 Lampl M, Gotsch F, Kusanovic JP, et al. Sex differences in fetal growth responses to maternal height and weight. Am J Hum Biol 2010;22(4):431–443
19 Fowden AL, Sferruzzi-Perri AN, Coan PM, Constancia M, Burton GJ. Placental efficiency and adaptation: endocrine regulation. J Phys-iol 2009;587(Pt 14):3459–3472
20 Luque-Fernandez MA, Ananth CV, Jaddoe VW, et al. Is the fetoplacental ratio a differential marker of fetal growth restriction in small for gestational age infants? Eur J Epidemiol 2015;30(4): 331–341
21 Wallace JM, Bhattacharya S, Horgan GW. Gestational age, gender and parity specific centile charts for placental weight for singleton deliveries in Aberdeen, UK. Placenta 2013;34(3): 269–274
22 Heinonen S, Taipale P, Saarikoski S. Weights of placentae from small-for-gestational age infants revisited. Placenta 2001;22(5): 399–404
23 Little WA. The significance of placental/fetal weight ratios. Am J Obstet Gynecol 1960;79:134–137
24 Williams LA, Evans SF, Newnham JP. Prospective cohort study of factors influencing the relative weights of the placenta and the newborn infant. BMJ 1997;314(7098):1864–1868
25 Misra DP, Salafia CM, Miller RK, Charles AK. Non-linear and gender-specific relationships among placental growth measures and the fetoplacental weight ratio. Placenta 2009;30(12): 1052–1057
26 Salafia CM, Zhang J, Charles AK, et al. Placental characteristics and birthweight. Paediatr Perinat Epidemiol 2008;22(3):229–239 27 Coall DA, Charles AK, Salafia CM. Gross placental structure in a
low-risk population of singleton, term,first-born infants. Pediatr Dev Pathol 2009;12(3):200–210
28 Pala HG, Artunc-Ulkumen B, Koyuncu FM, Bulbul-Baytur Y. Three-dimensional ultrasonographic placental volume in gestational dia-betes mellitus. J Matern Fetal Neonatal Med 2016;29(4):610–614 29 Avni R, Neeman M, Garbow JR. Functional MRI of the placenta—
From rodents to humans. Placenta 2015;36(6):615–622 30 von Elm E, Altman DG, Egger M, Pocock SJ, Gøtzsche PC,