BARRIERS TO FDI IN THE EUROPEAN UNION
Claudia Raquel Alves de Paiva
Dissertation
Master in International Business
Supervised by
Rosa Maria Correia Fernandes Portela Forte
ii
Acknowledgements
In first place, I would like to thank my supervisor, Professor Rosa Forte, for all the help and guidance in developing this work. Thank you for always motivating me, without your support none of this would have been possible to achieve.
I would also like to express my gratitude to all entrepreneurs who answered the questionnaire and helped me to develop this research. Without your contribute I would not have been able to finish this dissertation.
To my parents who always invested in me and in my education, thank you for all your love and unconditional support. To my brother for always giving me valuable advices, and to my nephews who are the best part of my live. To all my family. I am very grateful to have you all in my life.
I am very grateful to Carla Pinho for translating the questionnaire into French and German. Your help was crucial in helping me to get more answers to the questionnaire. Thank you so much.
A special thanks goes Vítor Hugo, for being always by my side and encouraging me to work hard and always give my best. Thank you for being my best friend and for being always present when I need the most.
I would also like to thank my friends Érica Lopes, Vanessa Sousa, Joana Costa, Andreia Freitas and Viviana Garcia for always sharing their support. I met you all at different times in my academic journey and you all became essential in my life.
iii
Abstract
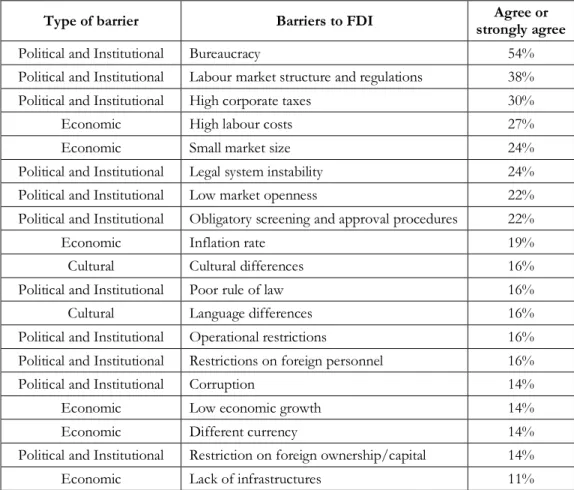
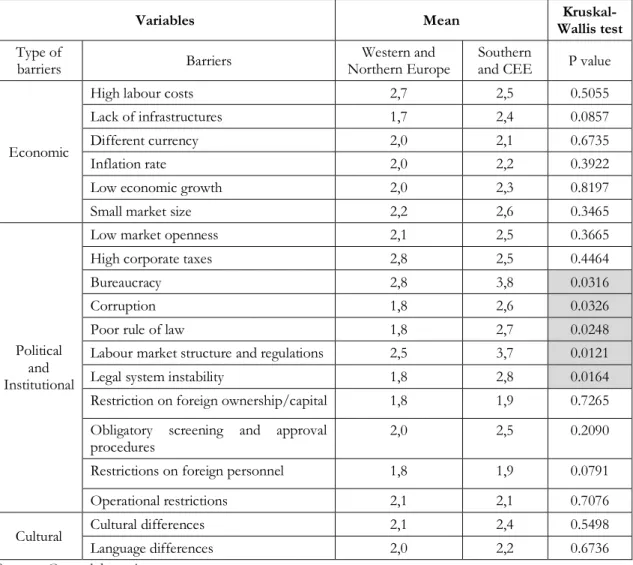
In recent decades, there has been a significant increase in FDI flows worldwide. The European Union, being one of the regions that most realizes and receives FDI, was one of the major contributors to this phenomenon. FDI literature has placed a greater emphasis on the analysis of FDI location from a macro point of view and more focused on its determinants, with only few studies focusing on the barriers affecting FDI in the European Union and that adopt a micro perspective, which gives a greater insight into the barriers that companies face when they decide to invest in another country. Thus, this work aims to fill this gap in the literature,based on a survey sent to subsidiary companies of multinationals that have settled in the European Union since 2010. The results, based on the response of 37 companies, allow us to realize that political and institutional barriers are the most significant for companies. Bureaucracy was perceived as the most important barrier by the companies of the sample, followed by labour market structure and regulations, high corporate taxes and high labour costs. Additionally, the Kruskal-Wallis test suggests that there are significant differences in the perception of some barriers considering the location of firms in the EU, the mode of establishment, the sector of activity and the origin of the foreign investor.
Keywords: Foreign direct investment; Multinationals; FDI location; Barriers to FDI;
iv
Resumo
Nas últimas décadas, houve um aumento significativo dos fluxos de IDE a nível mundial. A União Europeia, sendo uma das regiões que mais realiza e mais recebe IDE, foi uma das que mais contribuíram para este fenómeno. A literatura sobre o IDE tem colocado um maior enfase na análise da localização do IDE de um ponto de vista macro e mais focado nos seus determinantes, existindo poucos estudos focados nas barreiras que afetam o IDE na União Europeia e que adotam uma perspetiva micro, o que dá uma maior perceção das barreiras que as empresas encontram quando decidem investir noutro país. Desta forma, o presente trabalho visa colmatar esta lacuna da literatura, baseando-se num inquérito enviado a empresas subsidiárias de multinacionais que se instalaram na União Europeia desde 2010. Os resultados, baseados na resposta de 37 empresas, permitem perceber que as barreiras políticas e institucionais são as mais significantes para as empresas. A burocracia foi percecionada como a barreira mais importante pelas empresas da amostra, seguida pelos regulamentos e estrutura do mercado laboral, altas taxas corporativas e altos custos laborais. Para além disso, o teste de Kruskal-Wallis sugere a existência de diferenças na perceção de algumas barreiras dependendo da localização das empresas na UE, do modo de estabelecimento, do setor de atividade e da origem do investidor estrangeiro.
Palavras-chave: Investimento direto estrangeiro; Multinacionais; Localização do IDE;
v
Index of contents
Acknowledgements ... ii Abstract ... iii Resumo ... iv Index of contents ... v Table Index ... vi Graph Index ... viList of Abbreviations ... vii
1. Introduction ... 1
2. Literature Review ... 3
2.1. Foreign Direct Investment characterization ... 3
2.2. Theoretical background on the location of FDI ... 4
2.3. FDI location determinants... 6
2.3.1. Economic factors ... 6
2.3.2. Political and institutional factors ... 9
2.4. Survey studies on FDI barriers in Europe... 12
2.5. Research Hypothesis ... 17
3. Methodology... 21
3.1. Research method and questionnaire design... 21
3.2 Characterization of the sample ... 22
4. Results and discussion ... 29
4.1. Global results ... 29
4.2. Analysis of results by subgroup ... 31
4.2.1. Results according to the companies’ location in the EU ... 32
4.2.2. Results according to the mode of establishment ... 34
4.2.3. Results according to the sector of activity ... 35
vi
4.3. Final discussion ... 38
5. Conclusion ... 42
References ... 45
Annexes ... 52
Annex 1. Questionnaire design ... 52
Table Index
Table 1. Economic determinants of FDI ... 8Table 2. Political and Institutional determinants of FDI ... 11
Table 3. Survey studies on barriers to FDI in Europe ... 13
Table 4. Barriers to FDI location ... 16
Table 5. Number of firms per country ... 23
Table 6. Number of responses per group of countries ... 25
Table 7. Level of importance of the subsidiary's activities to the foreign investor ... 28
Table 8. Barriers ordered by the percentage of firms that agree or strongly agree ... 30
Table 9. Kruskal-Wallis test statistics: Western and Northern Europe vs Southern and CEE ... 33
Table 10. Kruskal-Wallis test statistics: mode of establishment ... 34
Table 11. Kruskal-Wallis test statistics: sector of activity... 36
Table 12. Kruskal-Wallis test statistics: origin of the main foreign investor ... 38
Graph Index
Graph 1. Mode of establishment globally and per region ... 27Graph 2. Region of investor’s home country ... 28
Graph 3. Mean of the level of agreement of the total answers per barrier ... 29
Graph 4. Mean of the level of agreement considering the EU regions ... 32 Graph 5. Mean of the level of agreement considering the origin of the foreign investors 37
vii
List of Abbreviations
CEE - Central and Eastern Europe E.g. - For example
EU - European Union
FDI - Foreign Direct Investment GDP - Gross Domestic Product JV - Joint Venture
M&A - Merger & Acquisition MNE - Multinational Enterprise
OECD - Organisation for Economic Co-operation and Development UK - United Kingdom
UN - United Nations
UNCTAD - United Nations Conference on Trade and Development USA - United States of America
1
1. Introduction
Since the second half of the 20th century, there has been an unprecedented increase
in foreign direct investment (FDI) flows. Although initially the United States of America (USA) became the greatest outward direct investor, especially due to its firms’ investments in Europe, as time passed, the USA has lost some of its influence while firms from developed countries and from developing and emerging economies increased their weight as outward direct investors in the global economy (Dunning & Lundan, 2008).
On a country level, Alfaro, Chanda, Kalemli-Ozcan & Sayek (2010) consider that FDI inflows can have a positive effect on economic growth, especially when the host country is economically more developed, since it has more conditions to absorb its effects. For those reasons, as foreign direct investment can be positively correlated with economic growth, this is a vital subject to explore when studying International Economy.
When a firm decides to engage in FDI, the market selection requires a deep country analysis, which is fundamental for its strategy implementation (Bitzenis & Szamosi, 2009). Nowadays, although there have been large improvements in the countries’ relations, with a global liberalization and markets openness, each country has its own policies concerning investment and there is a growing number of states that have been increasing investment regulations and restrictions mainly due to national security concerns (UNCTAD, 2018a). Therefore, inherent country risks on a political, legal, economic and cultural level must be considered and wisely studied in order to reduce investment risk (Bitzenis & Szamosi, 2009). Although there is a vast literature on the location determinants of FDI, most studies adopt a macroeconomic approach. Consequently, studies following a micro analysis and examining the barriers that firms find in the host country are rarer and, in addition, most of those studies are about emerging or transition economies. Yet, it does not mean that obstacles to FDI, for instance, in the European Union (EU) countries are inexistent.
According to the World Investment Report (UNCTAD, 2018a), the European Union is one of the regions that invests and receives more investment globally (about 25% of the world’s total FDI outflows and 20% of the world’s total FDI inflows, respectively, in 2017). However, the data from 2017 shows that its distribution between the 28 member States is unequal. Additionally, among the world top 20 host economies there are only 6 EU countries
2
(Netherlands, France, Germany, Ireland, Spain and Italy), and even between those countries there is a large gap in FDI inflows, for example, with the Netherlands receiving 58 billion dollars of FDI in 2017 and Italy only 17 billion of dollars. For those reasons, it is important to analyse FDI in the European Union, not only to understand those differences amongst its member States but also because FDI inward stock in the European Union is a fundamental part of its economy, representing over 53% of its GDP in 2017 (UNCTAD, 2018b).
Finally, considering what was mentioned above, being one of the greatest economies of the world, obstacles to that type of investment in the EU must be considered and analysed, especially considering investors experiences. For that reason, this work aims to identify the main barriers to FDI in the European Union and understand if they differ depending on the location of the company in the EU, the mode of establishment, the sector of activity and the origin of the foreign investor, as suggested by Bitzenis & Nushkova (2011). The research was based on a micro level analysis, by inquiring a sample of firms, whose main foreign investors invested in the EU in the last 10 years, about the obstacles that were perceived during the investment process in the EU.
It is important to explore this field because, to our knowledge, there is a lack of research related to FDI barriers in the European Union, and, since FDI is an important part of its economy, it is essential to understand which constrains are perceived by the companies in order to help to improve policies, create a better environment to investment and attract investment of higher quality.
The present work is structured as follows. The second chapter presents a literature review on FDI, where the main theories and studies on its location will be explored, focusing on the location determinants and barriers of FDI. In the chapter 3 the methodology of this study is detailed and, then, in the chapter 4 the results are analysed. Finally, the 5th chapter
3
2. Literature Review
In this chapter, we review the literature on the most important topics related to the research question. In section 2.1, there is a brief characterisation of FDI. Then, the theoretical background on the location of FDI is explored in section 2.2. In the next sections, there is a review of empirical studies on the determinants of FDI location in the European Union (section 2.3) and on the principal survey studies on the barriers to FDI in the EU (section 2.4). Finally, in the last section (section 2.5), the research hypotheses are formulated.
2.1. Foreign Direct Investment characterization
Foreign Direct Investment (FDI) is defined as an investment made by an entity (the foreign direct investor) that pursues an enduring interest and control in an enterprise (the foreign affiliate) located in a different economy from the investor’s domestic one (UNCTAD, 2005). According to OECD (2008) definition, in this strategic lasting relationship, the direct investor has a substantial influence on the management of its foreign affiliate. Nevertheless, as stated in the OECD’s definition, the investment is only considered FDI when the investor owns at least 10% of equity ownership of the foreign affiliate.
A firm that decides to pursue its internationalization process via FDI has to choose between making a Greenfield investment, in which the direct investor builds a subsidiary from scratch overseas, or making a Merger & Acquisition (M&A), which involves two firms that decide to join to create a new entity or the acquisition of an existing company (Nocke & Yeaple, 2007; Morschett, Schramm-Klein & Zentes, 2015). The former gives the investor the possibility to build the subsidiary according to his interests, by implementing his own methods and creating his own organizational culture, while in the latter the investor may have to deal with past problems and debts from the existing firm. However, a Greenfield investment involves a slower and time-consuming process and a higher degree of uncertainty (Morschett et al., 2015).
Depending on the desired level of control, the firm can choose to form a joint venture (JV) by sharing the ownership with local partners or by acquiring only a part of the total ownership of an existing firm, or to establish a wholly-owned subsidiary (WOS), in which the investor has the total control of the foreign plant (Pan & Tse, 2000).
4
Besides the different level of control, joint ventures and wholly-owned subsidiaries differ in resource commitment and risks for the investor (Hill, Hwang & Kim, 1990). For instance, the choice of a WOS means that the direct investor wants to have a higher control over its foreign operations, since it gives more freedom to implement strategies according to its own interests, facilitates coordination and gives a greater return to investment (Anderson & Gatignon, 1986). However, although the level of resource commitment is also higher, since the multinational enterprise (MNE) has to carry all the costs, and constitutes a limit to the firm’s flexibility in changing its international strategy, the level of risk dissemination of know-how is lower in WOSs (Hill et al., 1990). In the case of JVs, according to Hill et al. (1990), the levels of control and resource commitment are lower, and the risk dissemination is higher than in WOSs, since the ownership is shared between the partners.
Considering what was mentioned, it is possible to notice that foreign direct investment is a complex issue in international business and that many factors are behind the firm’s decision to pursue FDI in the foreign markets. For this reason, it is important to make a deeper investigation on the firm’s strategy in order to understand the choice of this type of investment and, especially, its location decision.
2.2. Theoretical background on the location of FDI
Until the second half of the 20th century, theories about MNEs’ activity and foreign
direct investment were practically non-existent. It is in the 1960’s and 1970’s that the first empirical studies are published, trying to explain firm’s foreign production and to identify the reasons of its location (Faeth, 2009)1 One of those studies is the eclectic paradigm,
developed by Dunning (1977) with the objective to present a holistic and analytical framework that could identify and explain the factors that influence enterprises to produce outside their domestic market and the production growth. In this paradigm, Dunning argues that in order to engage in FDI and locate its activities overseas, the firm must be driven by a set of three advantages: the ownership-specific advantages(O), the location-specific advantages(L) and the internalization-specific advantages(I), which creates the OLI Framework (Agarwal & Ramaswami, 1992). According to Dunning & Lundan, (2008), the
5
advantages mentioned are not static and firm’s strategy and response to each one will be different. Nevertheless, in order to engage in FDI, all three advantages must be present.
The ownership-specific advantages(O) concerns the firm’s unique characteristics and competitive advantages that helps to surpass the costs of foreignness (Dunning, 1988). These competitive advantages are the result of the firm’s size and experience, skills and product’s innovation (Agarwal & Ramaswami, 1992). As stated by Dunning (2000), if the firm possess most of these competitive advantages, the opportunity to engage in FDI is higher.
The location-specific advantages(L) correspond to the conditions that favour FDI in the host countries, which can be related to economic, political, technological, social, legal, infrastructural and cultural factors (Galan, Gonzalez-Benito & Zũiga-Vincente, 2007). Foreign direct investment only happens when it is more profitable for the firm to perform a certain activity in the host country rather than perform it at home. In order to understand that, many factors must be taken into account, such as the market size, production and labour costs, tariff and non-tariff trade barriers, communication and transport costs, the market structure, the existence of competitors and institutional aspects, among others (Dunning, 1998, 2001).
The internalization-specific advantages are related to the firm’s ability to exploit market failures and to exploit its own competitive advantages overseas (Dunning 2000). These advantages are related to, for example, avoid negotiation costs, to avoid or exploit government decisions on tariffs, prices and taxes, to be able to control the supplies and the sale of inputs (Dunning & Lundan, 2008). The firm must have the interest to transfer its ownership-advantages overseas within its own organizations (Dunning, 1988).
Focusing on the location decision, many researchers have given special attention to the location determinants and motivations of FDI (Dunning, 1998). In his work, Dunning identifies four motivations that guide the firm’s international location strategy: market seeking, resource seeking, efficiency seeking and strategic asset seeking (Dunning, 2000).
First, the market seeking motivation is followed in order to supply a market demand and to profit with it. However, a firm can also enter in the foreign markets to follow important suppliers and customers, to avoid distance costs and to have a physical presence in the markets that were firstly served by exports. Secondly, the resource seeking strategy is followed when the firm needs to get access to specific resources that are inexistent in their
6
domestic economy or that exist at a higher cost, such as natural resources (like oil or gas) and unskilled labour. In the efficiency seeking strategy the firm usually disperse its activities in the foreign markets specially to have access to lower labour costs with the objective to reduce production costs. Finally, the strategic asset seeking strategy is designed to protect or acquire ownership specific advantages, essentially correlated with innovation (Dunning, 2000; Pananond, 2015).
2.3. FDI location determinants
The acceleration of the globalization process in recent decades has led to the growth of the international expansion of firms and to the increase of FDI flows. In consequence, many authors have dedicated some of their work trying to identify the factors that determine a firm’s foreign location (Faeth, 2009).
The studies chosen to explain FDI determinants were collected from a deep research on the principal scientific literature databases, Scopus and Web of Science, using keywords such as “FDI determinants”, “location determinants”, “FDI in Europe/EU”, and “FDI in developed countries”. The search found 23 papers2 that mentioned FDI location
determinants in EU countries, which will be analysed in this part. Most empirical research recognize that a country’s FDI attraction capacity depends on its economic and political and institutional characteristics (e.g. Bevan & Estrin, 2014; Galan et al., 2007), that will be explored in the next subsections.
2.3.1. Economic factors
On an economic level, considering FDI flows to developed countries, the literature identifies at least six determinants, such as market size, market growth, labour costs, infrastructures, macroeconomic stability and exchange rate (see Table 1).
Considering market size, usually measured by the country’s GDP or GDP per capita, although Culem (1988) found that it was insignificant for the USA’s investment in European countries, several studies (e.g. Aristotelous & Fountas, 1996; Biswas, 2002; Bevan & Estrin, 2004; Majocchi & Strange, 2007; Basile, Castellani & Zanfei 2008; Rasciute & Downward, 2017; Peres, Ameer & Xu, 2018) confirm that market size has a positive effect on FDI
2 After consulting the references of the works found at Scopus and Web of Science, four more papers were collected and analysed.
7
inflows. This can be explained by the fact that investors can benefit from a larger production scale (Aristotelous & Fountas, 1996). Also, market growth, with the annual real growth rate of GDP used as proxy, is one of the most common FDI determinants since it gives future growth perspectives to the firm in the host market, as found in some studies (e.g. Culem, 1988; Majocchi & Strange 2007; Peres et al., 2018). However, according to Maniam, Leavell & Mehta (2002), it is insignificant for FDI in the United Kingdom (UK), Germany, France, as they are already big markets.
Regarding labour costs, usually measured by the unit labour cost in the host country, it is found that they have a negative effect on FDI, which means that lower labour costs in the host country is seen as a factor of FDI attractiveness (e.g. Culem, 1988; Biswas, 2002; Bevan & Estrin, 2004; Majocchi & Strange, 2007; Alam & Shah, 2013; Dellis, Sondermann & Vansteenkiste, 2017; Rasciute & Downward, 2017). According to Alam & Shah (2013), investors prefer countries with low labour costs because it reduces production costs and the cost of doing business in the country.
The quality of infrastructures is another factor analysed in several studies. Generally using the number of telephone lines (fixed and mobile) per 100 inhabitants as the proxy, it is found that it has a positive effect on FDI inflows since it reduces the costs of doing business abroad (e.g.Wheeler & Mody, 1992; Biswas, 2002; Majocchi & Strange, 2007; Alam & Shah, 2013; Peres, et al., 2018).
Other important determinant is macroeconomic instability, measured by the inflation rate, which has a negative effect on FDI (e.g Gast & Hermann, 2008; Wisniewski & Pathan, 2014; Boateng, Hua, Nisar & Wu, 2015).As reported by the authors, high inflation rates have a negative effect on FDI, since it represents macroeconomic instability in the host country. This means that macroeconomic stability of the host country is important to attract FDI.
Finally, when exchange rate is considered, the results are divergent. For Aristotelous & Fountas (1996), the real depreciation of the host country’s currency increases the wealth of foreign companies and reduces labour costs in the country, which leads to an increase in FDI inflows. The authors found that it has a positive effect on FDI from USA and Japan in the European Union, although it is more significant for USA FDI outflows. Nevertheless, Gast & Herrmann (2008) show that the appreciation of US-dollar relative to the reporting country’s currency has a positive effect on FDI of the partner country, but fluctuations of
8
the exchange rates of the partner countries and within the EU25 area, are insignificant for FDI.Alam & Shah (2013), also found an insignificant effect of exchange rate in FDI. Then, Boateng et al. (2015), show that, contrary to what was expected, an appreciation of Norway’s currency has a positive effect on FDI in the country. Given the data mentioned, it is not possible to determine what is the real effect that the exchange rate can have on the FDI.
Table 1. Economic determinants of FDI
Economic
Determinants FDI location Type of analysis on FDI Effect Authors
Market size
Belgium, France, Germany,
Netherlands, UK, USA Macro 0 Culem (1988) European Union Macro + Aristotelous & Fountas (1996)
44 countries Macro + Biswas (2002)
Central and Eastern Europe Macro + Bevan & Estrin (2004) 7 CEE countries Mixed + Majocchi & Strange (2007) 50 regions of 8 EU
countries Micro + Basile, Castellani & Zanfei (2008) 10 OECD countries Macro - Alam & Shah (2013) 25 European countries Mixed + Rasciute & Downward (2017)
110 countries Macro + Peres, Ameer & Xu (2018)
Market Growth
Belgium, France, Germany,
Netherlands, UK, USA Macro + Culem (1988) UK, Germany, France Macro 0 Maniam, Leavell & Mehta (2002)
7 CEE countries Mixed + Majocchi & Strange (2007) 110 countries Macro + Peres, Ameer & Xu (2018)
Labour costs
Belgium, France, Germany,
Netherlands, UK, USA Macro - Culem (1988)
44 countries Macro - Biswas (2002)
Central and Eastern Europe Macro - Bevan & Estrin (2004) 7 CEE countries Mixed - Majocchi & Strange (2007) 10 OECD countries Macro - Alam & Shah (2013) 25 European countries Mixed - Rasciute & Downward (2017)
OECD Advanced
economies Macro - Dellis, Sondermann & Vansteenkiste (2017)
Infrastructures
42 countries Macro + Wheeler & Mody (1992)
44 countries Macro + Biswas (2002)
7 CEE countries Mixed + Majocchi & Strange (2007) 10 OECD countries Macro + Alam & Shah, (2013)
110 countries Macro + Peres, Ameer & Xu (2018)
Macroeconomic instability
OECD countries Macro - Gast & Herrmann (2008) 33 OECD countries Macro - Wisniewski & Pathan (2014)
Norway Macro - Boateng, Hua, Nisar & Wu (2015)
Exchange rate
European Union Macro + Aristotelous & Fountas (1996) OECD countries Macro +/0 Gast & Herrmann (2008) 10 OECD countries Macro 0 Alam & Shah (2013)
Norway Macro + Boateng, Hua, Nisar & Wu (2015)
9 2.3.2. Political and institutional factors
Considering political and institutional dimensions, the literature identifies at least seven factors that influence FDI location, such as: market openness, tax rates, corruption, good rule of law, bureaucracy, regime type and investment incentives (see table 2).
Starting with the market openness, although there are mixed results, most studies found that it has a positive effect on FDI. First, most studies show that when there is a large weight of exports and imports over the GDP, it has a positive effect on FDI and on the country’s attractiveness (e.g. Aristotelous & Fountas, 1996; Botric´ & Škuflic´, 2006; Majocchi & Strange, 2007; Boateng et al., 2015; Chanegriha, Stewart & Tsoukis, 2017; Saini & Singhania, 2018). According to Tintin (2014), this means that the host country is a more open economy and firms prefer to invest in countries where it is easier to benefit from international trade. Nevertheless, some studies conclude that the market openness doesn’t influence FDI when considering intra-EU investment, since there is a high economic integration between EU countries (Gast & Herrmann, 2008), and that it can also be negatively correlated with FDI when considering USA MNEs (Wheeler & Mody, 1992).
Considering tax rate, the results are also divergent among empirical research. On the one hand, some studies found that when the corporate taxes are higher, the country’s capacity to attract FDI is lower (e.g. Wei, 2000; Basile et al., 2008; Dellis et al., 2017). Other studies (e.g. Wheleer & Mody, 1992; Alam & Shah, 2013), show that corporate taxes have an insignificant effect on FDI. On the other hand, although Basile et al. (2009) found that tax rates have a negative impact on FDI inflows from non-European firms in the EU, it was found that tax rates have a positive influence on investments made by European firms in the EU. Due to taxation, MNEs may benefit from more and cheaper public goods and better infrastructures in the host country (Basile et al., 2009; Rasciute & Downward, 2017). This means that the importance of tax rates differs depending on the country of origin of the investor.
When corruption is considered, the authors show that it has a negative effect on FDI and that low corruption rates are positive for FDI in the host country (e.g. Wei, 2000; Bénassy-Quéré et al., 2007; Dellis et al., 2017; Rasciute & Downward, 2017; Peres et al., 2018). According to Rasciute & Downward (2017), corrupt practices on politics have a negative effect on the FDI location decision. For Wei (2000), it indicates that the host countries governments have a bad execution and accomplishment of the contracts made.
10
Additionally, when there is a good rule of law in the host country it has a positive effect on FDI, which means that when there is a high protection of property rights in the host country, MNEs feel more confident and secure to invest their capital (Biswas, 2002; Botric´ & Škuflic´, 2006). A poor rule of law and judicial system increases insecurity in business, since there is a higher expropriation probability (Bénassy-Quéré et al., 2007; Dellis et al. 2017; Peres et al., 2018).
Regarding bureaucracy, it is seen as a factor that has an insignificant or negative effect on FDI location. First, Basile et al. (2009) estimate that, for non-European MNEs, bureaucracy is not a significant determinant of the location decision in European Union. On the other hand, Bénassy-Quéré et al. (2007) show that bureaucracy is a determinant that is related with institutional quality. According to the authors, poor institutions increase the costs of FDI.
Other political and institutional aspect is the regime type of the host country. According to some studies (e.g Biswas, 2002; Jensen, 2003; Wisniewski & Pathan, 2014; Chanegriha et al., 2017), democratic governments attract more FDI than authoritarian regimes, as they are normally related with lower country risks.
The determinants mentioned above, such as corruption, a good rule of law, related with property rights, bureaucracy and regime type, are related with the quality of institutions. According to Bénassy-Quéré et al. (2007), it is important because poor institutions are related with higher costs in foreign operations, which is negative to FDI.
Finally, investment policies, like the EU Cohesion Policy, in which structural and cohesion funds are used to create public incentives that MNEs can benefit from, have a positive effect on FDI location (Basile et al., 2008, Bitzenis & Szamosi, 2009; Basile et al., 2009).
The analysis of the determinants gives a broad idea of the factors that may affect negatively the location choice of MNEs, such as small market size, low market growth, labour costs, poor infrastructures, macroeconomic instability and exchange rate, on an economic level, and low market openness, high tax rates, corruption, poor rule of law, essentially related to the lack of property rights protection, and bureaucracy, on a political and institutional level.However, most studies referred follow a macroeconomic approach, which shows that there is a lack of microeconomic studies in this field.
11 Table 2. Political and Institutional determinants of FDI
Political and Institutional
Determinants FDI location
Type of
analysis on FDI Effect Authors
Market openness
42 countries Macro - Wheeler & Mody, (1992) European Union Macro + Aristotelous & Fountas (1996) Southeast European countries Macro + Botric´ & Škuflic´ (2006)
7 CEE countries Micro + Majocchi & Strange (2007) OECD countries Macro 0 Gast & Herrmann (2008)
Norway Macro + Boateng, Hua, Nisar & Wu (2015) 168 countries Macro + Chanegriha, Stewart & Tsoukis (2017)
20 countries Macro + Saini & Singhania (2018)
Tax rates
42 countries Macro 0 Wheleer & Mody (1992)
45 countries Macro - Wei (2000)
50 regions of eight EU
countries Micro - Basile, Castellani & Zanfei, (2008) 47 regions in five EU
countries Micro +/- Basile, Castellani & Zanfei (2009) 10 OECD countries Macro 0 Alam & Shah, (2013) 25 European countries Mixed + Rasciute & Downward (2017) OECD Advanced economies Macro - Dellis, Sondermann & Vansteenkiste (2017)
Corruption
45 countries Macro - Wei (2000)
52 countries Macro - Bénassy-Quéré, Coupet & Mayer (2007) OECD Advanced economies Macro - Dellis, Sondermann & Vansteenkiste (2017)
25 European countries Mixed - Rasciute & Downward (2017) 110 countries Macro - Peres, Ameer & Xu (2018)
Good Rule of Law
44 countries Macro + Biswas (2002)
Southeast European countries Macro + Botric´ & Škuflic´ (2006) 52 countries Macro + Bénassy-Quéré, Coupet & Mayer (2007) OECD Advanced economies Macro + Dellis, Sondermann & Vansteenkiste (2017)
110 countries Macro + Peres, Ameer & Xu (2018)
Bureaucracy 52 countries Macro -
Bénassy-Quéré, Coupet & Mayer (2007) 47 regions in five EU
countries Micro 0 Basile, Castellani & Zanfei (2009)
Regime type (democracy)
44 countries Macro + Biswas (2002)
114 countries Macro + Jensen (2003)
33 OECD members Macro + Wisniewski & Pathan (2014) 168 countries Macro + Chanegriha, Stewart & Tsoukis (2017)
Investment incentives
50 regions of 8 EU countries Micro + Basile Castellani & Zanfei (2008) 47 regions in five EU
countries Micro + Basile, Castellani & Zanfei (2009) Albania Micro + Bitzenis & Szamosi (2009)
12 2.4. Survey studies on FDI barriers in Europe
After identifying some aspects that may have a negative effect on FDI, it is essential to analyse empirical research that focus on the FDI barriers in the EU on a firm-level. Although most literature concentrates on the determinants, it has also become important to study the barriers to internationalization, since, according to Baum, Schwens & Kabst (2011), they limit firm’s foreign expansion.
Adapting the definition of export barriers by Leonidou (2005), we can define barriers to FDI as all the factors that create difficulties to the beginning, the development and the sustainability of the firm’s foreign operations.
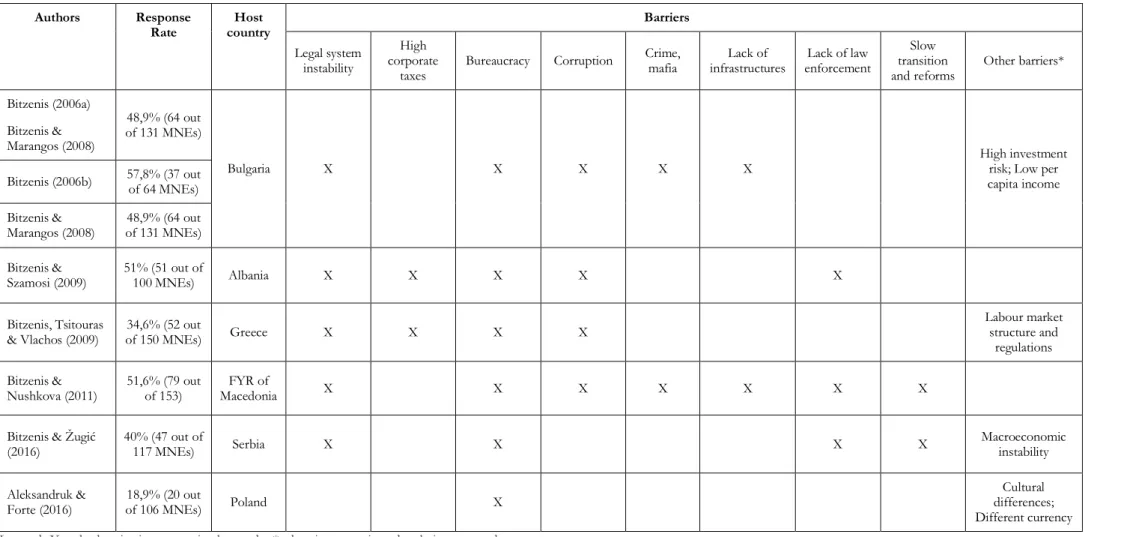
A deep research was conducted on the principal scientific literature databases, Scopus and Web of Science, using keywords such as “FDI barriers”, “FDI obstacles” and “Barriers to internationalization”, in order to find studies that focused on the FDI barriers on a firm-level. The research found only 8 survey studies that corresponded to countries located in Europe (Table 3).
Firstly, it was found three studies focusing on the FDI barriers in Bulgaria, based on questionnaires sent between 1998-1999 to foreign firms investing in the country. These three studies were based on questionnaires answered by 64 out of 131 MNEs that invested in Bulgaria, corresponding to 48,9% of response rate. In the first study, according to Bitzenis (2006a), its unstable legal framework, related with the lack of efficient laws and constant changes of the legal framework, is the most important barrier. Also, bureaucracy and corruption are seen as important barriers to the firms. However, in the case of corruption, the author also includes problems of organised crime related to illegal activities, which is one of the biggest problems that Bulgaria faces and that creates a higher risk to investors. The high investment risk and the limited purchasing power and low GDP per capita are also seen as one of the most important barriers for more than 50% of the multinationals that answered the survey. The other study conducted by the same author, but only focusing on 37 Greek MNEs in Bulgaria that answered the questionnaire, shows similar results, but in a different order (Bitzenis, 2006b). For the Greek firms, corruption, crime and mafia activity, the unstable legal system, bureaucracy, the low per capita income and the high investment risk were identified as the main barriers to FDI in Bulgaria. In addition, in the last study about Bulgaria (Bitzenis & Marangos, 2008), 52% of the MNE’s stated that their investment in this country was of high risk.
13 Table 3. Survey studies on barriers to FDI in Europe
Authors Response
Rate country Host Barriers
Legal system instability
High corporate
taxes Bureaucracy Corruption
Crime,
mafia infrastructures Lack of enforcement Lack of law
Slow transition
and reforms Other barriers* Bitzenis (2006a)
Bitzenis & Marangos (2008)
48,9% (64 out of 131 MNEs)
Bulgaria X X X X X High investment risk; Low per
capita income Bitzenis (2006b) 57,8% (37 out of 64 MNEs)
Bitzenis &
Marangos (2008) of 131 MNEs) 48,9% (64 out Bitzenis &
Szamosi (2009) 51% (51 out of 100 MNEs) Albania X X X X X
Bitzenis, Tsitouras
& Vlachos (2009) of 150 MNEs) 34,6% (52 out Greece X X X X
Labour market structure and
regulations Bitzenis &
Nushkova (2011) 51,6% (79 out of 153) Macedonia FYR of X X X X X X X
Bitzenis & Žugić
(2016) 40% (47 out of 117 MNEs) Serbia X X X X Macroeconomic instability
Aleksandruk &
Forte (2016) of 106 MNEs) 18,9% (20 out Poland X
Cultural differences; Different currency
14
In a work published about Albania, that is in the process to access the EU, and based on a questionnaire answered by 51 MNEs out of 100 MNEs that invested in the country (corresponding to more than 51% of response rate), Bitzenis & Szamosi (2009) concluded that most of those foreign firms identified bureaucracy and corruption as the main barriers to invest in this country. In the same study, other factors such as high value-added tax, unstable legal framework, lack of transparency, excessive taxation, and lack of law efficiency were also seen as important constrains.
Other study published about FDI in Greece shows the response of 52 out of 150 MNEs that invested in that country, corresponding to 34,6% response rate (Bitzenis, Tsitouras & Vlachos, 2009). More than 50% of the MNEs selected bureaucracy, due to the slow process to transfer property rights, taxation system, corruption, corporate tax, the labour market structure and the unstable legal system, due to restrictive labour laws, as the main barriers. Macroeconomic instability was a barrier for only 19% of the MNEs, which means that it was an insignificant obstacle to firms. However, the study was conducted in order to consider barriers between 1995 and 2003, which means that nowadays the results could be different, mainly due to the financial crisis of 2008 that affected Greece’s economy. A research about obstacles in FYR of Macedonia conducted by Bitzenis & Nushkova (2011), which had a response rate of 51,6%, 79 out of 153 MNEs investing in the country, is in line with the other studies about transition economies. The results shown that bureaucracy, corruption, bribery, economic crime, mafia, lack of enforcement of law, slow transition and reforms, unstable legal system, lack of business infrastructures and unfavourable economic climate for investments were considered as the key obstacles by more than 50% of the MNE’s. Nevertheless, contrary to the other studies, Bitzenis & Nushkova (2011) deepen the analysis of barriers, seeking to understand the perception of barriers from different perspectives, considering the industry of the company in the manufacturing sector, the country of origin (Greece, Germany, USA, Austria, Netherlands, Cyprus and Turkey) and the export orientation of the company. The study finds that bureaucratic and administrative constrains are the most important for almost all industries and origin countries. Then, after identifying some differences in other barriers, e.g. in corruption, which is important for only three of the eight industries analysed and for all investors’ countries, except Austria, the authors analyse the differences among the three major industries and countries of origin. Bitzenis & Nushkova (2011) show that there are
15
significant differences in three obstacles (insufficient local market growth, low economic growth and insufficient legal and administrative framework) between textiles and textile products industry, food products, beverages, and tobacco industry and basic metal and fabricated metal products industry. In addition, the authors show that Greece, Germany and the USA (the major investor countries) have significant differences in nine obstacles. They also conclude that textiles and textile products industry and Greek investors are the least affected by most of the obstacles that the other industries or investor countries.
More recently, a study about FDI barriers in Serbia was conducted by Bitzenis & Žugić (2016). Serbia is one of the candidates to be part of the EU member states. A questionnaire was answered by 47 out of 117 MNEs investing in manufacturing sector in Serbia, corresponding to 40% response rate. The firms that completed the questionnaire selected bureaucracy as the most important barrier. Then, exchange rate volatility and inflation level were also on the top of barriers, showing that macroeconomic stability is an important factor for foreign companies. Finally, lack of efficient laws and the slow progress in the reforms are also seen as obstacles to those firms. Contrary to the other studies, constrains related to corruption and crime were mentioned by a lower number of firms.
The last study is about Portuguese firms investing in Poland by Aleksandruk & Forte (2016). The work had 18,9% response rate (20 out of 106 MNEs). Despite having a small sample size, it is an exploratory study that addresses the issue of FDI barriers through a firm-level analysis. Barriers related to cultural factors, such as different languages and culture were the most important to Portuguese firms investing in Poland. Bureaucracy and different currency, since Poland does not use the euro, were also considered important barriers.
To sum up, considering the studies mentioned, it can be concluded that barriers are mostly related to macroeconomic, political and institutional instability and cultural differences. Political and institutional factors were the most important barriers in transition economies, with bureaucracy and corruption seen as the greatest barriers in almost every work. Institutional factors related to the instability of the legal framework and the lack law enforcement were also the most mentioned by firms. Concerning macroeconomic instability, only in the case of Serbia exchange rate volatility and inflation level were mentioned. In the case of Bulgaria, high investment risk and low per capita income were also seen as important barriers. Considering cultural factors, in the case of Poland the language and cultural differences were important aspects. It is important to underline that the works mentioned
16
are microeconomic studies based on surveys and that seven out of the eight have an author in common (A. Bitzenis) and are about transition economies. Besides that, the studies also have small sample sizes, which difficult the generalization of the conclusions. This shows that besides the lack of empirical research based on firm-level data, studies focusing on the European Union are rare.
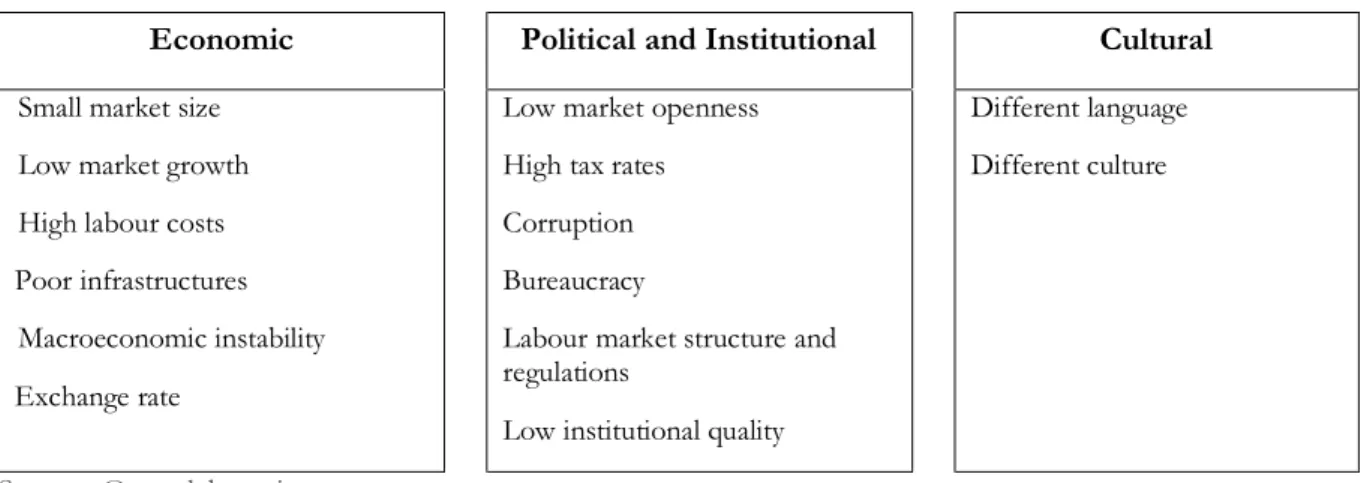
After analysing several studies on the determinants and the barriers to FDI location, it is possible to understand and summarise the main constrains that MNE’s can find in the host country (table 4). In the literature on the FDI determinants, it was possible to conclude that, small market size, low market growth, high labour costs, poor infrastructures, macroeconomic instability, exchange rate, low market openness, high tax rates, corruption, poor rule of law and bureaucracy, in most cases may have a negative effect on FDI. In addition, it is important to underline that some of the barriers identified in the macro studies were also found in the micro level studies, which is the case of high tax rates, macroeconomic instability, related to inflation, exchange rate, bureaucracy and corruption. Furthermore, micro studies also highlight institutional quality factors, such as the instability of the legal framework and the lack of law enforcement, labour market structure and regulations, language and cultural differences as important barriers found by firms that invested in European transition economies. However, it is interesting to note that the studies focusing on the determinants on a macro level put more emphasis on economic factors, while in the micro studies on the barriers, political and institutional factors seem to affect more the firm’s investment in Europe.
Table 4. Barriers to FDI location
Economic Political and Institutional Cultural
Small market size Low market growth High labour costs Poor infrastructures
Macroeconomic instability Exchange rate
Low market openness High tax rates Corruption Bureaucracy
Labour market structure and regulations
Low institutional quality
Different language Different culture
17
2.5. Research Hypothesis
Considering economic factors, according to Peres et al. (2018), economic growth has a positive impact on FDI both on developed and developing countries. Since the beginning of the 21th century, European Union has faced many ups and downs of the GDP growth annual rate. During the financial crisis years 2008-2009, GDP growth around the world has faced a large decline and the European Union was one of the regions that mostly suffered, with a decline from 3.0% in 2007 to -4.0% in 2009 (World Bank, 2017a).
According to UN (2014), in the years that followed the financial crisis of 2008-2009, there was a large environment of uncertainty, weak demand and funding constrains, especially in countries in crisis, which led to an abrupt decrease in investment. In fact, FDI inflows fell from 9,5% of EU’s GDP in 2007 to 2,6% in 2009 and in the following years it didn’t pass 5% (World Bank, 2017b). Nowadays, EU’s economy is stronger and GDP growth is around 2%, especially due to the increasing domestic consumption, and even in the EU members from Eastern Europe and Baltic States, economic growth is above the EU’s average (UN, 2018). However, the economic growth slowdown of the crisis years and the decline on the FDI inflows indicate that these two factors can be related, and that economic growth can have affected negatively FDI in EU. In this way, the first hypothesis is:
H1: Low economic growth is a barrier to firm’s FDI location in EU
Relatively to labour costs, most studies find that they have a negative effect on FDI. Considering European Union, there is a large difference among the countries, since, according to Eurostat (2019), in 2018 hourly labour costs range between EUR 5,40 in Bulgaria to EUR 43,50 in Denmark. According to the World Bank (2017b), the importance of FDI inflows as a percentage of countries’ GDP doesn’t differ much between developed and transition economies, although the percentage in transition economies and in Southern European countries are usually higher. According to Bellak, Leibrecht & Riedl (2008), in Central and Eastern European (CEE) countries high labour costs affect FDI. In addition, a recent study found that low labour costs in OECD are mainly important to firms in the manufacturing sector, which can be explained by the search of cheaper labour in order to reduce production costs (Bayraktar-Sağlam & Böke, 2017). Considering what was mentioned and the literature review on the determinants of FDI location, it can be concluded that high labour costs may affect negatively FDI in the European Union. At the same time, considering
18
the labour market, one of the barriers that were found in the literature review was the labour market structure and the labour market regulations. According to the Lithuanian Free Market Institute (2017), countries with higher levels of labour protection tend to have a lower growth of productivity, since it discourages the creation of jobs, reduces the employment opportunities and increases the unemployment, influences entry and exit costs of the companies and on labour force adjustments, which affects the decision of companies to enter or leave the market. The employment flexibility index of 2018 (with scores from 0 to 100) shows that there are major differences among the European Union. Countries like Denmark, United Kingdom, Ireland and Czech Republic have higher levels of flexibility (above 80) and countries like Portugal, Luxembourg and France have lower levels of flexibility (under 50) (Lithuanian Free Market Institute, 2017). This shows that, although in some countries this is not an issue, there are countries in the EU where labour regulations are stricter and may affect and constrain the entrance of FDI. The hypotheses are:
H2a: High labour costs are obstacles to MNEs investment in European Union H2b: Labour market structure and regulations are obstacles to FDI in European Union
Considering political and institutional factors, corruption was one of the barriers mostly chosen by firms investing in transition economies. According to the Corruption Perceptions Index of 20183 (Transparency International, 2018), most European Union countries
are above the list as the most transparent countries in the world, with Denmark as de clear leader. However, some countries, especially located in southern, central and eastern Europe have higher rates of corruption, such as Greece, Bulgaria and Hungary, that have dropped some places in comparison with 2017, which shows that corruption is still a problem in those countries (Transparency International, 2018). At the same time, although only a few macro studies analysed recognised bureaucracy as having a negative effect on FDI, bureaucracy was one of the obstacles mostly felt by firms in transition economies in the survey studies on the barriers to FDI analysed. In this way, the third and fourth hypothesis are:
H3: Corruption is an obstacle to FDI in European Union countries H4: Bureaucracy is a constrain to FDI in European Union countries
19
In terms of tax rates, in comparison with other advanced economies, the EU has a high tax level (European commission, 2017a). However, it changes from each Member State, with countries like Denmark, France and Belgium with high tax rates revenues and countries like Ireland, Romania and Bulgaria with lower tax rates revenues. Considering what was mentioned, the fifth hypothesis is:
H5: Corporate taxes are obstacles to FDI in European Union countries
It is also important to take into consideration data about restrictions on FDI in European Union. At this level, OECD has created the FDI restrictiveness index, in which four types of restrictions are analysed: foreign equity restrictions, screening mechanisms, restrictions on foreign personnel and operational restrictions4. Although it differs from
country to country, generally restrictions to FDI in the EU are lower than the OECD average (Caccia & Pavlova 2018). According to Caccia & Pavlova (2018), restrictions are higher in Austria, Poland, France, Sweden, Italy and Slovakia, while in Luxembourg, Slovenia and Portugal they are almost inexistent. At the same time, constrains are mostly felt in primary and in services sectors and not in the manufacturing sector. According to OECD (2017), there is the tendency of larger countries to have higher restrictions, mainly because they are richer in natural resources and have larger markets. Some countries are still imposing screening mechanisms, mainly due to national security concerns and even EU has recently approved a foreign investment screening framework to be implemented (OECD, 2017; European Commission, 2019). Golub (2003) defines the restrictions that are normally implemented. One of those constrains is the restriction on foreign ownership, in which there is a limitation to less of 50% on the share of a firm’s equity capital to foreign investors in sectors that are important to the country’s economy (Golub, 2003). Obligatory screening and approval procedures, by stipulating that foreign investors have to show economic benefits, can also be an obstacle to FDI location, since it may increase the cost of entry (Golub, 2003). Many other obstacles can be found, such as constrains on foreign personnel and the stipulation that nationals must form the majority of the board of directors (Golub, 2003). All these constrains may limit the firm’s foreign location. Thus, the sixth hypothesis is:
H6: Formal restrictions to foreign investment constrains MNEs investment in European Union countries
20
Finally, considering the literature review on the barriers to FDI, it is possible to understand that, although there are barriers identified in almost every study, such as bureaucracy, legal system instability and corruption, there are other important barriers that may differ according to the host country. For instance, and take into consideration the studies reviewed, high corporate taxes, was only found in Greece and Albania, lack of infrastructures, was only found in Bulgaria and FYR of Macedonia, labour market issues, was only found in Greece, and cultural differences, in Poland. This means that the constrains to FDI differ depending on the host country of the companies. Furthermore, as mentioned above, Caccia & Pavlova (2018), also show differences among the EU countries, since that formal restrictions are higher in countries like Austria, Poland, France, Sweden, Italy and Slovakia, and are almost inexistent in Luxembourg, Slovenia and Portugal. Considering the sector of activity, Bitzenis & Nushkova (2011) found that the perception of obstacles is different considering the different industries in the manufacturing sector. At the same time, Caccia & Pavlova (2018) identify differences at the sectoral level in the EU. According to the authors, restrictions on FDI are more significant in the primary sector and in the services sector, while in the manufacturing sector are practically inexistent. This indicates that the barriers to FDI also differ considering the sector of activity. Bitzenis & Nushkova (2011) also found that, besides the differences among industries, the obstacles perceived by the companies are also different considering the investors’ country of origin. Other variable that is also important to consider is the mode of establishment. According to Davies, Desbordes & Ray (2018), Greenfield investments and mergers and acquisitions respond differently to barriers in the host country. While Greenfield investments are more sensitive to taxes, for M&A weak institutions and a low financial development of the host country are more significant. To some up, all the variables mentioned (location of the company, sector of activity, country of origin of the investor and the mode of establishment) are important to understand the barriers perceived by the companies. Considering this, the last hypotheses are:
H7: The perception of obstacles differs depending on the location of the company H8: The perception of obstacles differs depending on the mode of establishment
H9: The perception of obstacles differs depending on the sector of activity H10: The perception of obstacles differs depending on the country of origin of the investor
21
3. Methodology
This work aims to identify the barriers to Foreign Direct Investment in the European Union and to analyse their differences considering different groups. This chapter is divided into two sections, where there is a detailed description of the research methodology and data collection methods. In the first section, there is a brief description of the research method and the questionnaire implemented in this study (section 3.1). In the second section, there is a complete description and characterization of the sample under study (section 3.2).
3.1. Research method and questionnaire design
According to Yin (2009), when the research question is “what”, “who” or “where”, the data analysis and survey methods are more likely to be used, in order to explain a phenomenon, while in “how” and “why” questions, qualitative methodology is more likely to be used (e.g. case study). Since the research question of this study is “What are the barriers to FDI in the European Union”, a qualitative methodology will be followed and hypothesis testing will be used to understand if there are significant differences in the type of barriers perceived depending on the company's location, industry, mode of establishment and country of origin.
The data will be collected through a questionnaire survey. Besides being easier to collect data from a larger sample and giving the possibility to analyse opinions, as stated by Bell (1993), questionnaires are a quicker and cheaper way to collect information. For those reasons, this investigation is based on primary source of data collected through a questionnaire sent by e-mail to firms located in the European Union controlled by a foreign shareholder that owned more than 50% of direct or total participation in the company. The questionnaire design was based on the literature review on the barriers to FDI and was written in English. Then, it was translated into Spanish, German and French, since they are important languages in the European Union.
The questionnaire was divided into three parts. The first part of the survey contains important questions to characterize the company (e.g. number of employees, location), to understand the mode of establishment (e.g. Greenfield investment vs M&A, the percentage detained) and its origin (e.g. the year of investment, location of the main foreign investor).
22
The second part is crucial to understand the barriers to FDI that companies have been encountering in their investment. To achieve that we asked them to express their level of agreement, from 1 to 5 (1 - strongly disagree; 2- disagree; 3- neither agree or disagree 4 – agree; 5 – strongly agree), on the 20 listed factors that had potentially affected their investment. In order to complement this part, it was given the possibility to specify other barriers not mentioned on the list and it was requested to indicate, in order of importance, the three most important barriers founded.
Finally, the last part attempts to find if the foreign direct investor pretends to continue to invest in the European Union and the degree of importance of the subsidiary’s activities to the foreign direct investor. The full questionnaire is available on Annex 1.
3.2 Characterization of the sample
In this study, the target population are firms located in the European Union (EU) that have a foreign primary owner/principal shareholder from a country outside the EU. The database selected to obtain the list of companies was Amadeus – Bureau van Dijk, which contains information and financial data about public and private companies located in Europe.
In order to guarantee that the main foreign investor had influence in the management of the company and in the decision-making process, only the European Union firms controlled by a foreign shareholder that owned more than 50% of direct or total participation in the company were collected from the database and made part of the initial list. The data was collected from Amadeus – Bureau van Dijk on 12th of March of 2019 and there was a
total of 808.210 firms. From those, the database provided the e-mail address of only 179.865 companies. Then, the list was reduced to 9877 companies by removing the micro-firms (with 10 or less than 10 employees), all the firms whose investor was from an European Union country and the firms with a date of incorporation before 20105. Only companies that had
their information updated in the database at least in 2017 were considered.
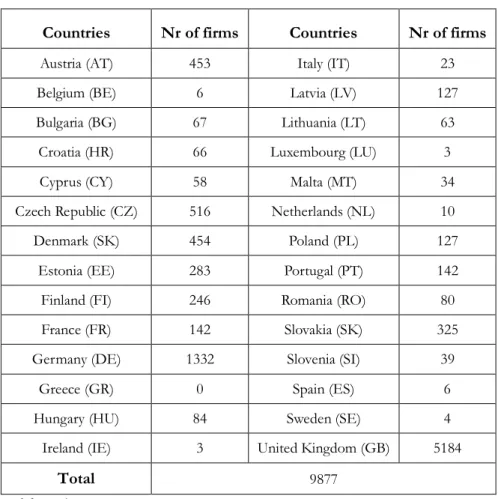
The table 5 shows the 9877 companies of the final list distributed in each country of the European Union. However, there are several differences on the number of companies in
5 The year of establishment after 2010 was chosen to guarantee that the investment was recently made and thereby collect and analyse recent information on the barriers to FDI in the European Union.
23
each country. While there are countries with a high number of firms, such as the United Kingdom, Germany, Czech Republic, Denmark and Austria, there are countries with 10 firms or less, such as the Netherlands, Belgium, Spain, Sweden, Ireland and Luxembourg. In addition, following the reduction of the list by the above criteria, the number of companies located in Greece has been reduced to 0, being the only country without a company on the final list. Some of these numbers, that will be discussed below, are in line with the FDI inflows statistics in the EU, while others show the weaknesses and discrepancies in the database from which companies were collected.
Table 5. Number of firms per country
Countries Nr of firms Countries Nr of firms
Austria (AT) 453 Italy (IT) 23
Belgium (BE) 6 Latvia (LV) 127
Bulgaria (BG) 67 Lithuania (LT) 63
Croatia (HR) 66 Luxembourg (LU) 3
Cyprus (CY) 58 Malta (MT) 34
Czech Republic (CZ) 516 Netherlands (NL) 10
Denmark (SK) 454 Poland (PL) 127
Estonia (EE) 283 Portugal (PT) 142
Finland (FI) 246 Romania (RO) 80
France (FR) 142 Slovakia (SK) 325
Germany (DE) 1332 Slovenia (SI) 39
Greece (GR) 0 Spain (ES) 6
Hungary (HU) 84 Sweden (SE) 4
Ireland (IE) 3 United Kingdom (GB) 5184
Total 9877
Source: own elaboration
From 2008 to 2010, European Union FDI flows were significantly affected by the global crisis (Eurostat, 2013). Hence, although there were some signs of recovery in the EU, according to the Sunesen & Grunfelder (2018) report, even after the crisis period there was a slight decrease of the value of the total FDI inflows from non-European Union (non-EU) investors in the European Union. Nevertheless, the report highlights the case of the United Kingdom, that during the crisis and after-crisis period was capable to attract a great share of
24
non-EU FDI inflows, which were mostly from the USA. This may explain why the UK is the country of the list with the largest number of companies. Among the other European Union countries, Germany, the Netherlands and France were the countries that also attracted a higher value of FDI inflows (Sunesen & Grunfelder, 2018). Yet, although Germany has a high number of companies on the list, France and, principally, the Netherlands are far below the number of companies that would be expected.
Furthermore, Ireland and Southern European countries, such as Greece, Portugal, Spain and Cyprus, were the most affected by the financial crisis and suffered years of austerity in order to reduce their debt (Zamora-Kapoor & Coller, 2014; Georgia & Theodore, 2018). In the case of Greece, besides the reduction of FDI inflows from more than 4.400 million US dollars in 2008 to only 330 million US dollars in 2010 and less than 1.800 million US dollars in 2011, 2012 and 2015, according to OECD (2019b) and Bank of Greece (2017), FDI inflows to Greece come principally from EU countries, such as Germany, Luxembourg and the Netherlands, which may explain why there are zero companies on the list. Other countries with a lower number of companies on the list are Ireland, Luxembourg, Sweden, Spain and Belgium. Considering OECD (2019b) statistics, the low number of companies in Belgium and Sweden may also be explained by a large fall of FDI inflows, in which Belgium fell from more than 70.00 million US dollars in 2011 to less than 7.000 million US dollars in 2012 and to negative numbers in 2014, and Sweden fell from more than 36.000 million US dollars in 2008 to only 141 million US Dollars in 2010 and less than 10.000 million US dollars in 2013, 2014 and 2015. However, the other three countries show high numbers, specially Ireland. Although a great part of the FDI inflows to these countries are from EU countries, non-EU countries, such as the USA, are also big investors, considering OECD (2019b). This helps to understand some of the fragilities of the Amadeus – Bureau van Dijk database. Although the number of companies has been reduced by considering only investors from outside the EU, some countries have very few companies considering what would be expected from global data.
The questionnaire was transferred to the Google Forms program and sent by e-mail to the in four different days. The e-mails were first sent to the 9877 companies on April 24th
of 2019 and were resent on three different dates: 27th of May, 14th of June and 26th of June
2019. It was requested that the questionnaire was answered by the subsidiary’s manager or someone from the headquarter related to the subsidiary’s management. During the whole
25
process, there was 1429 delivery failures, 252 e-mails that didn’t exist, 73 e-mails blocked, 20 enterprises answered that they didn’t want to participate in the research and 4 answered informing that the company didn’t have a foreign investor. Thus, 1778 firms were excluded from the initial list, which resulted in a final list of 8099 firms.
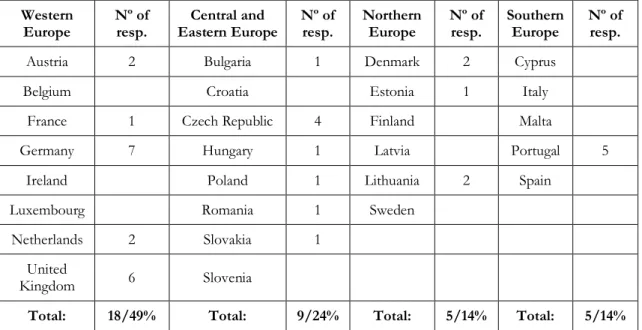
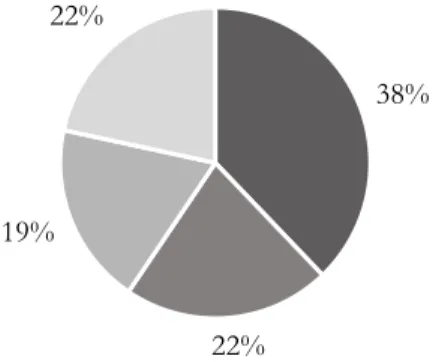
The process of sending the emails lasted two months and, despite all the email resends, resulted in only a total of 43 replies, which corresponds to a response rate of 0,5%. However, 6 of them were excluded since they decided not to give information about the barriers that had potentially affected the investment. Thus, the final sample consists of 37 companies, most of which are located in Western Europe (see table 3).
About the location of the companies, traditionally, Europe is divided into, at least, four regions: Western Europe, Central and Eastern Europe (CEE), Northern Europe and Southern Europe. According to this regional division, based on EuroVoc (2019), the countries will be separated into four groups (table 6).
Table 6. Number of responses per group of countries
Western
Europe Nº of resp. Eastern Europe Central and Nº of resp. Northern Europe Nº of resp. Southern Europe Nº of resp.
Austria 2 Bulgaria 1 Denmark 2 Cyprus
Belgium Croatia Estonia 1 Italy
France 1 Czech Republic 4 Finland Malta
Germany 7 Hungary 1 Latvia Portugal 5
Ireland Poland 1 Lithuania 2 Spain
Luxembourg Romania 1 Sweden
Netherlands 2 Slovakia 1
United
Kingdom 6 Slovenia
Total: 18/49% Total: 9/24% Total: 5/14% Total: 5/14%
Source: Own elaboration based on the data obtained from the questionnaire’s answers
The study sample includes companies from every European region (see table 6). Almost half of the responses (49%) that will be analysed are from Western European countries, with Germany and United Kingdom representing more than 70% of the responses of the region. Then, CEE countries correspond to 24% and Northern and Southern countries to 14% of the responses each.