Original scientiic paper
UDC: 339.727.22:323.28>(4-67 EU) doi: 10.18045/zbefri.2016.2.333
The impact of terrorism on the FDI of the EU
and EEA Countries
*1Heri Bezić
2, Tomislav Galović
3, Petar Mišević
4Abstract
The key goal of this research is to empirically determine the effects of terrorism on FDI of the selected EU and EEA member countries. The methodology is based on a system-GMM estimator for dynamic panel data models on a sample covering up to 29 countries, and 13-year periods from 2000 to 2013. The main results conirm that terrorism incidents, economic and institutional variables are found to depress FDI of analysed EU and EEA countries. It can be concluded that terrorism and institutional stability are most inluential on FDI inlows of the observed EU and EEA countries. The results indicate that terrorist activities reduce security and conidence of investors in countries exposed to terrorist activities, reducing the inlow of foreign direct investment. The recommendations and proposals are given based on the results of empirical analysis.
Key words: terrorism, GMM estimator, FDI, EU, EEA JEL classiication: F52, F59, F21, F62
* Received: 23-09-2016; accepted: 09-12-2016
1 Research has been fully supported by the University of Rijeka under the project number 13.02.1.3.13.
2 Full Professor, University of Rijeka, Faculty of Economics, Ivana Filipovića 4, 51000 Rijeka,
Croatia. Scientiic afiliation: technological policy and competitiveness, international business. Phone: + 385 51 355 148. E-mail: [email protected].
3 Assistant Professor, University of Rijeka, Faculty of Economics, Ivana Filipovića 4, 51000
Rijeka, Croatia. Scientiic afiliation: technological policy and competitiveness, international business. Phone: + 385 51 355 155. E-mail: [email protected].
4 PhD, Employed at Croatian Chamber of Commerce, Roosvelt Square 2, 10000 Zagreb, Croatia.
1. Introduction
Due to its topicality, terrorism has been gaining in importance in the context of scientiic and professional discussions. The events that occurred in the European Union in 2015 and 2016 (terrorist activities in France, Belgium, Germany, etc.) additionally underline the importance of the prevention of terrorism by strengthening national security and economic activities of the countries.
Terrorism is a violent act that has certain characteristics. It is primarily an act that carries a message that refers to the the objectives and intentions of the executor of the terrorist act. For this reason, after a terrorist attack, terrorists take responsibility for the terrorist act. Another important characteristic of terrorism is fear and causing fear. It is a desired effect in order to achieve an objective.
Foreign direct investment (FDI) is one of the main generators of economic development. Its inlow has a strong inluence on a country’s economy. In other words, terrorist activities reduce security and investors’ conidence in countries exposed to terrorist activities, reducing the inlow of foreign direct investment. On the other hand, the costs of anti-terrorist security burden the economy and reduce its economic potential. The economic effects of international terrorism are evident in the short and long run. In the short run, terrorism results in material losses, casualties and creation of a negative investment climate. In the long run, international terrorism affects the price increase due to increased spending on national security and anti-terrorist activities. In this way, security costs are incurred by all users of products in the international market, in addition to the country threatened by terrorism.
The research is based on the hypothesis that terrorism and terrorist activities have a negative impact on the inlow of foreign direct investment in the selected countries of the European Union (EU) and countries of the European Economic Area (EEA). The main objective of the research is to systematically analyse and deine institutional, economic, natural and terrorism factors and test their impact on FDI inlow in the selected countries and propose measures to improve security in order to create a safe investment environment.
2. Literature review
Terrorism and related implications are covered by a number of research and scientiic discussions. The previous research presented below covers the topical issues of tackling the problem of terrorism and its economic repercussions.
Scientiic research, mostly by foreign authors is a proof of the growing interest of scientists in the study of the impact of terrorism on security and FDI inlow. The interest is especially encouraged by current acts of terrorism (September 11, Madrid, London, the Middle East, but also events in Ukraine). Economic causes and effects of international terrorism are examined as well as various economic aspects of the lack of a uniied security policy. Previous analysis of economic consequences of terrorist activities presented by some authors has not suficiently contributed to the creation of economic models aimed at measuring the effects of terrorist activities, which should have been the end results of these analyses. The impact of terrorism on the inlow of FDI is still an insuficiently analysed topic, and this is a theoretical and practical justiication of this research. The research conducted by Abadie and Gandeazab (2003) is based on the insight into terrorist activities that have caused increased global insecurity with a negative impact on the distribution and transfer of capital and investment inlow in different countries. The world inancial system, due to globalisation effects and the removal of barriers to the free movement of factors of production, is becoming more open. Alomar and El-Sakka (2011) have, on the basis of research conducted in 136 developing countries, found a negative impact of terrorism on FDI inlow. Tavares (2004) found in his research that increased activities of international terrorism also affect the economic development of the country at risk of terrorism. He measured the damage caused by terrorist activities to the economies of developing countries. Furthermore, he proved that intensiied terrorist activities result in a reduction of tax and general total government revenues in some countries, which has a negative impact on their economies.
(2009) analysed the role of economic performance in determining terrorist violence of terrorism.The indings conirmed that economies under attack are successful in adjusting to the threats of terror, soeconomic growth is not impaired.
Furthermore, the results of a study (Pizam and Fleisher, 2001) conducted on the impact of acts of terrorism on tourism demand in Israel during the period of May 1991-May 2001, conirmed that the frequency of acts of terrorism had caused a larger decline in international tourist arrivals than the severity of these acts. The implications of this study are that tourist destinations can recover from even severe acts of terrorism, as long as the terrorist acts are not repeated.
On the other hand, Lutz and Lutz (2014) proved that terrorism did not have the expected effects on international economic activities in sub-Saharan Africa. For the region as a whole, there was very little indication that terrorism, either in terms of incidents or fatalities had the anticipated negative effects on foreign investment and foreign visits.
The negative impact of terrorism on economic growth was covered by James et al. (2006) and concluded that the private sector and foreign investment are more severely affected by the uncertainty and dangers of terrorism. This study shows a positive correlaton between the new inlow of foreign investment and economic growth in each country.
The cost effects of terrorism on individual countries can be viewed from several aspects. The most important ones relate to the lack of FDI and their redirection to other countries, devastation of infrastructure, investment of public funds into increasing security rather than investing in development, and trade restrictions. Developing countries that are more dependent on foreign capital are facing reduced economic growth caused by the reduced inlow of FDI. As civil war may affect the outlow of capital from a country (Collier and Sambanis, 2002), suficiently strong terrorist activity can reduce the inlow of capital (Enders; Sandler, 1996).
of other forms of insecurity/violence on FDI. The research results, for the most part applicable to developing countries, show how insecurity/violence in the host countries has a negative and signiicant impact on FDI while on the other hand, insecurity/violence in the country of origin results in an outlow of FDI.
Taking into account investment determinants, Tarzi in 2005 tried to identify the key factors of investment inlow in a particular country, i.e. to determine why certain developing countries have high FDI inlows, while inlows in other countries are minimal. The most important identiied factors are market size, market growth rate, competitiveness of the economy, infrastructure, and productivity of the employees. Also, the author points out the importance of legislation in the host country with a particular focus on the policies that encourage investment, taxation, repatriation, rules for property acquisition for foreign citizens, FDI regulations, labour policy, etc. He also took into account company characteristics, such as company size, business sector, types of industry, and strong and sustainable strategies. Emphasis was also placed on product differentiation factors, among which the most important are technology, brand, marketing activities, skills, logistics, and organisation, that can be the foundations of international competitiveness of a particular company. Finally, the research indicate far-reaching consequences of terrorist activities, not only on FDI, but also on other economic parametres such as the gross domestic product of other countries.
3. Methodology
The impact of terrorism on FDI is the basis for testing the impact of the factors by applying the system GMM two-step estimation of the dynamic panel model.
Two forms of dynamic estimators were developed on the basis of the GMM method: differentiated GMM estimator (Arellano and Bond, 1991) and system GMM estimator (Arellano and Bover, 1995; Blundell and Bond, 1998). Differentiated and system GMM estimators have been created for the purpose of dynamic panel analysis and have certain assumptions of data generating process (Roodman, 2009), which should be considered, i.e. that:
– There is a possibility of autonomously distributed individual time-invariant effects. Such a situation is contrary to the temporal regression model;
– Some of the regressors can be endogenous,
– The occurrence must be dynamic in nature, with the realisation of the current dependent variable that is inluenced by the variable from former periods, – Idiosyncratic disorders (except for time-invariant effects) have speciic forms
– Idiosyncratic disorders are uncorrelated between individual variables.
The dynamic model with a single time-shifted (lagged) variable can be shown by the following equation (1):
yit = βyt – 1 + ui + vit, |β| < 1 (1)
wherein yit is the value of the dependent variable also in the period t; yt–1 is the
dependent variable with a shift (lag) for one period; ui are individual time-invariant
effects, and vit is a random error. Individual impacts are treated as stochastic, and
further assumption that is crucial for the consistency of the model is that errors vit
are serially uncorrelated. Individual time-invariant effects are initially associated with the former inluence of the dependent variable of the model, which points to the above-mentioned problem of endogeneity.
In exceptional cases, when there is no serial correlation (autocorrelation) in the random error, lagged differences i.e. shifts of endogenous variables can be included as instruments of the model (Arellano and Bond, 1991; Greene, 2005; Stojčić et al., 2011; Stojčić and Hashi, 2011; Stojčić et al., 2012).
It is expected that the research will show signiicant impact of terrorism on incoming FDI per capita in the observed group of EU countries and EEA countries. It is not expected that the role of natural disasters on incoming FDI per capita will be signiicant. Furthermore, it is assumed that the economic variable GDP per capita has a certain effect in the context of an increase in the incoming FDI per capita. The variable of capital openness and inancial climate should have a positive sign, but also a great impact on incoming FDI per capita. FDI is a process that develops over time. Proving the above predictions may provide an answer to the question of signiicance of the impact of terrorism on the FDI of the selected EU and EEA countries. These assumptions of the empirical part will be subjected to econometric testing in order to conirm the main hypotesis of the research. Based on the given model, relevant variables are selected and tested. The econometric model is as follows:
FDIpcit = β0 + β1FDIpc(–1)i(t–1) – β1INCIDENTSit – β2DISASTERSit +
+ β4GDPpcit + β5ka_openit +
t=
∑
20132002godinat
+ uit + vit (2)
The state of incoming foreign direct investment per capita (FDIpc) is selected to
direct investment. For example, Enders and Sandler (1996) observed countries such as Greece and Spain. Their results showed the decline in net FDI inlow by 13.5% and 11.9%, which was caused by the terrorist attacks in the period between 1975 and 1995. Enders, Sachsida and Sandler (2006) used time series analysis and panel analysis by which they proved the negative impact of international terrorism on American direct investment outlows. Filer and Stanišić (2012) analysed the impact of terrorism on capital inlows of 160 countries over a period of 25 years. The authors conclude that terrorist attacks can signiicantly reduce the foreign direct investment low with no effect on foreign debt and investment portfolio.
The following variables were selected as independent variables of the model, including the natural logarithm of the state of incoming foreign direct investment from the previous year (FDIpc(-1)), the number of incidents (INCIDENTS), GDP per capita (GDPpc), the KAOPEN Index (ka_open), and natural disasters (DISASTERS). FDIpc(-1) represents the state of incoming foreign direct investment per capita in the previous year and, simultaneously, the time-shifted variable.
Another independent variable is the INCIDENTS variable that represents the
total number of terrorist attacks, i.e. incidents. The data were collected from the reference database Global Terrorism Database (2015). A number of empirical studies (Kang and Lee, 2007; Agrawal, 2011; Bandyopadhyay et al. 2011; Filler and Stanišić, 2012; Shahbaz et al., 2013) include the number of terrorist incidents and/or casualties of terrorism as independent variables of the model. The conducted studies generally conirm the negative impact of terrorism on foreign direct
investment. Therefore, in this study, the variable INCIDENTS is selected, that
measures the impact of terrorism on foreign direct investment. The model includes
the economic variable GDP per capita (GDPpc) in the selected EU and EEA
inlow of FDI. The variable u indicates individual time-ixed effects, while v is the random error of the model. The impact of omitted variables is measured by the effects of the constant.
4. Empirical data and analysis
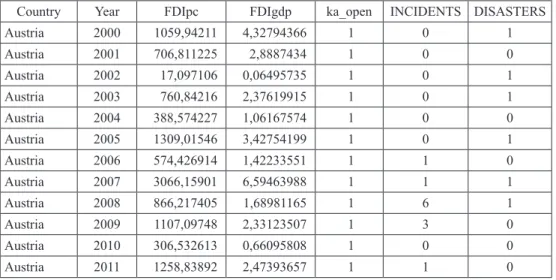
Empirical part of the research is based on secondary research by the authors. The research results relate to the period from 2000 to 2013. The econometric model consists of a total of 29 European economies at very high risk, high risk, medium risk, low risk, insigniicant risk, or no risk of terrorist attacks. The group of selected countries includes the EU and EEA Member States, i.e. Austria, Bulgaria, Cyprus, Croatia, the Czech Republic, Denmark, Estonia, Finland, France, Germany, Greece, Hungary, Ireland, Italy, Latvia, Lithuania, Malta, the Netherlands, Poland, Portugal, Romania, Slovakia, Slovenia, Spain, Sweden, the United Kingdom, Switzerland, Norway, and Iceland. The countries’ values are listed in Table A2 in Appendix. The classiication of the analysed countries is downloaded from the website of Crisis Management Web Analytics from 2015.
By using a dynamic model, the potential problems of endogeneity and measured errors can be eliminated by using instruments i.e. temporal shifts (lags) of the dependent variable. Implementation of the dynamic panel eliminates the problems that can affect reliability and assessment of the results of the empirical analysis. Diagnostics of the model is conducted irst, and the impact will be tested by the selection of the dynamic panel. The signiicance of the impact of terrorist incidents and other independent variables on FDI inlow is tested by using the system two-step GMM estimator. The dynamic panel analysis is based on the implementation of the econometric tool GRETL. The results monitor the impact of the selected independent variables of foreign direct investment from the previous year (FDIpc(-1)), the number of incidents (INCIDENTS), GDP per capita (GDPpc),
the values of KAOPEN Index (ka_open), and natural disasters (DISASTERS) on
the dependent variable FDIpc. The results of the assessment and diagnosis of the
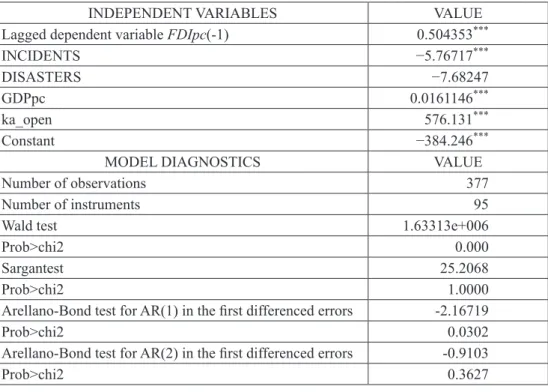
Table 1: Results of the Dynamic Panel of System GMM Estimator from 2000 to 2013*
INDEPENDENT VARIABLES VALUE Lagged dependent variable FDIpc(-1) 0.504353***
INCIDENTS −5.76717***
DISASTERS −7.68247
GDPpc 0.0161146***
ka_open 576.131***
Constant −384.246***
MODEL DIAGNOSTICS VALUE
Number of observations 377
Number of instruments 95
Wald test 1.63313e+006
Prob>chi2 0.000
Sargantest 25.2068
Prob>chi2 1.0000
Arellano-Bond test for AR(1) in the irst differenced errors -2.16719
Prob>chi2 0.0302
Arellano-Bond test for AR(2) in the irst differenced errors -0.9103
Prob>chi2 0.3627
Note: * dependent variable FDIpc. P-values in parentheses and labels *** indicate the level up to
1% signiicance. P-values were obtained by calculating the two-step dynamic procedure. Source: Authors’ calculations
Table 1 indicates following results. The results of the Wald test indicate a suficient explanatory power of the variables of the model, which is conirmed by the respective signiicance of the test. The synthesis of the diagnostics results leads to the conclusion that the model is speciied in the appropriate manner. It can be concluded that the model can be subjected to econometric testing of the impact of independent variables on the dependent variable.
5. Results and discussion
After reviewing the results of model diagnostics, the results are interpreted through GMM estimation. There is an evident positive and highly signiicant coeficient of temporally shifted (lagged) dependent variable FDIpc(-1), which supports the thesis that the current values are positively related to the previous realisations. In other words, the magnitude of the coeficient shows that a 1% increase in the value of incoming foreign direct investment per capita from the previous period results in an increase of 0.50% in the current period with provided constancy of other variables of the model. Incoming foreign direct investment per capita will be reduced by
5.76% if the variable number of incidents is increased by 1%, provided ceteris
paribus. The value of incoming foreign investments per capita results in an increase of 0.01% if GDP per capita is increased by 1% provided the constancy of other variables of the model. Incoming foreign direct investment per capita increases by
576.1% if the variable ka_open increases by 1%, provided the constancy of other
variables of the model. The DISASTERS variable has the expected sign, but its signiicance is unsatisfactory.
The results indicate a positive and statistically signiicant impact of terrorism on incoming FDI per capita. The impact of natural disasters on incoming FDI per capita is relatively weak and insigniicant. There is a recorded statistically signiicant impact of GDP per capita on the incoming FDI per capita. The highly signiicant impact of the KAOPEN Index on the incoming FDI per capita has been conirmed as well. According to which incoming FDI is a process that develops over a period of time. One should not ingore the fact that FDI may be the result of FDIs from previous periods. It is evident that direct foreign investment do not provide short-term tangible results. The signiicance of the lagged variable may indicate that previous FDI of a company provides a clear picture of a favourable investment climate in a country and further attracts other companies and their FDI. Since on the basis of the conducted research, by using the appropriate scientiically based methodology, the negative impact of terrorist activities on the inlow of foreign direct investment has been conirmed, conirmation of the basic hypothesis of the research also results from the conclusions listed below.
6. Conclusion
is threatened. However, it has to be stressed out that, in some cases, terrorism could affect positively on FDI, performance of some industrial sectors (maufacture of gun and armory) The application of the results of this research may contribute to a clearer perception of the impacts of terrorism on FDI. Ignoring the possibilities of occurrence of terrorist activities may have a long-term negative impact on the economic situation in a country. Terrorism has negative effects on the economic growth but this effect is depending about the social, political structure of observed country. In some cases of countries which unsucessfully confront to the effects of terrorism for periods of time, there is no relationship between terrorism and investments. Anyways, it cannot be applied on the EU case. Interruption of FDI inlow as one of the most important factors of savings affects slowdown of economic growth. Moreover, terrorism can be manifested through negative overlow effects on neighbouring countries by substantial withdrawal of capital. Ultimately, economic growth slows down, not only in one country, but also throughout the region.
References
Abadie, G. Gardeazabal, J. (2003) “The economic costs of conlicts: A case study
of the basque country”, The American Economic Review, Vol. 93, No. 1, pp.
113–132, doi: 10.3386/w8478.
Agrawal, S. (2011) “The Impact of Terrorism on Foreign Direct Investment: Which Sectors are More Vulnerable?”, CMC Senior Theses, Paper 124, available at: http:// scholarship.claremont.edu/cgi/viewcontent.cgi?article=1184&context=cmc_ theses.
Alomar, M., El-Sakka, T. (2011) “The Impact of Terrorism on the FDI Inlows to Less Developed Countries: A Panel Study”, European Journal of Economics, Finance and Administrative Sciences, Vol. 28., pp.116–125, available at: https:// www.researchgate.net/publication/287627707_The_impact_of_terrorism_on_
the_FDI_inlows_to_less_developed_countries_A_panel_study.
Arellano, M., Bond, S. (1991) “Some tests of speciication for panel data: Monte
Carlo evidence and an application to employment equations”, The Review of
Economic Studies, Vol. 58, No. 2. pp. 277–297, doi: 10.2307/2297968.
Arellano, M., Bover, O. (1995) “Another Look at the Instrumental Variable
Estimation of Error-Components Model”, Journal of Econometrics, Vol. 68,
No.1, pp. 29–51, doi: 10.1016/0304-4076(94)01642-d.
Bandyopadhyay, S., Sandler, T., Younas, J. (2011) “Foreign direct investment, aid,
and terrorism: an analysis of developing countries”, Federal Reserve Bank of
St. Louis, Working Paper 2011-004A, doi: 10.2139/ssrn.1745142.
Blomberg, B., Moby, A. (2005) “How Severly Does Violence Deter International
Investment?”, Claremont Colleges Economics Departments, Working Paper
Blomberg, S. B., Hess, G. D., Orphanides, A. (2003) “The macroeconomic
consequences of terrorism”, Journal of Monetary Economics, Vol. 51, No. 5,
pp. 1007–1032, doi: 10.1016/j.jmoneco.2004.04.001.
Blundell, R., Bond, S. (1998) “Initial Conditions and Moment Restrictions in
Dynamic Panel Data Models”, Journal of Econometrics, Vol. 87, No.1, pp.
115–143, doi: 10.1016/s0304-4076(98)00009-8.
Collier, P., Sambanis, N. (2002) “Understanding Civil Wars: A New Agenda”, Journal of
Conlict Resolution, Vol. 46, No. 1, pp. 3–12, doi: 10.1177/0022002702046001001. Crisis Management Web Analytics (2016), http://www.riskmap.aon.co.uk/
Terrorism_Risk_Map.aspx.
Drakos, K. (2004) “Terrorism-Induced Structural Shifts in Financial Risk: Airline
Stocks in the Aftermath of the September 11th Terror Attacks”, European
Journal of Political Economy, Vol. 20, No. 2, pp. 435–446, doi: 10.1016/j.
ejpoleco.2003.12.010.
Enders, W., Sandler, T. (1996) “Terrorism and Foreign Direct Investment in
Spain and Greece”, Kyklos, Vol. 49, No. 3, pp. 331–352, doi:
10.1111/j.1467-6435.1996.tb01400.x.
Enders, W., Sandler, T. (2006) The Political Economy of Terrorism, Cambridge
University Press, 3rd Edition, doi: 10.1017/cbo9780511791451.011.
Filer, R., Stanišić, D. (2012) “The effect of terrorist incidents on capital lows”,
CERGE-EI Working Paper Series, 480, doi: 10.2139/ssrn.2257389.
Greene, W. H. (2005) Econometric Analysis (5th International Edition), Prentice Hall.
Gries, T., Krieger, T., Meierrieks, D. (2011) “Causal Linkages Between Domestic Terrorism and Economic Growth”, Defence and Peace Economics, Vol. 22, No.
5, pp. 493–508, doi: 10.1080/10242694.2010.532943.
Ito, H., Lee, D. (2004) “Assessing the Impact of the September 11 Terrorist Attacks
on US Airline Demand”, Journal of Economics and Business, Vol. 57, No. 1,
pp. 75–95, doi: 10.2139/ssrn.722491.
International Disasters Database (2016) Available at: http://www.emdat.be.
James, B. R. et al. (2006) “Economic Impacts of Global Terrorism: From Munich
to Bali”, available at: http://ssrn.com/abstract=892033 or doi: 10.2139/
ssrn.892033.
Kang, S. J., Lee, H. S. (2007) “Terrorism and FDI Flows: Cross-Country Dynamic
Panel Estimation”, Journal of Economic Theory and Econometrics, Vol. 18,
No. 1, pp. 57–77, available at: http://www.apeaweb.org/confer/hito05/papers/
kang_s.pdf.
Lutz, J. B., Lutz, M. J. (2014) “Terrorism and Its Impact on Foreign Economic
Activity in Sub-Saharan Africa”, Journal of Business and Economics, Vol. 5,
No. 4, pp. 525–534, available at: http://www.academicstar.us/UploadFile/
Mehmood, S. (2013) “Terrorism and the macroeconomy: Evidence from
Pakistan”, Defence and Peace Economics, Vol. 25, No. 5, pp. 509–534, doi:
10.1080/10242694.2013.793529.
Pizam, A., Fleischer, A. (2002) “Severity versus Frequency of Acts of Terrorism: Which Has a Larger Impact on Tourism Demand?”, Journal of Travel Research,
Vol. 40, No. 3, pp. 337–339, doi: 10.1177/0047287502040003011.
Roodman, D. (2009) “A Note on the Theme of Too Many Instruments”, Oxford
Bulletin of Economics and Statistics, Vol. 71, No. 1, pp. 135–158, doi:
10.1111/j.1468-0084.2008.00542.x.
Shahbaz, M. A., Javed, A., Amina, D., Sattar, T. (2013) “Performance Measurement
of Small and Medium Enterprises (SMEs) in Pakistan”, Archives of Business
Research, Vol. 2, No. 3, doi: 10.14738/abr.23.320.
Statistical Database UNCTAD (2016) available at: http://www.unctad.org.
Stojčić, N., Hashi, I., Shqiponja, T. (2011) “Innovation Activities and Competitiveness: Empirical Evidence on the Behaviour of Firms in the New
EU Member States and Candidate Countries”, CASE Network Studies and
Analyses, No. 424, Warsaw: CASE – Center for Social and Economic Research, doi: 10.2753/eee0012-8775510404.
Stojčić, N., Hashi I. (2011) “The Structure and Quality Upgrading of Croatian Exports to EU15 Market, paper presented at the 9th International Conference, Challenges of Europe: Growth and Competitiveness – Reversing the Trends”, organized by the University of Split, Faculty of Economics, Bol, Croatia, May 26-28, available at: http://search.proquest.com/openview/30a746e4f0dd861ee1
79eff2eb3ae88b/1?pq origsite=gscholar.
Stojčić, N., Bečić, M., Vojinić, P. (2012) “The Competitiveness of Exports from Manufacturing Industries in Croatia and Slovenia to the EU-15 Market: A Dynamic Panel Analysis”, Croatian Economic Survey: Vol. 14, No. 1, pp. 69–105, available at: http://hrcak.srce.hr/80034.
Tarzi, S. (2005) “Foreign Direct Investment lows into Developing Countries:
Impact Location and Government Policy”, Journal of Social, Political and
Economic Studies, Vol. 30, No. 4, pp. 497–515, available at: https://www. questia.com/library/journal/1P3-948618511/foreign-direct-investment-lows-into-developing-countries.
Tavares, J. (2004) “The Open Society Assesses Its Enemies: Shocks, Disasters and Terrorist Attacks”, Journal of Monetary Economics, Vol. 51, No. 5, pp. 1039–
1070, doi: 10.1016/j.jmoneco.2004.04.009.
Volker, N., Schumacher D. (2004) “Terrorism and international trade: an empirical
investigation”, European Journal of Political Economy, Vol. 20, No. 2, pp.
Utjecaj terorizma na izravna strana ulaganja (FDI) zemalja EU i EEA
1 Heri Bezić2,Tomislav Galović3, Petar Mišević4Sažetak
Glavni cilj istraživanja je empirijski odrediti učinke terorizma na izravna strana ulaganja (FDI) odabranih EU i EEA zemalja. Metodologija se temelji na primjeni sistemskog GMM procjenitelja dinamičke panel analize, obuhvaća grupu od 29 zemalja, razdoblje od 13 godina i to u periodu od 2000. do 2013. godine. Glavni rezultati potvrđuju kako teroristički incidenti, ekonomske i institucionalne varijable utječu na izravna strana ulaganja promatranih EU i EEA zemalja. Može se zaključiti kako su terorizam i institucionalna stabilnost zabilježile najznačajniji utjecaj na priljev FDI promatranih EU i EEA zemalja. Rezultati ukazuju kako terorističke aktivnosti smanjuju sigurnost i povjerenje ulagača u zemlje koje mogu biti pod utjecajem terorističkih aktivnosti, smanjujući im priljev inozemnih direktnih ulaganja. Preporuke i prijedlozi su dane temeljem rezultata empirijske analize.
Ključne riječi: terorizam, GMM procjenitelj, FDI (izravna strana ulaganja), EU, EEA
JEL klasiikacija: F52, F59, F21, F62
1 Ovaj rad je inanciralo Sveučilište u Rijeci projektom pod brojem 13.02.1.3.13.
2 Redoviti profesor u trajnom zvanju, Sveučilište u Rijeci, Ekonomski fakultet, Ivana Filipovića
4, 51000 Rijeka, Republika Hrvatska. Znanstveni interes: tehnološka politika i konkurentnost, međunarodno poslovanje. Tel.: + 385 51 355 148. E-mail: [email protected].
3 Docent, Sveučilište u Rijeci, Ekonomski fakultet, Ivana Filipovića 4, 51000 Rijeka, Republika
Hrvatska. Znanstveni interes: tehnološka politika i konkurentnost, međunarodno poslovanje. Tel.: + 385 51 355 155. E-mail: [email protected].
4 Dr.sc., zaposlen u Hrvatskoj gospodarskoj komori, Roosveltov Trg 2, 10000 Zagreb, Republika
Table A1: Results of the System Two-Step GMM Estimator
Model 4: 2-step dynamic panel, using 377 observations Included 29 cross-sectional units
Including equations in levels H-matrix as per Ox/DPD Dependent variable: FDIpc Asymptotic standard errors
Coeficient Std. Error Z p-value
FDIpc(-1) 0.504353 0.000406775 1239.8818 < 0.0001 ***
const −384.246 102.908 −3.7339 0.0002 ***
GDPpc 0.0161146 0.000932268 17.2853 < 0.0001 ***
DISASTERS −7.68247 15.5508 −0.4940 0.6213
INCIDENTS −5.76717 1.63973 −3.5171 0.0004 ***
ka_open 576.131 145.379 3.9630 < 0.0001 ***
Sum squared resid 3.04e+09 S.E. of regression 2861.935
Number of instruments = 95
Test for AR(1) errors: z = -2.16719 [0.0302] Test for AR(2) errors: z = -0.9103 [0.3627]
Sargan over-identiication test: Chi-square(89) = 25.2068 [1.0000] Wald (joint) test: Chi-square(5) = 1.63313e+006 [0.0000]
Source: Authors’ calculations
Table A2: Values of Variables of the Model
Country Year FDIpc FDIgdp ka_open INCIDENTS DISASTERS
Austria 2000 1059,94211 4,32794366 1 0 1
Austria 2001 706,811225 2,8887434 1 0 0
Austria 2002 17,097106 0,06495735 1 0 1
Austria 2003 760,84216 2,37619915 1 0 1
Austria 2004 388,574227 1,06167574 1 0 0
Austria 2005 1309,01546 3,42754199 1 0 1
Austria 2006 574,426914 1,42233551 1 1 0
Austria 2007 3066,15901 6,59463988 1 1 1
Austria 2008 866,217405 1,68981165 1 6 1
Austria 2009 1107,09748 2,33123507 1 3 0
Austria 2010 306,532613 0,66095808 1 0 0
Country Year FDIpc FDIgdp ka_open INCIDENTS DISASTERS
Austria 2012 471,27868 0,97868544 1 0 1
Austria 2013 1221,35807 2,42238676 1 1 1
Bulgaria 2000 127,052661 7,61186994 0,224489 2 2
Bulgaria 2001 101,881364 5,65180477 0,163896 1 0
Bulgaria 2002 117,183183 5,64315075 0,163896 1 0
Bulgaria 2003 267,52026 9,89761282 0,224489 0 0
Bulgaria 2004 438,644868 13,1063635 0,285083 0 0
Bulgaria 2005 510,195397 13,3787383 0,345677 0 3
Bulgaria 2006 1023,88109 23,1940897 0,939406 0 1
Bulgaria 2007 1638,05736 28,3912574 1 0 1
Bulgaria 2008 1313,27775 18,4844231 1 2 1
Bulgaria 2009 454,641943 6,74888091 1 0 0
Bulgaria 2010 209,648419 3,18296697 1 0 0
Bulgaria 2011 401,619833 5,28115657 1 2 0
Bulgaria 2012 233,200187 3,22722314 1 2 1
Bulgaria 2013 254,360802 3,37223989 1 3 0
Croatia 2000 221,905213 4,56073258 0,411093 2 2
Croatia 2001 227,262313 4,33923053 0,411093 3 0
Croatia 2002 216,375133 3,5630539 0,411093 0 0
Croatia 2003 406,177418 5,16990213 0,69703 0 1
Croatia 2004 288,604858 3,05423791 0,69703 0 0
Croatia 2005 406,937874 3,93250873 0,69703 1 2
Croatia 2006 750,500891 6,51542763 0,69703 0 0
Croatia 2007 1050,4065 7,63891688 0,69703 0 1
Croatia 2008 1214,96371 7,51912049 0,69703 2 0
Croatia 2009 707,370005 4,91251919 0,69703 1 0
Croatia 2010 261,113239 1,89845025 0,69703 0 0
Croatia 2011 388,995979 2,70248656 0,69703 0 0
Croatia 2012 336,847311 2,56870627 0,69703 0 2
Croatia 2013 222,660256 1,65053746 0,69703 2 0
Cyprus 2000 1207,59248 8,45472119 0,163896 2 1
Cyprus 2001 1324,17469 8,99734008 0,163896 1 0
Cyprus 2002 1464,66681 9,18373355 0,163896 0 0
Cyprus 2003 1241,90845 6,1789214 0,411093 0 0
Cyprus 2004 1490,05771 6,3205569 0,757624 1 0
Cyprus 2005 1584,53525 6,31221264 0,818218 0 0
Cyprus 2006 2444,23239 9,08001717 0,878812 0 0
Country Year FDIpc FDIgdp ka_open INCIDENTS DISASTERS
Cyprus 2008 1799,66079 5,14309701 1 0 0
Cyprus 2009 4301,97987 13,5665998 1 0 0
Cyprus 2010 924,909043 3,03218587 1 0 0
Cyprus 2011 2808,14104 8,80099406 1 0 0
Cyprus 2012 1455,41863 5,04132524 0,692209 1 0
Cyprus 2013 4032,08109 14,5379651 0,631615 9 0
Czech
Republic 2000 486,342992 8,11003751 0,592874 0 0
Czech
Republic 2001 551,412456 8,37348181 0,939406 1 0
Czech
Republic 2002 830,427746 10,3823422 1 0 1
Czech
Republic 2003 206,072957 2,1175526 1 1 1
Czech
Republic 2004 487,320249 4,1810846 1 0 0
Czech
Republic 2005 1139,04878 8,56918642 1 0 1
Czech
Republic 2006 531,647245 3,51943537 1 0 0
Czech
Republic 2007 1010,25709 5,53114205 1 0 0
Czech
Republic 2008 619,583609 2,74271188 1 2 0
Czech
Republic 2009 279,104872 1,42264998 1 1 1
Czech
Republic 2010 581,841687 2,96623028 1 0 2
Czech
Republic 2011 218,409735 1,01956883 1 1 0
Czech
Republic 2012 748,974709 3,86169557 1 0 2
Czech
Republic 2013 340,035399 1,74290954 1 1 1
Denmark 2000 6336,02403 20,6042406 1 0 0
Denmark 2001 2151,86122 6,99220949 1 0 0
Denmark 2002 1236,23828 3,71559989 1 0 1
Denmark 2003 485,0473 1,19714611 1 0 0
Denmark 2004 -1984,96835 -4,26515205 1 0 0
Denmark 2005 1578,32961 3,23213389 1 0 1
Denmark 2006 1709,29805 3,28671523 1 0 0
Denmark 2007 1329,30349 2,27481314 1 0 0
Country Year FDIpc FDIgdp ka_open INCIDENTS DISASTERS
Denmark 2009 70,9420179 0,12256338 1 0 0
Denmark 2010 -1650,65947 -2,86503671 1 1 0
Denmark 2011 2056,07204 3,35788926 1 0 0
Denmark 2012 74,6339708 0,12986731 1 0 0
Denmark 2013 -132,103515 -0,22046333 1 1 2
Estonia 2000 286,420796 6,87695658 1 0 0
Estonia 2001 397,544627 8,65108264 1 1 0
Estonia 2002 214,241847 3,95047399 1 0 0
Estonia 2003 692,819948 9,44789138 1 0 0
Estonia 2004 718,595536 7,93787922 1 0 0
Estonia 2005 2112,4062 19,9929246 1 0 0
Estonia 2006 1011,76518 7,86443691 1 0 1
Estonia 2007 1760,06776 10,3991296 1 0 0
Estonia 2008 1399,02618 7,57425823 1 0 0
Estonia 2009 1411,73464 9,3607778 1 0 0
Estonia 2010 788,359738 5,25232472 1 0 0
Estonia 2011 752,257902 4,27039368 1 1 0
Estonia 2012 1215,78562 6,92523016 1 0 1
Estonia 2013 429,53896 2,22234203 1 0 0
Finland 2000 1706,57357 7,03685013 1 0 0
Finland 2001 719,21591 2,88708676 1 0 0
Finland 2002 1547,23474 5,76530519 1 0 0
Finland 2003 636,643547 1,94017943 1 0 0
Finland 2004 540,615119 1,43641033 1 0 0
Finland 2005 905,419076 2,32360223 1 0 0
Finland 2006 1452,53865 3,53360024 1 0 0
Finland 2007 2352,68743 4,87565588 1 1 0
Finland 2008 -215,106397 -0,40316743 1 1 0
Finland 2009 134,285277 0,28535058 1 0 0
Finland 2010 1370,94892 2,96966844 1 0 0
Finland 2011 473,151079 0,93171025 1 0 0
Finland 2012 768,788892 1,62562747 1 0 0
Finland 2013 -951,825399 -1,9320461 1 0 0
France 2000 449,994475 2,00554154 1 28 0
France 2001 259,218211 1,15160902 1 21 0
France 2002 347,003385 1,43118499 1 32 1
France 2003 125,657873 0,42423277 1 34 1
Country Year FDIpc FDIgdp ka_open INCIDENTS DISASTERS
France 2005 523,47419 1,505267 1 33 0
France 2006 396,240441 1,0871859 1 34 1
France 2007 987,427722 2,37929111 1 16 0
France 2008 581,274062 1,28307522 1 13 0
France 2009 472,539275 1,13863853 1 9 0
France 2010 212,350222 0,52368754 1 3 2
France 2011 480,993369 1,10298372 1 8 0
France 2012 256,613895 0,63060108 1 65 0
France 2013 644,557345 1,52479308 1 12 0
Germany 2000 2374,21468 10,1826111 1 8 0
Germany 2001 315,881252 1,35542376 1 8 0
Germany 2002 639,56605 2,57764605 1 3 2
Germany 2003 386,411848 1,29392686 1 2 2
Germany 2004 -121,562724 -0,36201589 1 3 0
Germany 2005 565,978793 1,6604869 1 3 0
Germany 2006 664,601056 1,8560786 1 4 0
Germany 2007 959,718187 2,33479648 1 3 1
Germany 2008 97,4682052 0,21688641 1 3 0
Germany 2009 286,179334 0,69753277 1 4 1
Germany 2010 790,707032 1,92386508 1 1 0
Germany 2011 814,480435 1,7993782 1 8 0
Germany 2012 245,364739 0,57500243 1 5 0
Germany 2013 219,913546 0,48770603 1 0 0
Greece 2000 100,862355 0,8384297 0,752803 28 1
Greece 2001 144,315533 1,16858679 0,752803 14 1
Greece 2002 4,55784753 0,03290736 1 11 0
Greece 2003 115,59687 0,63274564 1 12 0
Greece 2004 190,448415 0,87693575 1 4 0
Greece 2005 56,4490369 0,2516658 1 6 0
Greece 2006 484,494933 1,95959212 1 23 0
Greece 2007 190,776867 0,66254019 1 15 2
Greece 2008 405,901033 1,26854583 1 53 0
Greece 2009 219,528914 0,73865707 1 115 0
Greece 2010 29,6952422 0,11011891 1 48 0
Greece 2011 102,885793 0,39609741 1 11 0
Greece 2012 156,429024 0,69741061 1 22 0
Greece 2013 253,206555 1,16322343 1 53 0
Country Year FDIpc FDIgdp ka_open INCIDENTS DISASTERS
Hungary 2001 386,033288 7,35256948 0,757624 1 0
Hungary 2002 294,393333 4,44411659 0,818218 0 0
Hungary 2003 210,742478 2,52235256 0,878812 0 1
Hungary 2004 421,603722 4,13519201 0,939406 0 0
Hungary 2005 763,568415 6,8897617 1 0 2
Hungary 2006 676,543915 5,96781966 1 0 1
Hungary 2007 392,696467 2,85093932 1 0 1
Hungary 2008 629,81777 4,04089309 1 2 1
Hungary 2009 198,913072 1,54245405 1 1 0
Hungary 2010 218,960701 1,69220575 1 0 0
Hungary 2011 630,249947 4,51817173 1 0 0
Hungary 2012 1440,92809 11,3345143 1 0 1
Hungary 2013 311,127917 2,32136827 1 0 0
Ireland 2000 6777,38998 25,9566615 1 0 2
Ireland 2001 2496,46205 8,89858827 1 2 0
Ireland 2002 7450,38817 23,0494743 1 0 0
Ireland 2003 5680,19684 13,93607 1 1 0
Ireland 2004 -2596,22073 -5,49495079 1 0 0
Ireland 2005 -7621,28063 -15,0644683 1 0 0
Ireland 2006 -1311,44591 -2,40423548 1 1 0
Ireland 2007 5758,52713 9,17513565 1 1 0
Ireland 2008 -3780,84122 -6,01059306 1 5 0
Ireland 2009 5830,58256 11,0109861 1 0 0
Ireland 2010 9581,08267 19,5958224 1 4 0
Ireland 2011 5205,72968 9,90224972 1 4 1
Ireland 2012 9879,295 20,3664044 1 29 0
Ireland 2013 8003,45024 15,9573472 1 26 0
Italy 2000 234,702782 1,17095429 1 7 1
Italy 2001 259,973774 1,27888614 1 11 0
Italy 2002 296,59915 1,34597674 1 7 1
Italy 2003 335,66697 1,23700902 1 15 1
Italy 2004 345,407134 1,118598 1 3 0
Italy 2005 396,975685 1,25663492 1 6 0
Italy 2006 720,754397 2,19101832 1 4 0
Italy 2007 737,143412 1,98955962 1 0 0
Italy 2008 -180,969194 -0,45298839 1 2 0
Italy 2009 333,385841 0,91837202 1 4 2
Country Year FDIpc FDIgdp ka_open INCIDENTS DISASTERS
Italy 2011 565,193324 1,50659934 1 3 0
Italy 2012 1,51943248 0,00442259 1 10 1
Italy 2013 409,972828 1,16327222 1 7 0
Latvia 2000 138,305844 3,32240713 0,939406 3 0
Latvia 2001 45,0225946 1,0116189 0,939406 0 1
Latvia 2002 90,5692007 1,82160806 0,939406 0 0
Latvia 2003 122,345228 2,17244149 1 0 1
Latvia 2004 268,942891 3,97702171 1 0 0
Latvia 2005 317,025545 4,13185381 1 0 0
Latvia 2006 757,211265 7,69584337 1 0 1
Latvia 2007 1072,21689 7,50868933 1 1 0
Latvia 2008 591,181163 3,54388159 1 0 0
Latvia 2009 44,4391539 0,35886348 1 0 0
Latvia 2010 181,487887 1,58962902 1 0 0
Latvia 2011 700,875691 5,13144649 1 0 0
Latvia 2012 538,281309 3,88450043 1 0 1
Latvia 2013 440,476314 2,92404055 1 0 0
Lithuania 2000 108,29737 3,29436285 1 0 0
Lithuania 2001 128,787393 3,64825771 1 0 1
Lithuania 2002 211,891277 5,09194937 1 0 0
Lithuania 2003 53,4007096 0,964854 1 0 0
Lithuania 2004 232,113829 3,4163726 1 0 0
Lithuania 2005 312,79394 3,93278564 1 0 0
Lithuania 2006 560,938313 6,01412749 1 0 0
Lithuania 2007 631,648247 5,07156566 1 0 0
Lithuania 2008 624,984383 4,10166317 0,939406 0 0
Lithuania 2009 -4,42287572 -0,03664499 0,878812 0 0
Lithuania 2010 260,586815 2,15552428 0,818218 0 2
Lithuania 2011 475,691312 3,32987451 0,757624 0 0
Lithuania 2012 231,282955 1,63531156 0,69703 0 2
Lithuania 2013 155,451595 1,01068177 0,69703 0 0
Malta 2000 1427,03226 14,3475982 0,163896 0 0
Malta 2001 574,976571 5,78473152 0,163896 0 0
Malta 2002 -1019,93679 -9,37236194 0,163896 0 0
Malta 2003 2330,76256 17,7221506 0,163896 0 0
Malta 2004 957,087173 6,5427102 0,510427 0 0
Malta 2005 1629,637 10,5721092 0,818218 0 0
Country Year FDIpc FDIgdp ka_open INCIDENTS DISASTERS
Malta 2007 1821,15436 9,61378957 0,939406 0 0
Malta 2008 1016,56505 4,76488287 1 0 0
Malta 2009 -20443,3173 -101,374556 1 0 0
Malta 2010 2186,07197 10,6230041 1 0 0
Malta 2011 36378,7589 161,833043 1 0 0
Malta 2012 28195,9779 130,760614 1 0 0
Malta 2013 22319,6346 96,0261413 1 0 0
Netherlands 2000 4026,20025 15,4464227 1 1 0
Netherlands 2001 3255,59892 12,1870517 1 1 0
Netherlands 2002 1560,75818 5,39037022 1 2 1
Netherlands 2003 2034,20302 5,7487994 1 3 1
Netherlands 2004 767,655832 1,92741168 1 1 0
Netherlands 2005 2395,20296 5,80750366 1 0 0
Netherlands 2006 853,559479 1,94303536 1 0 1
Netherlands 2007 7275,86195 14,3595047 1 0 1
Netherlands 2008 350,004262 0,62024749 1 1 0
Netherlands 2009 2339,92169 4,5163837 1 1 0
Netherlands 2010 -432,40241 -0,85898584 1 1 0
Netherlands 2011 1462,15214 2,72652644 1 2 0
Netherlands 2012 1056,30069 2,14484112 1 0 0
Netherlands 2013 1911,74567 3,753709 1 0 1
Poland 2000 246,283209 5,50080626 0,163896 0 1
Poland 2001 145,616402 2,92259012 0,163896 1 1
Poland 2002 105,278204 2,02845141 0,449833 0 1
Poland 2003 104,111415 1,83082366 0,449833 0 0
Poland 2004 325,438125 4,90680928 0,449833 0 0
Poland 2005 254,373356 3,19260855 0,449833 0 1
Poland 2006 481,260078 5,35483817 0,449833 0 0
Poland 2007 566,720381 5,0477664 0,449833 0 0
Poland 2008 362,988282 2,61468408 0,449833 0 1
Poland 2009 311,269505 2,7237805 0,449833 0 1
Poland 2010 334,976119 2,68428685 0,449833 0 1
Poland 2011 477,912825 3,48208588 0,449833 0 0
Poland 2012 186,323181 1,43482168 0,449833 0 2
Poland 2013 3,12944319 0,02274295 0,449833 0 0
Portugal 2000 636,489638 5,54230601 1 0 1
Portugal 2001 598,576149 5,09742872 1 0 1
Country Year FDIpc FDIgdp ka_open INCIDENTS DISASTERS
Portugal 2003 764,807301 4,83993131 1 0 2
Portugal 2004 171,078226 0,94747315 1 0 0
Portugal 2005 329,541415 1,75560312 1 0 1
Portugal 2006 1005,42831 5,07963565 1 0 1
Portugal 2007 272,362821 1,19714829 1 0 0
Portugal 2008 335,745472 1,35441033 1 0 0
Portugal 2009 152,289328 0,66110714 1 0 0
Portugal 2010 228,899795 1,01719108 1 0 1
Portugal 2011 700,926065 3,03319805 1 2 0
Portugal 2012 777,245314 3,78061812 1 0 0
Portugal 2013 210,561739 0,98259481 1 0 1
Romania 2000 47,2010256 2,82259945 0,163896 0 0
Romania 2001 51,9016897 2,84384362 0,163896 0 0
Romania 2002 51,2662722 2,4703367 0,449833 0 0
Romania 2003 98,9255176 3,66859751 0,510427 0 0
Romania 2004 290,438847 8,44372431 0,818218 0 0
Romania 2005 278,217671 6,17086467 0,878812 0 1
Romania 2006 492,087769 8,78959488 0,939406 0 2
Romania 2007 442,080201 5,67377774 1 0 1
Romania 2008 614,229894 6,48054937 1 1 0
Romania 2009 212,904778 2,78664716 1 0 1
Romania 2010 139,104772 1,81016094 1 0 1
Romania 2011 108,346576 1,27475888 1 0 0
Romania 2012 147,027659 1,85915038 1 0 1
Romania 2013 165,979489 1,8748765 1 0 0
Slovakia 2000 504,89488 13,1566138 0,163896 1 1
Slovakia 2001 422,169723 10,6429966 0,163896 0 0
Slovakia 2002 1088,52515 23,628819 0,163896 0 0
Slovakia 2003 552,334211 8,75769705 0,510427 0 0
Slovakia 2004 747,724405 9,34305129 0,571021 0 1
Slovakia 2005 576,767914 6,35287939 0,631615 0 0
Slovakia 2006 1075,16408 10,1868145 0,692209 0 1
Slovakia 2007 743,147386 5,23901778 0,752803 0 1
Slovakia 2008 898,916612 5,0645291 0,752803 0 0
Slovakia 2009 -1,12056296 -0,00685906 0,752803 0 0
Slovakia 2010 325,716621 1,98834729 0,752803 0 3
Slovakia 2011 641,750658 3,57964944 0,752803 0 0
Country Year FDIpc FDIgdp ka_open INCIDENTS DISASTERS
Slovakia 2013 108,438617 0,60484951 0,752803 0 0
Slovenia 2000 67,0077364 0,65530912 0,69703 1 0
Slovenia 2001 180,191259 1,71743967 0,69703 0 0
Slovenia 2002 788,745451 6,66169256 0,69703 0 0
Slovenia 2003 136,177674 0,91311066 0,757624 0 1
Slovenia 2004 338,646195 1,9595161 0,818218 0 1
Slovenia 2005 280,77453 1,54532529 0,878812 0 0
Slovenia 2006 351,549895 1,78418263 0,939406 0 0
Slovenia 2007 374,868016 1,57401114 1 0 1
Slovenia 2008 599,472336 2,19170245 0,939406 0 0
Slovenia 2009 -232,767531 -0,94708968 0,878812 0 0
Slovenia 2010 51,2938504 0,21965644 0,818218 0 0
Slovenia 2011 527,37204 2,12170393 0,757624 0 0
Slovenia 2012 164,108633 0,73348478 0,69703 0 0
Slovenia 2013 -69,2569015 -0,29902172 0,69703 0 0
Spain 2000 982,431104 6,6467853 1 112 1
Spain 2001 697,017821 4,53825551 1 78 0
Spain 2002 948,625471 5,56208105 1 40 0
Spain 2003 614,513198 2,84724104 1 21 1
Spain 2004 579,735651 2,31494374 1 31 1
Spain 2005 576,668331 2,16204227 1 24 0
Spain 2006 699,442779 2,43595915 1 23 1
Spain 2007 1438,83928 4,34434553 1 11 0
Spain 2008 1701,74095 4,70887947 1 37 0
Spain 2009 227,445422 0,69424323 1 21 1
Spain 2010 863,377 2,7851952 1 3 0
Spain 2011 610,120293 1,89878513 1 0 0
Spain 2012 549,603361 1,89539243 1 1 0
Spain 2013 889,324494 2,99584307 1 5 0
Sweden 2000 2641,12452 9,01952974 1 0 0
Sweden 2001 1227,9264 4,54923092 1 0 1
Sweden 2002 1377,26631 4,6501876 1 0 0
Sweden 2003 603,441562 1,62962354 1 0 0
Sweden 2004 1360,0644 3,20013784 1 3 1
Sweden 2005 1287,41594 2,98825029 1 1 0
Sweden 2006 3028,93358 6,5547871 1 0 0
Sweden 2007 3149,37323 5,91318245 1 1 0
Country Year FDIpc FDIgdp ka_open INCIDENTS DISASTERS
Sweden 2009 1084,11967 2,34919911 1 3 0
Sweden 2010 14,9734131 0,02876565 1 1 0
Sweden 2011 1367,71163 2,29501643 1 2 0
Sweden 2012 1717,3672 3,0033091 1 0 1
Sweden 2013 373,09596 0,6160193 1 6 1
United
Kingdom 2000 2059,88473 7,87152273 1 5 1
United
Kingdom 2001 621,682245 2,4153175 1 0 0
United
Kingdom 2002 354,306753 1,26247522 1 0 0
United
Kingdom 2003 284,21327 0,87625279 1 0 1
United
Kingdom 2004 1024,28469 2,68389432 1 1 0
United
Kingdom 2005 3037,08016 7,62079668 1 0 0
United
Kingdom 2006 2444,06719 5,75881265 1 2 0
United
Kingdom 2007 2967,89393 6,13042788 1 0 1
United
Kingdom 2008 1516,30954 3,34416668 1 5 0
United
Kingdom 2009 1462,49574 3,92350702 1 4 0
United
Kingdom 2010 946,147581 2,44833658 1 2 0
United
Kingdom 2011 667,013416 1,6128679 1 0 0
United
Kingdom 2012 942,01306 2,27059095 1 2 0
United
Kingdom 2013 752,163391 1,77995356 1 3 1
Switzerland 2000 2674,84635 7,02399318 1 0 1
Switzerland 2001 1224,15285 3,15021977 1 0 0
Switzerland 2002 862,717208 2,06591334 1 0 3
Switzerland 2003 2253,58129 4,64799745 1 1 1
Switzerland 2004 126,342674 0,23483477 1 0 0
Switzerland 2005 -127,790314 -0,23131906 1 0 1
Switzerland 2006 5815,72495 10,0923068 1 1 1
Switzerland 2007 4267,77375 6,72896922 1 0 1
Switzerland 2008 1978,53053 2,7328963 1 3 0
Country Year FDIpc FDIgdp ka_open INCIDENTS DISASTERS
Switzerland 2010 3653,92795 4,90271748 1 0 0
Switzerland 2011 3560,18622 4,03253412 1 0 0
Switzerland 2012 1990,13598 2,38075322 1 0 1
Switzerland 2013 -2779,52821 -3,26375492 1 0 0
Norway 2000 1578,61196 4,13884152 1 0 0
Norway 2001 470,158635 1,21987676 1 1 0
Norway 2002 174,380763 0,40482477 1 0 0
Norway 2003 761,106354 1,51721358 1 1 0
Norway 2004 554,382277 0,96224418 1 0 0
Norway 2005 471,526175 0,70630516 1 0 0
Norway 2006 2254,45915 3,04729244 1 1 0
Norway 2007 1692,05728 1,99266992 1 0 0
Norway 2008 2145,4602 2,21906209 1 0 0
Norway 2009 3441,42639 4,30699846 1 0 0
Norway 2010 3484,56092 3,97731287 1 1 0
Norway 2011 3084,68949 3,06127455 1 3 1
Norway 2012 3759,48289 3,6833841 1 0 0
Norway 2013 2863,79807 2,76466281 1 0 0
Iceland 2000 608,877598 1,91358358 0,878812 0 0
Iceland 2001 611,873029 2,13333441 0,878812 0 0
Iceland 2002 304,367995 0,950815 0,818218 0 0
Iceland 2003 1146,00558 2,933981 0,757624 0 0
Iceland 2004 2512,33099 5,3617295 0,69703 0 0
Iceland 2005 10381,6556 18,3391554 0,69703 0 0
Iceland 2006 12779,6838 22,4709224 0,69703 0 0
Iceland 2007 22378,2399 31,8202233 0,69703 0 0
Iceland 2008 2964,8424 5,21218046 0,163896 0 0
Iceland 2009 273,570105 0,66943544 0,163896 0 0
Iceland 2010 772,645978 1,85305191 0,163896 0 0
Iceland 2011 3441,18713 7,55663988 0,163896 0 0
Iceland 2012 3145,82121 7,2279994 0,163896 1 0
Iceland 2013 1204,2544 2,58866586 0,163896 0 0