M
ESTRADO EM
E
CONOMIA E
G
ESTÃO DE
C
IÊNCIA
,
T
ECNOLOGIA E
I
NOVAÇÃO
T
RABALHO
F
INAL DE
M
ESTRADO
D
ISSERTAÇÃO
T
HE ROLE OF SCIENCE AND TECHNOLOGY MANAGEMENT
COMPANIES IN THE SET
-
UP AND COORDINATION OF MULTI
-PARTNER SCIENTIFIC ALLIANCES
I
NÊS
M
ENDES
M
ATIAS
M
ESTRADO EM
E
CONOMIA E
G
ESTÃO DE
C
IÊNCIA
,
T
ECNOLOGIA E
I
NOVAÇÃO
TRABALHO FINAL DE MESTRADO
D
ISSERTAÇÃO
T
HE ROLE OF SCIENCE AND TECHNOLOGY MANAGEMENT
COMPANIES IN THE SET
-
UP AND COORDINATION OF MULTI
-PARTNER SCIENTIFIC ALLIANCES
I
NÊS
M
ENDES
M
ATIAS
O
RIENTAÇÃO:
PROFESSOR DR. VÍTOR CORADO SIMÕES
Agradecimentos
Gostaria de começar por agradecer ao Professor Vítor Corado Simões, pelos
ensinamentos, apoio e incentivo que me foi transmitindo não só durante o período de
elaboração desta dissertação mas ao longo deste mestrado. Foram, sem dúvida, uma
fonte de inspiração.
Agradeço também ao Professor Vítor Escária, pela disponibilidade e valiosa ajuda com
a análise de clusters.
Quero agradecer às minhas colegas e amigas do laboratório e aos meus colegas do OSP,
por todo a amizade e força que me foram dando ao longo deste período e que, sem
saberem, tanto me ajudou. À THT, por ter servido de inspiração para o tema, e aos
THTs por me terem apoiado sempre e por me inspirarem todos os dias a procurar a
excelência.
Em quinto lugar, aos meus amigos, por compreenderem e respeitarem a minha ausência.
À minha família, que por ser a minha é a melhor de todas, e por se preocuparem e me
apoiarem sempre. Em especial à minha Avó Celeste, por ter cuidado tão bem de mim.
Ao Tiago, por ter estado lá do inicio ao fim e por sempre ter compreendido e apoiado as
minhas decisões.
À minha mãe e ao meu pai, porque é a eles que devo o que consegui e o que sou, e é a
eles que dedico a minha primeira obra.
There is something irreversible about acquiring knowledge.
Table of Contents
Index of Figures ... 5
Index of Tables ... 5
Glossary ... 6
Resumo ... 7
Abstract ... 8
Chapter 1: Introduction ... 9
Chapter 2: Literature Review ... 11
1. An European problem ... 11
2. Trends in international S&T policies ... 14
3. Networks of scientific cooperation ... 16
3.1. Models for collaborative research ... 17
3.2. The Triple Helix Model – A model for collaborative research between academia, businesses and the government ... 18
4. Research Management – need for specialized support ... 20
Chapter 3: Methodology ... 24
1. Online survey ... 25
2. Website analysis ... 26
3. Cluster Analysis ... 28
Chapter 4: Results ... 28
1. Online survey results ... 28
2. Website analysis ... 31
3. Cluster Analysis ... 33
The effect of size ... 34
Chapter 5: Discussion of results ... 36
Chapter 6: Conclusions ... 41
Bibliography ... 43
Annexes ... 47
Annex I ... 47
1. Companies’ Online Survey ... 47
2. Companies’ Online Survey Responses ... 49
Annex II ... 53
3. Consortia Online Survey ... 53
Annex III ... 54
Index of Figures
Figure 1 - Websites' content analysis ... 32
Figure 2 – Main Clients of S&T management companies ... 32
Figure 3 - Collaborators. (A) Average, minimum and maximum size of the companies. (B) 7 companies recruit external collaborators. (C) 4 companies have networks of evaluators/ex-evaluators. ... 49
Figure 4 - Success rates ... 50
Figure 5 - Compensation Model. (A) Favorite compensation model. (B) Average success fees. ... 50
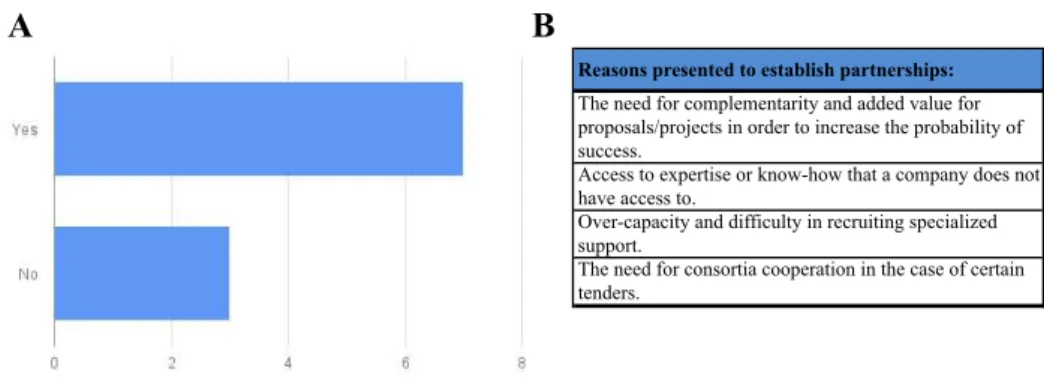
Figure 6 - Partnerships with other grants management companies. (A) Number of companies who establish partnerships. (B) Reasons presented by the companies to establish partnerships. ... 51
Figure 7 - Competitors ... 51
Figure 8 - Model summary of Two-step Cluster Analysis ... 54
Figure 9 - Cluster analysis ... 54
Figure 10 - Variable importance in cluster assembly ... 55
Index of Tables
Table 1 - List of categories and subcategories ... 27Table 2 - Cluster distribution ... 33
Table 3 - Cluster characterization ... 34
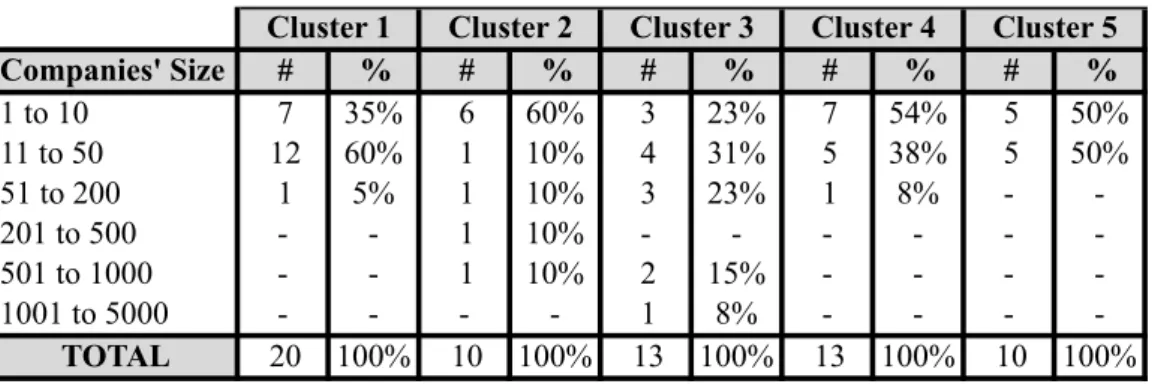
Table 4 - Number and percentage of companies per size per cluster ... 35
Table 5 - Type of clients per cluster ... 36
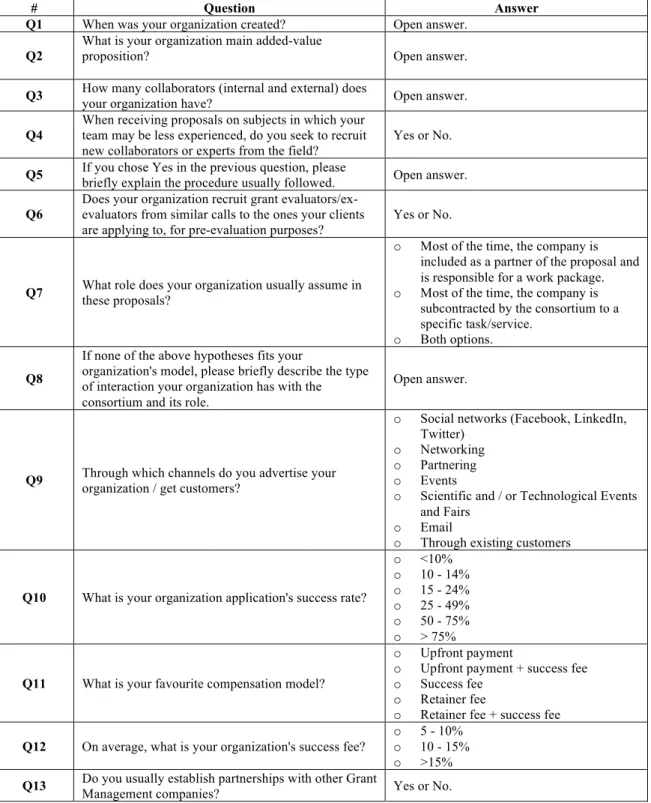
Table 6 - List of questions made to the companies through the online survey ... 47
Table 7 - Role of S&T management companies in multi-partner proposals ... 49
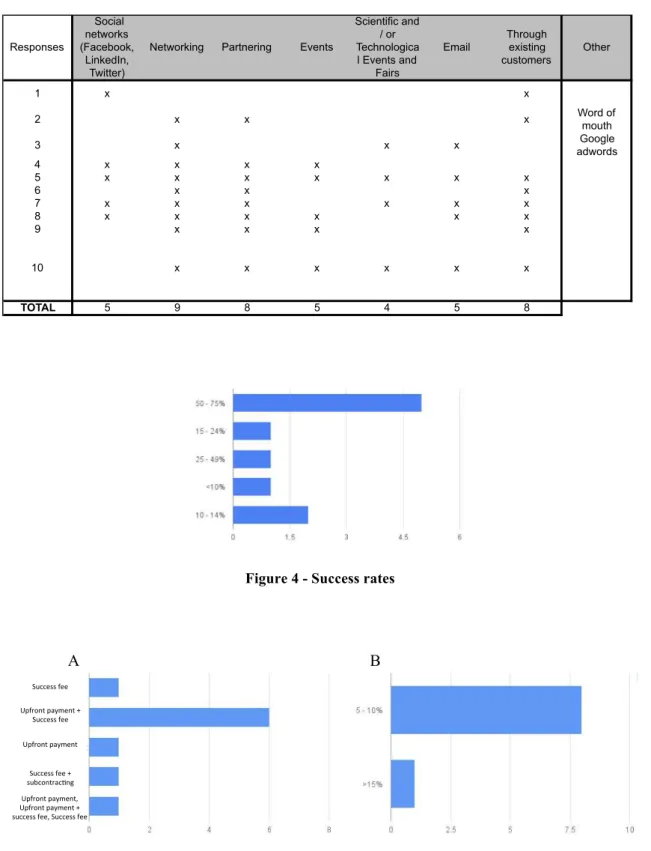
Table 8 - Most used advertising channels ... 50
Table 9 - Most important skills ... 51
Table 10 - Types of organizations that contract grants management services ... 52
Table 11 - Main reasons to contract grants management services ... 52
Table 12 - Proposals scientific panels ... 52
Table 13 - List of questions made to the consortia through the online survey ... 53
Table 14 - Variable frequency within each cluster ... 55
Glossary
BRICS - Brazil, Russia, India, China and South Korea (group of emergent economies)
CERN - European Organization for Nuclear Research EC - European Commission
EMBL - European Molecular Biology Laboratory ERA - European Research Area
ERC - European Research Council
ESA- European Space Agency ESF - European Science Foundation
EU - European Union
FP - Framework Programmes
FP7 - European Commission Seventh Framework Programme
H2020 – Horizon 2020 IP - Intellectual Property
OECD - Organisation for Economic Co-operation and Development R&D - Research and Development
S&T - Science and Technology USA - United States of America
Resumo
Existem, atualmente, poucos estudos académicos realizados sobre Gestão de Ciência e Tecnologia (C&T), nomeadamente sobre o tipo de entidades cuja atividade empresarial
se concentra nesta área. Um exemplo de tais entidades são as empresas de Gestão de C&T que, entre outros, oferecem serviços de consultoria na construção de consórcios e na elaboração e submissão de propostas de financiamento.
Neste trabalho propusemo-nos estudar e caracterizar estas empresas com base num
painel de 66 empresas que operam na União Europeia. A análise foi realizada com base em doze variáveis estruturais e utilizando um modelo estatístico com base numa análise
de clusters. Esta análise permitiu-nos identificar cinco grandes grupos de empresas. O tipo de serviços oferecido mostrou ser a variável que mais influenciou o agrupamento das 66 empresas nos cinco clusters. Cada cluster foi posteriormente caracterizado de
acordo com o tamanho das empresas e o tipo de clientes. Não encontramos uma aparente correlação entre o número de serviços oferecidos e o tamanho das equipas das
empresas, mas sim entre o tamanho e o tipo de serviços prestados. Encontramos evidências para um maior número de contactos por parte de Pequenas e Médias Empresas (PMEs) do que de Universidades, na requisição de serviços de gestão de
C&T. Os resultados obtidos mostram que estas empresas de gestão de C&T são bastante dinâmicas, com qualificações muito especializadas e com um grande foco no
cliente e nas suas necessidades. Estes evidenciam um grande potencial de crescimento deste sector, e mostram a importância destas empresas na construção e gestão de consórcios e de propostas de consórcio.
Palavras-chave: União Europeia; Colaboração; Ciência e Tecnologia; Investigação;
Abstract
Science and Technology (S&T)Management is a poorly studied field to what concerns
the type of entities operating in such field. One example of such entities are S&T Management companies that provide a variety of services such as assistance in consortia assembly and in proposal submission. The present thesis proposes an
objective characterization of such companies based on a panel of 66 companies operating in the European Union. The analysis was made based on twelve structural
dimensions, and through a statistical model based in a clusters analysis for allowing the identification of 5 major groups of companies. Cluster patterns have been largely influenced by the type of service offered. Each cluster has been further characterized
according to the size of the companies and type of clients. There is no apparent correlation between the number of offered services and the size of the teambut, instead,
with the type of services provided. There is, however, a slightly tendency for SMEs (Small and Medium Enterprises) to request more often these companies’ services than universities which lead us to conclude that consortia are usually led by SMEs rather
than by academic groups. The results obtained show that these are dynamic companies, with very specific skills and a strong focus on the client’s needs. The research identifies
a great potential for the sector to grow, and highlights the importance of such entities in the assembly of multi-partner alliances but also the need for further studies.
Keywords: European Union; Collaboration; Science and Technology; Research;
Chapter 1: Introduction
In the European Union (EU) context, efforts have been made towards the construction
of a strong and competitive Scientific and Technological (S&T) system such as the promotion of relationships among the actors of the different national S&T systems (Fischer 2012; European Commission 2007; European Commission 2012). However,
despite the progress achieved in the last decades, an interim evaluation of the European Commission 7th Framework Programme (FP7) clearly identified the need for the
intensification of international cooperation activities focused on engaging with partners outside of Europe (European Commission 2010b). In other words, in order to truly create an European Research Area (ERA), Europe needs to establish sound networks of
collaboration in Research and Development (R&D) that work as easily as networks within national borders, in order to create and attract critical mass and investments
(European Commission 2010a; European Commission 2007). These R&D networks, specially the ones created in response to the European Commission Framework Programmes funding initiatives, typically involve partners from several different
countries and from a broad range of backgrounds, which makes the formation of such consortia a highly complex process (European Commission 2012; European
Commission 2015c; Hagedoorn et al. 2000). The complexity of the process and the diversity of the actors involved suggest the need for specialized support in the formation, coordination and management of such consortia. Research Management
companies have arisen in response to a specific need identified by the European Commission, and have become important players in the current European scientific and
technological scenario (Gusmão 2001; Vidal et al. 2015; Langley 2012).
science and technology management companies in the assembly and coordination of
multi-partner scientific alliances, such as consortia?
To answer this question, we have established three different approaches. The first was to gather information that might provide metrics to characterize such companies. The
second was to establish their profile and business approach within the European scientific scene, and the third approach was to describe their interaction and role in the
setup of multi-partners scientific alliances, based in the information previously collected. Within the 66 companies analysed, we have identified 5 groups of companies that mostly differ in the pack of services they are specialized in. There are companies
specialized in following the life cycle of funding projects, from cradle to grave, while other companies are more focused in business-related activities or just offer independent
services, with no obvious relation to the development of the life cycle of projects. The methodology and analysis proposed and the presented results correspond to the first approach to this study, and to what could be done with the available information.
This dissertation is structured in 6 chapters. In Chapter 2 we explore the literature about European scientific collaborations and the history and role of research management
within the European Research Area (ERA). In Chapter 3 we describe the methods used to collect and analyse information, and in Chapter 4 we present the results obtained with such analysis. In Chapter 5 we discuss the results of the study in light of what has been
Chapter 2: Literature Review
Collaborative research as been strongly supported by governments and organisations.
The decision to enter collaborations affects not only the research process but also the construction and management of such structure as a consortium, as well as the outcomes of such collaboration. Several authors have studied research collaborations but none had
addressed the existence of intermediates that may influence the progression of such collaborations.
1. An European problem
Global research and innovation were, until recently, dominated by the European Union,
the United States of America (USA) and Japan. The European Union (EU) is a world leader in research and innovation, accounting for 24% of world expenditure on research,
32% of high impact publications and 32% of patent applications, while only comprising 7% of the population (European Commission 2012). However, over the past decade, the landscape has rapidly evolved. Emergent countries such as Brazil, Russia, India, China,
and South Africa (BRICS) have been catching-up and strengthened their Research and Development (R&D) systems, increasing their influence in the international scene.
BRICS share in global expenditure on R&D has doubled between 2000 and 2009 (Luis Fernandes, Ana Saggioro 2012; European Commission 2012).
Europe also needs to pay attention to the third countries1, as more research and innovation is being performed in it. Europe must be able to have access to this knowledge, and become an attractive location for carrying out research and innovation,
1 A third country, for the purposes of this study, is a country that is neither a Member State nor a state
as well as be competitive enough to attract the best talents (European Commission
2012).
The Green Paper released in April 2007 (European Commission 2007) highlights the importance of the European Research Area (ERA). It signals the need for greater
cohesion among the various countries and regions of the EU and for increasing interactions as a method to augment and disseminate the generation of knowledge, and
to build more critical mass.
Throughout the years, Europe has been developing a specific model of scientific and technological cooperation across borders. Such examples are the European Organization
for Nuclear Research (CERN, founded in 1954), the European Space Agency (ESA, 1964), the European Molecular Biology Laboratory (EMBL, 1973), the European
Science Foundation (ESF, 1974) and inter-governmental networking structures such as
EUREKA2
(1985) and COST3
(1971), as well as the EU Framework Programmes (European Commission 2007). These international research initiatives and multilateral incentive programmes constitute one of the driving forces in the construction and
maintenance of the ERA (European Commission 2012; European Commission 2007; Gusmão 2001). Through promoting the formation of multinational R&D consortia, exchanges between researchers, the twinning of laboratories, and access to major
research infrastructures, these various initiatives have encouraged the development of research partnerships that extend across national frontiers and, consequently, have
2
Eureka programme main goal is to fund transnational network projects that perform market-driven innovative research. The “bottom-up” approach allows the project consortia to define the nature of the technologies to be developed and how the project comes together, agree upon the intellectual property rights and build partnerships, to share expertise and ease access to international markets with the results of their research.
3
fundamentally altered the geography of European science and technology (Gusmão
2001; European Commission 2007).
One of the ERA’s pillars lies on the conceptualization of the Framework Programmes (FP), which has provided the opportunities for trans-border cooperation and enhanced
EU’s quality and quantity of international R&D collaboration agreements across the continent (European Commission 2007; European Commission 2008). The Framework
Programmes have gradually been opened up to participation by third countries, with support for international cooperation fully mainstreamed within FP7 (7% of FP7 participants come from third countries) (European Commission 2008).
Progress has been made in increasing the scale and scope of international cooperation activities. Smaller networking and partially co-funded activities, such as the ERA-NETs
actions4 and the Joint Technological Initiatives5, have accompanied these actions. Despite the progress made, the FP7 interim evaluation (European Commission 2010b)
identified a lack of critical mass and the absence of a clear definition of the strategy driving the development of the actions. This evaluation pointed out the need for an
intensification of international cooperation activities focused on engaging with partners outside of Europe on equal terms and in programmes and activities of high mutual interest and recommended the coherent strategic development of the Union's policy for
4
ERA-NET scheme is to develop and strengthen the coordination of national and regional research programme. The ERA-NET actions provide a framework for actors implementing public research programmes to coordinate their activities e.g. by developing joint activities or by mutually supporting joint calls for trans-national proposals.
5
international cooperation in research and innovation (Edler 2010; European
Commission 2008; European Commission 2010b).
2. Trends in international S&T policies
The importance of the development of internationally coordinated policies and funding schemes to support international collaboration in Science and Technology (S&T) can be
justified, according to Jakob Edler (Edler 2010), by three mega trends.
The first mega-trend is the growing number of indicators that point to an increasing relevance of international collaboration in S&T, followed by the broadening of
international and transnational policy initiatives that aim at modulating instruments to foster international collaborations. These indicators, such as publications,
co-inventions and joint research projects, show the development of S&T collaborations not only within the OECD (Organisation for Economic Co-operation and Development) countries but also within the emerging economies, like BRICS countries (Edler 2010).
One example is that internationally co- authored articles appear to be cited more often than nationally co-authored papers (Leydesdorff & Wagner 2008). This is a very
important fact considering the global dispersion of specialised knowledge production, but also shows the need for appropriate international policies. The presence in international networks allow researchers to accelerate the generation of knowledge, to avoid duplicated work, help researchers make a name for themselves and to step up
their performance and curriculum (Edler 2010). The opportunities for knowledge diffusion are indeed greatly expanded at the global level, possibly benefiting scientists
countries is made even greater (Wagner & Leydesdorff 2005; Leydesdorff & Wagner
2008).
The second mega-trend is that fostering international S&T is no longer an exclusive concern of scientists and S&T policy makers. Science and Technology are now seen as
a mean to drive economic growth and to create jobs, as an investment in our future and as a tool to solve societal challenges (European Commission 2015c).
The third and last mega-trend is the increase and broadening of international and transnational policy initiatives and instruments to foster and modulate international S&T collaborations, such as the European organisations mentioned above (Edler 2010).
European policy and funding scene has changed within the last 10 years and, more recently with the creation of ERA, has became more flexible in a way that enables and
support international scientific collaborations. News instruments were created at the European level, such as the European Research Council (ERC) and the ERA-Nets that broadened the toolbox of existing funding opportunities for S&T collaboration, and
have been of critical importance for a development towards flexible internationalization policies (Edler 2010).
On 14 September 2012, the Commission adopted a Communication entitled "Enhancing and focusing EU international cooperation in research and innovation: a strategic approach" (European Commission 2012). The Communication sets out a new strategy
for international cooperation in research and innovation, in particular with a view to implementing Horizon 2020, the 2014-2020 EU Framework Programme for Research
example is that funding opportunities such as the European Research Council (ERC)
grants6
and the Marie Sklodowska-Curie Actions7
will be open to researchers from third countries. This will require a strict balance between cooperating with third countries to jointly acquire and advance in scientific knowledge while safeguarding the interest of
the European Union countries and citizens (European Commission 2012).
H2020 has a number of new features that make it suitable to the promotion of S&T
collaborations. This new strategic approach to international cooperation in research and innovation, implemented by the H2020, can be characterised by: 1) being fully open to third country participants, allowing European researchers to cooperate with the best
researchers across the world; 2) targeting international cooperation activities with the scale and scope necessary to maximise the achieved impact; 3) The development of
multi-annual roadmaps for cooperation with key partner countries and regions; 4) reinforces the partnership between the EC, the Member States and relevant stakeholders; 5) promoting common principles for the conduct of international
cooperation in R&D; 6) enhancing the role of the Union in international organisations; and 7) strengthening implementation, governance, monitoring and evaluation (European
Commission 2012). This represents a simplification of the S&T policies and a clear promotion of international collaborations.
3. Networks of scientific cooperation
As research in science and engineering becomes increasingly multidisciplinary and competitive, research managers and policy-makers are relying more on
6
The European Research Council (ERC) is a flagship of the Horizon 2020, and its main mission is to support the highest quality research in Europe through highly competitive funding. Its a “investigator-driven” and “bottom-up” initiative, and awards grants to Project headed by starting and established researchers, independent of their origins, who are working or moving to work in Europe.
7 The Marie Sklodowska-Curie Actions provide grants for researchers in all stages of their careers and
institutional collaborations to develop strong, intellectually diverse teams that can
answer complex research questions (Corley et al. 2006). For the last three decades there has been a change of how inter-institutional research collaboration are established: S&T policy has moved from a decentralized support of small investigator-initiated projects to
large-scale centralized multidiscipline research (Bozeman & Boardman 2003). This was due to S&T collaborative policies that were implemented in the 1980s and that led to an
increased R&D interaction among researchers throughout academic centres, government laboratories and other research organisations. The management model of these multi-organizational research collaborations have developed so fast that
researchers interested in participating have had several difficulties to understand it (Corley et al. 2006). There are many differences between universities and businesses
and these differences hinder effective collaboration.
3.1. Models for collaborative research
Some authors have tried to explain the mechanisms behind collaborative research. Some have focused on the study of particular influence factors, such as success factors, while others developed more complex models and frameworks (Bukvova 2010).
Teresa Amabile (Amabile et al. 2001) has explored the factors responsible for the success of academic-practitioner collaborations, considering three main determinants
that modulate research collaborations: collaborative team characteristics, collaboration environment characteristics, and collaboration processes. Based on this research, Leisa Sargent and Lea Waters (Sargent & Waters 2004) developed a conceptual framework
for academic research collaboration taking in consideration three dimensions: the collaboration process, the interpersonal processes within the team, and the contextual
Kiesler 2007; Kraut et al. 1987), but they all are descriptive models that explain the
interaction between the collaborators and how the process develops. Indeed, throughout their analysis, they found this process model insufficient to explain the functions of collaborative research (Bukvova 2010). None of the previous briefly described models
considers the interaction between the academia and companies.
3.2. The Triple Helix Model – A model for collaborative research between
academia, businesses and the government
The Triple Helix Model may explain the collaborative research between academia and businesses. This concept emerged in the mid-1990s (Leydesdorff & Etzkowitz 1995)
when universities and industry were being pressed by policy makers to work together more closely for the benefit of society resulting from the commercialisation of
knowledge produced in the academia (Lawton Smith & Leydesdorff 2012). This model of university–industry–government relations can be used for explaining the current
research system in its social contexts. It interprets the shift from a dominating industry-government dyad in the Industrial Society to a growing triadic relationship between
university-industry-government in the Knowledge Society (Etzkowitz & Leydesdorff
2000).
The Triple Helix thesis is that the potential for innovation and economic development in
a Knowledge Society lies in a more prominent role for the university and in the
hybridization of elements from university, industry and government to generate new
institutional and social formats for the production, transfer and application of
knowledge (Leydesdorff 2000; Leydesdorff & Meyer 2006; Leydesdorff & Etzkowitz
1995). The common objective is to create an innovative environment consisting of
development, and strategic alliances among firms large and small, operating in different
areas, and with different levels of technology, government laboratories, and academic research groups (Etzkowitz & Leydesdorff 2000). This forces Universities and firms to assume tasks that were formerly the province of the other sectors (Leydesdorff 2000),
and to establish relationships with actors of the S&T system that may speak a different “language”.
Networks of scientific cooperation spawned by European programs can be distinguished from links that arise spontaneously among researchers in an international scientific environment (Gusmão 2001). These networks are often spread more widely
geographically, involving partners from different countries and bring together partners from a broad range of backgrounds (industrial laboratories, academic research, public
research centres, professional organizations, as well as certain institutions outside the realm of research) (Gusmão 2001).
The multi-year EU programs have promoted the development of collaborative practices
between different organizations within member states and the emergence of cooperative networks (Brocke & Lippe 2015). Collaborative research projects are projects that are
jointly financed, planned and executed by a consortium of academic, public and industry partners. Partners share a common research interest and provide inter-disciplinary and complementary resources and competencies to achieve the projects
goals (European Commission 2012; European Commission 2015c; Bukvova 2010). This interdisciplinary plays an important role in the portfolio of public and private
On average, the collaborative research projects funded by the EU involve at least three
legal entities, each of the three established in a different Member State or associated country (European Commission 2015b). The project tasks and responsibilities are divided among the partners in several work packages (WP), while one partner is
responsible for the overall coordination of the project. The overall coordination includes project management, communication and dissemination of the project activities, and
coordination of the scientific component. It is the coordinator’s responsibility to act as the official channel with the EC (Brocke & Lippe 2015).
International collaboration in science can thus be viewed as an emergent,
self-organizing system where the selection of a partner and the location of the research rely upon choices made by the researchers themselves rather than emerging through national
or institutional incentives or constraints (Wagner & Leydesdorff 2005). The complexity and diversity of actors involved, and their varied geographical and institutional origins, suggest a whole range of complementary analyses concerning the makeup of these
collaborative research networks and the need for specialized support in the coordination and management of such consortia (Gusmão 2001; Boardman & Bozeman 2006;
Bukvova 2010).
4. Research Management – need for specialized support
Collaborative research projects have emerged as one particular type of relationship
between academia and industry: while research activities were mainly conducted by research centres and universities, companies are now starting to be involved in joint
complexity of managerial processes (Nobelius 2004).
Collaborative research projects are highly demanding on project management capabilities. They are generally associated with high uncertainty and risks, individually oriented project personnel, heterogeneous partners located at different locations
(institutions or countries), and significant pressure in terms of creativity and innovativeness. Research consortia are often built as a response to specific calls by
funding agencies, such as the one under EC Framework Programmes. Due to this, collaborative research partnerships are often temporary partnerships that exist for the purpose of building and evaluating novel results under a pre-defined research objective
and with resources, time and financial constraints (Brocke & Lippe 2015).
Adding to the above described needs, funding opportunities are constantly increasing in
number and so is the competitiveness of each one of them. Consequently, the amount of projects to be managed has also been increasing as well as the need for specialized and optimized teams and personnel (Vidal et al. 2015).
Research managers have become key elements in the overall strategy of a research institution and any organisation that depends on public funds (Langley 2012). A study
undertaken by the European Research Advisory Board (EURAB) in Research Management in the European Research Area (ERA) in 2007, defined research management as the process of leading, administering and creating value from research,
and described it as vital tool for Europe’s economic and social prosperity (EURAB 2007). Also, with the increasing difficulty in obtaining funding, the help of
professionals in preparing and submitting funding applications has become a valuable asset (Vidal et al. 2015).
over the last twenty years due to the need of managing the increasing number of
competitive and complex research funding applications (Langley 2012). It has become very common to find, in the majority of the research-intensive institutions, such as universities, a dedicated office that provides support to the individual researcher but that
also represents the institution. The majority of the grants managers working in these offices are now highly qualified, but that was not the case until recent years (Langley
2012). One example is the one about the biotechnology and pharmaceutically companies. These companies face constant challenges in the course of the development of new products, but several of them are due to the poor project management skills of
managers, who have no formal training in matters of project management. Academic scientists are allocated into management positions with a poor knowledge of the
business side of science (Kashyap, 2002).This also applies to universities, R&D centres and other organizations.
The main task of a research manager is the operational control of individual
programmes and projects, i.e.the development of both pre-award activities (e.g., search of partners and funding opportunities, proposal writing, budget definition) and
post-award activities/project management (e.g., contract negotiation, finances, milestones management, audit management, communication and dissemination activities). Other tasks include making strategic choices about topics and directions (policies), informed
by good intelligence about technologies, competitors and markets; the effective transfer and commercialisation of results (Langley 2012; EURAB 2007).
highlighted that “excellence is needed at all stages of the research process, from basic
to applied research as well as in collaboration and partnership with the business community as part of research and innovation ecosystems within non-linear complex” (EURAB, 2007 - page 7). Also, the growth of research partnering and open innovation
is creating fresh challenges, as research managers increasingly have to operate on a truly global basis and deal with teams whose members come from multiple
organisations, nationalities and cultures (EURAB 2007).
According to Sheila Vidal (Vidal et al. 2015), there is an improvement in the success rates for funding applications which have received advanced support, suggesting that
Grant Managers providing specialized support are essential for supporting the research activity. There is, however, a difficulty in measuring such improvement, and some
authors have defended the need of more precise performance indicators, such as the amount of money and the number of grants secured (Bauer 2001).
After revising the literature, we find ourselves in the presence of enough evidence about
the importance of research management structures that mediate the assembly and management of multi-partners alliances. However, there seems to be little information
on the literature on science management companies. From the literature review we can conclude that, namely for what concerns the European Commission ideal, excellent research requires excellent management and that further efforts have to be done to raise
awareness to the subject and to the importance of highly qualified and specialized services.
To answer it, we first aimed to characterize and trace the profile of such companies,
which will allows us to define new and appropriate metrics or indicators of these companies’ success. Lastly, and using such metrics, we aim at understand the reasons and importance behind their participation in the assembly of big research collaborations.
Chapter 3: Methodology
Our research question was to understand the role of science and technology management companies in the set-up and coordination of multi-partner alliances. To do so, we have established three specific approaches that would allow us to compile the
information required to answer our research question.
As mentioned above, the first approach concerned the collection of information that
could serve as metrics to characterize such companies. The second approach was to establish their profile and business approach within the European scientific scene, and the third was to describe their interaction and role in the setup of multi-partners
scientific alliances, based on the information previously collected.
To successfully accomplish our objectives, we needed to collect from these companies as much information as possible. We started by reviewing the literature, but we realized
that there was little empirical source of evidence about these companies. We knew beforehand about the existence of several science management companies, namely
European, and therefore we decided to build our own companies’ database. In order to restrict our analysis and list of companies, we first had to define the criterion by which we were selecting our subject of study. The criterion to choose if a company was
suitable to our research was whether it performed or not scientific ad technological consultancy and management of grants and applications. Through social networks
database of 66 science management companies with European origin or with European
offices.
Based on Jakob Edler (Edler 2010) and Mark Newman (Newman 2001), that used surveys to collect information on scientific collaborations, we decided to build an online
survey to send to the companies in order to get the most precise information possible. To decide which questions/information we would like to include in the online survey,
we briefly analysed each company website. Our goal was to survey both to the companies and to their clients, in order to collect information that would be used to profile these companies, to establish metrics to measure their success, and to understand
the main reasons behind their role and importance in multi-partner scientific alliances assembly.
However, we were not able to get a significant number of replies to the online survey, and had to find an alternative method to consolidate the scarce information we had collected. We proceeded with a deep analysis of the websites of each company, but the
information available was also very limited. Nonetheless, due to the short period of time we had to complete our study, we proceeded with a statistical analysis using the
available information.
1. Online survey
We have elaborated two online surveys: one was sent to the analysed companies and the other to a list of consortia that we have collected from the companies’ websites. The one
sent to the companies was built with the purpose of getting a deeper perspective of the activities undertaken by these companies and their businesses approaches. We built this survey based on information we considered important to establish the profile of such
companies, to the number and type of collaborators, to the role of the company in the
consortia, to the way these companies advertise and reach to new clients, their success rates and compensation model, the type of partnerships they establish and who they consider to be their main competition, what is their market and what kind of services
they value the most, and who are their clients. We present it in Annex I.
The second online survey was built to obtain the customer perspective. We wanted to
evaluate what are the main reasons that led to recruit such companies, what are the most valued services and skills, what are the main limitations of this kind of service and what is more valued, and if clients would recruit these companies again and why. We used
the information available at the websites on the “clients portfolio” section and built a consortia contacts database, with 52 entries, to which we sent this second online survey.
The online survey is presented in Annex II.
This led us to the first main difficulty of the present study, which was the lack of responses to the online survey. Out of the 66 surveys sent to the companies, we could
only obtain 10 responses and, out of the 52 surveys sent to consortia, we obtained 3 responses and they were all very incomplete.
Due to this, we decided to try to consolidate the information obtained from the surveys by deeply analysing the companies’ websites.
2. Website analysis
By visiting each company website, we were able to carry out an analysis of the type of services offered by each one of them. Due to differences in each service’s name, and in order to be easy to analyse, we created main categories in which we included several
the field.
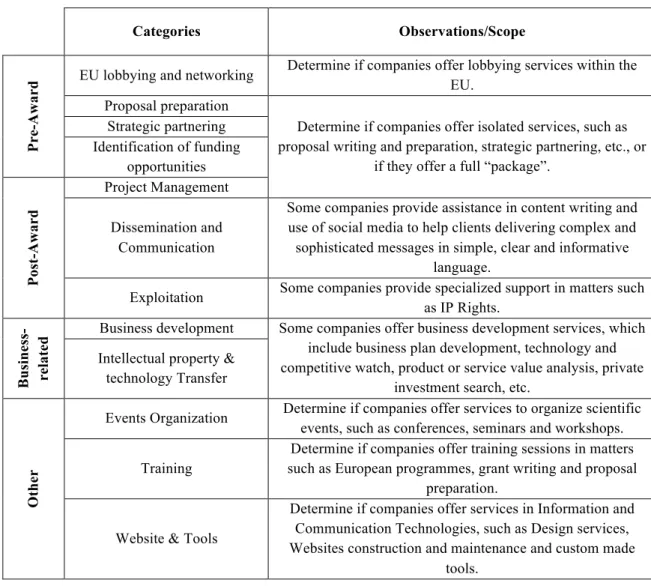
However, the second main difficulty of this study, which was the lack of information available at the companies’ websites, forced us to disregard some of the initially defined categories and subcategories due to the high level of missing entries. To proceed with
the analysis and the characterization of the companies, we have selected the following 12 categories, which we have divided into pre-award, post-award, business-related and
other activities (Table 1).
These 12 categories will be called, from now on, as variables. Table 1 - List of categories and subcategories
Categories Observations/Scope
Pr
e
-Aw
a
r
d EU lobbying and networking
Determine if companies offer lobbying services within the EU.
Proposal preparation
Determine if companies offer isolated services, such as proposal writing and preparation, strategic partnering, etc., or
if they offer a full “package”. Strategic partnering
Identification of funding opportunities Po st -Aw a r d Project Management Dissemination and Communication
Some companies provide assistance in content writing and use of social media to help clients delivering complex and sophisticated messages in simple, clear and informative
language.
Exploitation Some companies provide specialized support in matters such as IP Rights.
Bu si n e ss -rel a ted
Business development Some companies offer business development services, which include business plan development, technology and competitive watch, product or service value analysis, private
investment search, etc. Intellectual property &
technology Transfer
Ot
h
e
r
Events Organization Determine if companies offer services to organize scientific events, such as conferences, seminars and workshops.
Training
Determine if companies offer training sessions in matters such as European programmes, grant writing and proposal
preparation.
Website & Tools
Determine if companies offer services in Information and Communication Technologies, such as Design services, Websites construction and maintenance and custom made
We have also analysed the size of the companies’ team, as well as the type of clients
that most contact them (Universities and R&D centres or Companies/SMEs).
3. Cluster Analysis
Using the information collected from the websites, i.e. the 12 categories analysed, we
questioned if we could identify groups of companies using as variables (or characteristics) the services offered by such companies. To do so, we performed a cluster analysis using the 12 relevant variables identified during the website analysis.
A cluster analysis is an exploratory technique that allows to group subjects or variables into homogeneous groups according to one or more shared features (Marôco, 2011). So
the subjects or variables can be identified and grouped, the similarity between the various subjects or variables must be measured and the subjects are grouped according to a metric distance between them, while the variables are grouped according to
correlation measures or association (Marôco, 2011). We used a two-step cluster analysis, using a Log-likelihood distance measure (categorical and continuous variables) and the Schwarz’s Bayesian Criterion, and the 12 variables selected after the
analysis of the websites to define the formation of the clusters (Mooi & Sarstedt, 2014).
Chapter 4: Results
1. Online survey results
On what concerns the online survey sent to the consortia, we could only obtain 3 (incomplete) responses, and therefore we do not present such responses and neither
A. Added-value proposition
The majority claim that their added value is the fact that they are experts in EU R&D funding programmes, and can provide services such as proposal preparation partner search, project management, business development and consortium coordination. One
company values the fact that they are one of the few consulting firms to work on
success fees only, even on very competitive schemes like the H2020 SME instrument8 . B. Collaborators
On average, the ten respondent companies have 37 collaborators, and when their team is
less experienced in the scientific area of the proposal, they recruit external collaborators. These collaborators are recruited based on a well-established network of
contacts that are as broad as social networks or Master degrees in EU programmes. These companies also have networks of specific calls evaluators or ex-evaluators who they contact for pre-evaluation purposes (Figure 3, Annex I).
C. Role
When asked about the role, four companies answered they are usually subcontracted to
a specific task, one answered they are included as partner, and four companies answered both options (Table 7, Annex I).
D. Advertising and reaching to new clients
The most used channels to advertise the company or get new customers are networking, followed by partnering relationships, through existing clients, social networks, events
and email, and scientific events (Table 8, Annex I).
8
E. Success rates
The ten companies gave very different responses to what concerns their application’s success rate (Figure 4, Annex I).
F. Compensation model
Concerning compensation model, six companies prefer to use upfront payment + success fee, which in 80% of the cases are between 5 to 10% of the proposal total
amount (Figure 5, Annex I). G. Partnerships
Seven companies answered that they usually establish partnerships with other grants
management companies. The reasons presented to do so are 1) the need for complementarity and added value in order to increase the probability of success; 2)
access to external expertise or know-how; 3) over-capacity and difficulty in recruiting specialized support; and 4) the need for consortia cooperation in the case of certain tenders (Figure 6, Annex I).
H. Competition
In what concerns competitors, only seven companies see as main competitors other
Grants Management companies, and only two have selected Institutional Grants office has their main competition (Figure 7, Annex I).
I. Market
When asked the main limitations to this business growth, the companies highlighted 1) the capacity of keep up with high success rates; 2) the ability and availability of
J. Services
During the website research, we were able to find the service EU Lobbying in a small number of companies. Most of the respondents answered that they do not consider that lobbying is a key factor in this activity, because it does not affect proposals success rate
or influence project management activities.
K. Clients
The clients that typically look for Grants management services are Small and Medium Enterprises (SMEs) that, according to the respondents, are who establish the contact in 100% of the times. The second biggest client is the University, followed by Research
centres and Industry (Table 10, Annex I). Most of the proposals come from the Information and Communication Technologies, followed by Health and Life Science,
Engineering and Exact Sciences, Environmental and Natural Sciences, and Humanity and Social Sciences (Table 12, Annex I). As or the main reasons that led clients to recruit grant management companies, the respondents answered that the main reason is
the competitiveness and complexity of the funding calls, followed by the complexity of building, coordinating and managing a consortium (Table 11, Annex I).
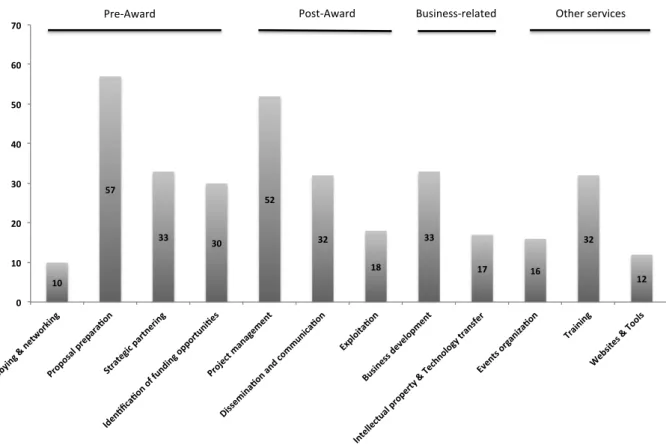
2. Website analysis
In Figure 1 we can observe the raw data obtained from the websites’ analysis. The percentages correspond to the number of companies that offered such services when compared to the total number of analysed companies (66). Out of a total of 66
companies, we can conclude that the most offered services are Proposal preparation and Project Management. This matches our companies’ selection criterion: companies that
Figure 1 - Websites' content analysis
We have also attempted to evaluate the main type of clients that request these
companies’ services, and based on this information, we can conclude that these services are more requested by other companies or small and medium enterprises (SMEs) than by universities or R&D centres (Figure 2).
Figure 2 – Main Clients of S&T management companies
10 57 33 30 52 32 18 33
17 16
32 12 0 10 20 30 40 50 60 70
EU lo bbyi
ng & net
wor king
Pro posa
l prep ara
>on
Strate gic par
tne ring
Ide n>fic
a>on of funding
oppor tuni> es Pro ject ma nagemen t Diss emi na>o n and
commu nica >on Exploita> on Busine ss de
velopm ent
Inte llectual
prope rty &
Technolog y tr
ansf er Eve nts or ganiz a>on Trai ning Web sites &
Tool s
Pre-Award Post-Award Business-related Other services
CLIENTS #
Universities R&D
centers 55
Companies/SMEs 63
3. Cluster Analysis
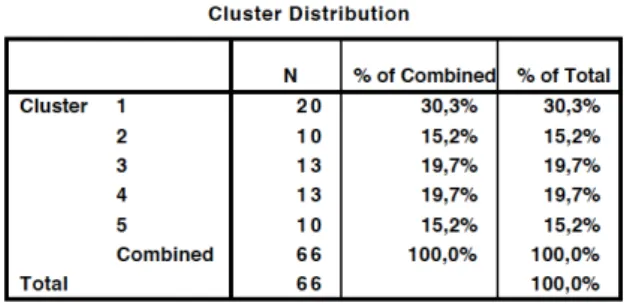
Using IBM SPSS Statistics software, version 23, and the two-step cluster method, we
analysed the collected information and 5 clusters of companies were obtained (Table 2). The major advantage of using the two-step cluster method is that allows the automatic
selection of the number of cluster to be formed (Mooi & Sarstedt, 2014).
Table 2 - Cluster distribution
Concerning cluster quality, our variables were considered of fair quality (Figure 8,
Annex III), which is not perfect but allows us to proceed with the analysis. A Ratio of Sizes of 2 means that no cluster in our cluster set is more than 2 times as large as any
other cluster (Figure 9, Annex III), i.e., the companies’ distribution within the clusters seems homogeneous, representing the smaller cluster 15,2% of the companies and the largest 30,3%.
Figure 10 (Annex III) shows the importance of each variable in the cluster assembly. Based on this figure, we can conclude that “Identification of funding opportunities”,
“Business Development” and “Strategic Partnering” were the three main variables that were used to assemble the clusters, indicating that these are the three services that most differ among the 66 companies (either they have it or they do not have it). On the other
Transfer” are the three services that contributed less to the division of the 66 companies
into the five clusters.
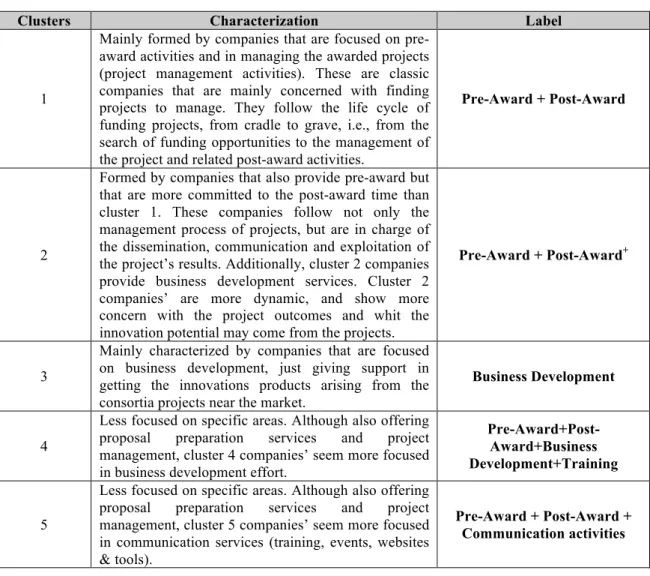
On what regards the characterization of the 5 clusters, by considering Table 10 (Annex III), we were able to characterize each cluster based on the services mainly provided by
the companies in it. The characterization is summarized on Table 3 Table 3 - Cluster characterization
Clusters Characterization Label
1
Mainly formed by companies that are focused on pre-award activities and in managing the pre-awarded projects (project management activities). These are classic companies that are mainly concerned with finding projects to manage. They follow the life cycle of funding projects, from cradle to grave, i.e., from the search of funding opportunities to the management of the project and related post-award activities.
Pre-Award + Post-Award
2
Formed by companies that also provide pre-award but that are more committed to the post-award time than cluster 1. These companies follow not only the management process of projects, but are in charge of the dissemination, communication and exploitation of the project’s results. Additionally, cluster 2 companies provide business development services. Cluster 2 companies’ are more dynamic, and show more concern with the project outcomes and whit the innovation potential may come from the projects.
Pre-Award + Post-Award+
3
Mainly characterized by companies that are focused on business development, just giving support in getting the innovations products arising from the consortia projects near the market.
Business Development
4
Less focused on specific areas. Although also offering proposal preparation services and project management, cluster 4 companies’ seem more focused in business development effort.
Pre-Award+Post-Award+Business Development+Training
5
Less focused on specific areas. Although also offering proposal preparation services and project management, cluster 5 companies’ seem more focused in communication services (training, events, websites & tools).
Pre-Award + Post-Award + Communication activities
The effect of size
the clusters analysis (Marôco, 2011). We therefore applied the variable size to the
two-step clusters as an “Evaluation Field”, which calculates cluster data for variables that were not used in the cluster creation (IBM Knowledge Center n.d.). This allowed us to observe the number of companies in each size category within each cluster. The size
categories where 1 to 10 workers, 11 to 50, 51 to 200, 201 to 500, 501 to 1000 and 1001 to 5000.
Table 4 - Number and percentage of companies per size per cluster
By evaluating the size of the companies within each cluster, we wanted to assess whether there was any relation to the average size of the cluster and the services that the companies on the cluster provide the most.
To test whether the variable “size” was in fact different between the 5 clusters, we applied a One-Way ANOVA analysis and observed that to what regards these clusters,
they do significantly differ with regards to the size of the companies (p=0,018) (Table 16 from Annex III).
Comparing the cluster characteristics with the average size of each cluster, we observed
that interestingly, although cluster 2 companies provide “extra” services (business development, dissemination, communication and exploitation of results) when
compared with cluster 1, the average size of companies in this cluster is smaller. As for
Companies' Size # % # % # % # % # %
1 to 10 7 35% 6 60% 3 23% 7 54% 5 50%
11 to 50 12 60% 1 10% 4 31% 5 38% 5 50%
51 to 200 1 5% 1 10% 3 23% 1 8% -
-201 to 500 - - 1 10% - - -
-501 to 1000 - - 1 10% 2 15% - - -
-1001 to 5000 - - - - 1 8% - - -
-TOTAL 20 100% 10 100% 13 100% 13 100% 10 100%
cluster 3, although the companies are specialized in mainly one service, the average size
of companies in this cluster seems to be very heterogeneous. Finally, cluster 4 and 5 also have very heterogeneous team sizes, not indicating any correlation between the services provided and the number of persons in the team.
The number of the teams may vary according to the number of active projects each company has in their portfolio, and we have no metrics for the number of projects each
company was managing in the moment we have analysed the websites.
Regarding clients, in Table5 we can observe the number of times that a University and/or SMEs appears listed in these companies portfolio. When comparing each type of
client number with the total number of companies in each cluster, we can conclude that most of the times these companies have both entities as clients. For example, in cluster
1, 18 companies have listed both entities, while 1 company only listed Universities and other listed SMEs as their only clients.
Table 5 - Type of clients per cluster
Chapter 5: Discussion of results
Researching on a poorly studied field was one of the major difficulties but also one of the major opportunities of this study. The lack of information available at the companies’ websites and the lack of responses to the online survey (mainly by the
consortia) did not allow to successfully concluding what we have purposed to do in the Universities)&)R&D)Centres Companies/SMEs #)companies)in)the)cluster
Cluster 1 18 18 20
Cluster 2 8 10 10
Cluster 3 9 13 13
Cluster 4 11 13 13
Cluster 5 9 9 10
beginning of this study and therefore we could not achieve our goals. Despite the
difficulties in obtaining information and the need to change the methodology, we have been able to shed some light into what has been described in the literature.
Most of the companies that were analysed offer proposal preparation and project
management services (Figure 1). This may indicate the importance these services have for researchers: a good proposal, well structured and well written is crucial to the
success of an application, as well as an efficient project management of previous projects may be helpful in getting more grants (Vidal et al. 2015; EURAB 2007). There was also a clear identification, from the supplying companies’ perspective, of the most
valued services. Partner search seems to be the service that companies believe to add more value, followed by search of funding opportunities. This correlates to the cluster
analysis results, in which the variables that most contributed to the clusters formation were identification of funding opportunities, followed by business development and strategic partnering.
We suggest that identification of funding opportunities and especially partner search require specific know-how and skills that cannot be found in institutional offices. This
suggestion is supported by what has been described by Sheila Vidal (Vidal et al. 2015) and David Langley (Langley 2012). Also, these services are part of the initial and critical steps of the construction of successful multi-partner alliance, what might
increase their value from the clients’ perspective. We were not able to find literature on the most valued services on a science and technology management company or office,
Concerning the average size of the companies’ teams, we wonder there is a relation
between this number and the type of services provided, since some may needed more human resources than others. The data collected was not sufficient to elaborate such analysis. However, using the available information, it seems that the size may be,
instead, related to the specificities of the services, as well as with the number of projects each company has on going. We would need further information to confirm this finding.
It would be interesting to investigate the disparity of teams’ size between the companies that belong to the same cluster, i.e., since they offer similar services, and understand why do they have such different team’s size. We are sceptical that it may be exclusively
related to the number of projects each company has on going.
Although it has become, nowadays, very common to find in universities and other types
of research institutions dedicated offices that provide support to the researchers (Langley 2012; Vidal et al. 2015), most of the interviewed companies do not see institutional grants offices as competitors. Due to the lack of information, we can only
speculate that these companies believe that their know-how is extremely specialized and qualified, and unless a company/office have a diverse team with a very specific training
(which until recently most of the institutional offices did not had (Langley 2012; Kashyap 2002)) it will not be considered as a competitor. Also, we have identified that one of the possible advantages of working with a company is the access to an extensive
network of contacts, which most of the grants offices may not have. It would have been good to have more research on this topic. Here we would like to suggest an idea for a
track, their experience, their network formation capacity and length, as well as other
variables that would allow for a differentiation between them.
Although these companies offer specialized services that can make a difference in obtaining funding from public agencies (Vidal et al. 2015; EURAB 2007; Langley
2012), several companies identified the lack of awareness by the clients as one of the main limitations of an organization's growth in this business sector. We could not
confirm such statement since we did not get the clients’ perspective, but we are convinced that with the responses to such or similar surveys we would be able to answer such question.
Recent data on the Horizon 2020 first results (European Commission 2015a) show that the participation of industry and SMEs has increased, largely due to the focus of the
programme on the deployment of research results through demonstration, proof of concept and pilot actions. This may explain why our results showed that companies/SMEs contact more often science management companies than universities.
It would also be interesting to understand who establishes the first contact, especially because according to the H2020 first results (European Commission 2015a),
universities are in first place in terms of the overall number of applications, and this indicates that they are the coordinators of the proposals. The high number of SMEs contacting science management companies could also be one possible explanation to the
apparent lack of awareness, since SMEs might have more financial capacity to hire upfront science management companies in order to increase their chances of success
Although we were not able to have access to the client’s perspective, all the 10
companies that replied to our survey agreed that the main reason to hire science management companies is the increasing competitiveness and complexity of the funding calls, followed by the complexity of building, coordinating and managing a
consortium. These factors are in accordance to what has been previously reported (EURAB 2007; Brocke & Lippe 2015; Boardman & Bozeman 2006; Gusmão 2000;
Nobelius 2004).
As for the technological area in which each proposal falls, we wondered if this correlate to the available funding for each of the areas or is it just a characteristic of the research
field. There was no obvious pattern on the proposal distribution in each scientific area, and we were not able to find a budget distribution for each of these specific areas within
the Horizon 2020 total budget.
Regarding success rates, the responses obtained from each company may not be compared since such responses report general success rates. We should have specified
information about the programmes or calls in which these applications have been submitted. Different programmes have different success rates (European Commission
2015a; Vidal et al. 2015), and also national success rates can be very different from European success rates. Good examples are the European Research Council (ERC) grants. There are 4 different types of grants (Starting, Consolidator, Advanced and
Proof of Concept) that have different success rates between them, but even within the same programme, the success rate may be different from one year to the other
(European Research Council n.d.).
keep shedding light into this unexplored field of study. We have identified important
questions, new ideas, and several tips to other researchers to pursue.
Chapter 6: Conclusions
This piece of research aimed to show how science management companies could be
important assets, especially within the increasingly competitive funding opportunities under the European Commission new framework, the Horizon 2020. However, due to
the several difficulties and limitations felt during the development of this study, such has lack of information and lack of time, we were not able to collect enough evidence to show it.
We could not identify and/or understand the role of science and technology management companies in the set-up and coordination of multi-partner scientific
alliances, but we believe we have unravelled some hints that are interesting enough to catch other researchers attention to these companies’ activities and business approaches. Based on the data collected, we can say that most of these companies do work, most of
the times, in consortia assembly and consequently on the submission of the consortium’s proposal. We do know that the services are probably required due to the
complexity of the assembly process and proposal coordination, but the consortia’ perspective would further validate our conclusion. There is a huge potential for grow in this business sector but it may exist a generalized lack of awareness. We wonder if these
companies were more visible, there would probably already exist more research and literature on them.