Agriculture of Central and Eastern European
countries in the European Union
Sr
đ
an Redžepagi
ć
∗Summary: Agriculture posed considerable tensions for the processes of enlargement of the European Union, because of its continuing importance both in the economies of the applicant countries of Central and Eastern European countries which have joined EU on the 1st may 2004., and in the EU budget and acquis communautaire. The preparation of agriculture in the candidate countries to join the EU was rendered more complex by the fact that the Community’s Common Agricultural Policy was a moving target. The aim of this paper is to show the bases elements of the Common Agricultural Policy, but also to provide a survey of recent developments relating to agriculture in the EU and new member states of the EU before their accession to EU and their preparation to access on the enlarged market, in order to indicate the main challenges and difficulties posed by enlargement. It seems likely that agricultural policy in the enlarged EU will attach increased priority to objectives such as rural development and the environment. However, these new priorities may be expensive to realise, and may impose a growing burden on the national budgets of EU member states.
Key words: Agriculture, European Union, Central and Eastern Europe countries, Transition, Enlargement.
JEL: Q18, N54, P25
1. Introduction
Born 50 years ago when the founder members of the European Union (EU) had not long emerged from a decade or more of food shortages1, the Common Agricultural Policy (CAP) began by subsidizing production of basic foodstuffs in the interests of self-sufficiency and food security. Now the focus is on the role of agriculture in the preservation and management of our natural resources.
The CAP is comprised of a set of rules and mechanisms, which regulate the production, trade and processing of agricultural products in the EU, with attention being focused increasingly on rural development.
∗
Institut ekonomskih nauka – Beograd. Ekonomski fakultet – Univerzitet u Nici – Sophia Antipolis: [email protected]
1 The Treaty of Rome defined the general objectives of a common agricultural policy. The
Among the EU’s policies, the CAP is regarded as one of the most important policy areas. Not only because of its share of the EU budget (almost 50%, decreasing over the years), the vast number of people and the extent of the territory directly affected, but also because of its symbolic significance, and the extent of sovereignty transferred from the national to the European level. The significance of the CAP, nowadays, is also portrayed by the fact that it is directly related to the Single Market and the European Monetary Union, two key areas in achieving the European integration.
The objectives of the CAP are to:
⇒ Increase agricultural productivity by promoting technical progress and by ensuring the rational development of agricultural production and the optimum utilization of the factors of production, in particular labor
⇒ Ensure a fair standard of living for the agricultural community, in particular by increasing the individual earnings of persons engaged in agriculture
⇒ Stabilize markets
⇒ Assure the availability of supplies
⇒ Ensure that supplies reach consumers at reasonable prices.
In order to attain these objectives, the Treaty of EU provides for the creation of the Common Organization of the agricultural markets (COM)2 which, depending on the product, shall take one of the following forms:
⇒ Common rules on competition
⇒ Compulsory co-ordination of the various national market organizations
⇒ A European market organization.
As the most fully integrated of EU policies, the CAP takes a large share of the EU budget. Nevertheless, this has dropped from a peak of nearly 70% of the EU budget several decades ago to 34.9% of the budget during the next EU financial cycle from 2007-2013, reflecting cost savings from reforms, a shift of some agricultural spending into rural development, which will take 9.7% of the budget over the same period, and expansion of the EU’s other responsibilities.
When the EU enlarged in May 2004, the number of farmers in the EU increased by nearly 70%. Farmers and food processors in the new member countries faced particular challenges when competing with agriculture in the rest of the EU and received funding to modernize even prior to enlargement. In
2 The COMs were introduced gradually and now exist for most EU agricultural products. They are
addition, a special funding package tailored specifically to the needs of these farmers is providing €5.8 billion to help early retirement, less favored areas, environmental protection, semi-subsistence farms, producer groups and compliance with EU food, hygiene and animal welfare standards for the first three years of membership. Some CAP rules are being phased in gradually to allow time for adjustment.
In July 1997, the European Commission proposed the reform of the CAP within the framework of Agenda 20003, which was a blueprint for the future of EU policy, in view of the expected enlargement. Negotiations on Agenda 2000, and thus the agreement on the CAP reform, were concluded at the Berlin European Council in March 1999.
Agenda 2000 has been the most radical and comprehensive reform, covering all functions of the CAP: economic, environmental and rural.
In particular, the reform comprises measures for:
the reinforcement of the competitiveness of agricultural commodities in domestic and world markets
the promotion of a fair and decent standard of living for the farming community
the creation of substitute jobs and other sources of income for farmers the formation of a new policy for rural development, which becomes the second pillar of the CAP
the integration of more environmental and structural considerations into the CAP
the improvement of food quality and safety
the simplification of agricultural legislation and the decentralization of its application, in order to make rules and regulations clearer, more transparent and easier to access.
The reform, as envisaged in Agenda 2000, creates conditions for the development of multi-functional, sustainable and competitive agriculture in the EU. Furthermore, its long-term objectives will not only have an effect on the applicant countries but are also intended to benefit future generations.
Many of the toughest questions posed by enlargement relate to agriculture. This was due to the continuing importance of agriculture both in the economies of the applicant countries and in the EU budget. At the same time agricultural measures accounts for roughly half the acquis communautaire, so the applicant countries (before their accession to EU) had the daunting task of adapting to EU policies and standards. Land and labor costs were lower in the Central and Eastern European countries (CEEC), so farmers in the European Union member states 15 (EU-15) have expressed concern about the increased competitive
3 European Commission (1997). Agenda 2000, The challenge of enlargement, COM (97) 2000
pressures in an enlarged EU, though the impact seems likely to be less than initially feared.
The preparation of their agriculture to join the EU was rendered more complex for the candidate countries by the fact that the CAP was a moving target. Substantial changes in the CAP were introduced by the MacSharry Reform4 of 1992 and the 1999 Berlin Agreement. The CAP was subject to a mid-term review in 2002, and the issue of reform will be back on the table when the financial perspective for the years after 2006 comes up for discussion. The question was further complicated because the issues of CAP reform, enlargement and GATT/WTO5 obligations are all interlinked.
2. Agriculture in the CEEC economies: budget and aquis communautaire
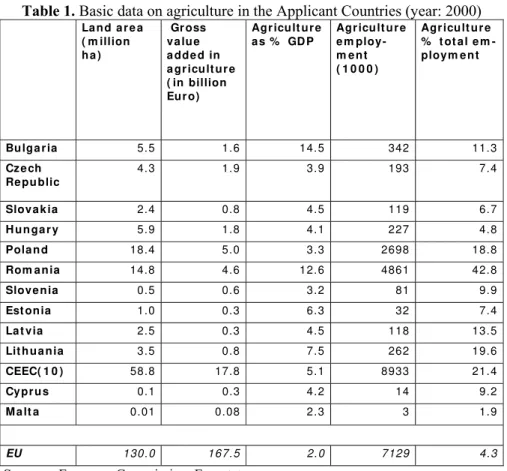
As shown in Table 1, in 1999 the share of agriculture in GDP was 5.1% for the CEEC (10) compared with 2% for the EU. The average share of agriculture in employment was 26.1% for the ten CEEC and as high as 35.2% in Romania and 25.6% in Poland, but only 5.7% in the EU-15 in 1999. In Lithuania and Romania the share of the work force in agriculture has increased since 1989, as farming may act as a buffer providing an element of food security and additional income during the transition process.
Though over the years the share of agriculture in EU-15 spending has been reduced, the CAP continues to absorb just under half of the Community budget6. In 2002 46% of the budget was earmarked for agriculture with a further 36% for the Structural Funds. With accession the applicant countries were obliged to take on the acquis communautaire relating to agriculture, including other rules also. By the year 2000 the candidate countries had requested 170 derogations and temporary exceptions from the acquis on non-agricultural questions, but 340 relating to agriculture. Particular difficulties arose relating to meat and milk production, and it was estimated that roughly 50% meat production in Poland and 40% in Hungary failed to meet EU standards. The two countries have asked for derogations of three to five years before the acquis is fully adopted in these areas. In some cases the cost of the investments required to bring the processing industry in line with the acquis was prohibitive, so it seemed likely that many firms in the CEEC would close. As transport costs for agricultural products tend to be relatively high, this is likely to have implications for farmers upstream. The
4 The first major reform to the CAP occurred as a result of the MacSharry reforms proposed in
1992 and implemented in 1994. Ray MacSharry was the EU Commissioner for Agriculture at the time. For the first time, MacSharry succeeded in reducing the level of support prices for a number of major commodities. The reason for his success was that he compensated farmers for the resulting loss of income by increasing direct payments. This has been the model for all subsequent CAP reforms.
5
http://www.wto.org/English/tratop_e/agric_e/negoti_e.htm
6 As explained clearly in reports of the European commission – Direction for agriculture. For more
CEEC processing firms have been lobbying governments to grant financial assistance for the adjustment process and, as shown in article7, Foreign Direct Investment (FDI) can also play a crucial role in this context.
Table 1. Basic data on agriculture in the Applicant Countries (year: 2000)
La n d a r e a
( m illion h a )
Gr oss v a lu e a dde d in a gr icu lt u r e ( in billion Eur o)
Agr icu lt u r e a s % GD P
Agr icu lt u r e e m ploy-m e n t ( 1 0 0 0 )
Agr icu lt u r e % t ot a l e m -ploy m e n t
Bu lga r ia 5 . 5 1 . 6 1 4. 5 3 4 2 1 1. 3
Cz e ch Re pu blic
4 . 3 1 . 9 3 . 9 1 9 3 7 . 4
Slov a k ia 2 . 4 0 . 8 4 . 5 1 1 9 6 . 7
H u n ga r y 5 . 9 1 . 8 4 . 1 2 2 7 4 . 8
Pola n d 1 8 . 4 5 . 0 3 . 3 2 69 8 1 8. 8
Rom a n ia 1 4 . 8 4 . 6 1 2. 6 4 86 1 4 2. 8
Slove n ia 0 . 5 0 . 6 3 . 2 8 1 9 . 9
Est on ia 1 . 0 0 . 3 6 . 3 3 2 7 . 4
La t via 2 . 5 0 . 3 4 . 5 1 1 8 1 3. 5
Lit h u a n ia 3 . 5 0 . 8 7 . 5 2 6 2 1 9. 6
CEEC( 1 0 ) 5 8 . 8 1 7 . 8 5 . 1 8 93 3 2 1. 4
Cy pr u s 0 . 1 0 . 3 4 . 2 1 4 9 . 2
M a lt a 0 . 0 1 0 . 0 8 2 . 3 3 1 . 9
EU 130.0 167.5 2.0 7129 4.3
Sources: European Commission, Eurostat
3. Period of transition in agriculture
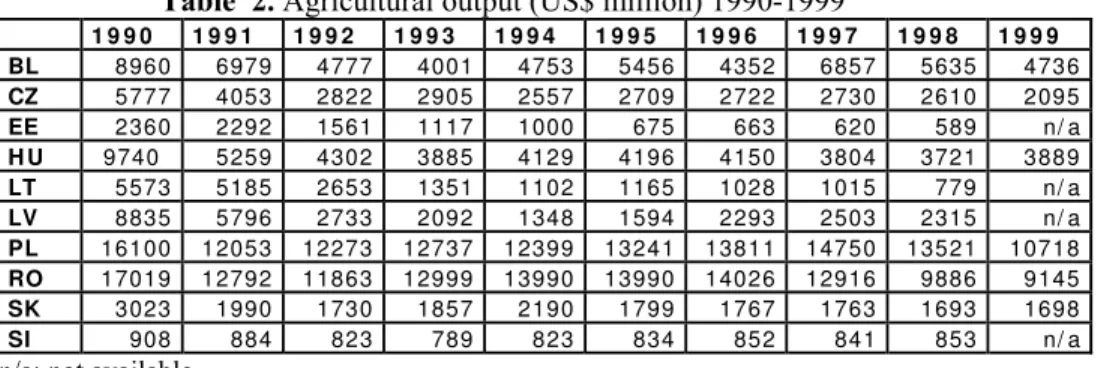
As shown in Table 2, production collapsed in the ten CEEC at the beginning of transition, followed by a stabilisation of the level of production in most CEEC. There has been a general decline in output in the Baltic Countries, in particular after the Russian crisis. Recovery was generally faster for grains, while milk and beef production has been declining in most CEEC as many animals were
7
slaughtered in the first years of transition. Various reasons can be given for the fall in output:
At the beginning of transition: the reduction in subsidies The disruption associated with the transition process Macroeconomic uncertainty
The Russian crisis
Flooding in the late 1990s and adverse weather conditions such as drought in many of the CEEC in 1992 and also in 1993 in some countries The worsening terms of trade for farmers with prices for inputs and other non-agricultural products rising faster than those for outputs in the early years of transition. Subsequently in most CEEC the terms of trade tended to level out.
Table 2. Agricultural output (US$ million) 1990-1999
1 9 9 0 1 9 9 1 1 9 9 2 1 9 9 3 1 9 9 4 1 9 9 5 1 9 9 6 1 9 9 7 1 9 9 8 1 9 9 9
BL 8 96 0 6 97 9 4 77 7 4 00 1 4 75 3 5 45 6 4 35 2 6 85 7 5 63 5 4 73 6
CZ 5 77 7 4 05 3 2 82 2 2 90 5 2 55 7 2 70 9 2 72 2 2 73 0 2 61 0 2 09 5
EE 2 36 0 2 29 2 1 56 1 1 11 7 1 00 0 6 7 5 6 6 3 6 2 0 5 8 9 n/ a
H U 9 74 0 5 25 9 4 30 2 3 88 5 4 12 9 4 19 6 4 15 0 3 80 4 3 72 1 3 88 9
LT 5 57 3 5 18 5 2 65 3 1 35 1 1 10 2 1 16 5 1 02 8 1 01 5 77 9 n / a
LV 8 83 5 5 79 6 2 73 3 2 09 2 1 34 8 1 59 4 2 29 3 2 50 3 2 31 5 n/ a
PL 1 61 0 0 1 20 5 3 1 22 7 3 1 27 3 7 1 23 9 9 1 32 4 1 1 38 1 1 1 47 5 0 1 35 21 1 07 1 8
RO 1 70 1 9 1 27 9 2 1 18 6 3 1 29 9 9 1 39 9 0 1 39 9 0 1 40 2 6 1 29 1 6 9 88 6 9 14 5
SK 3 02 3 1 99 0 1 73 0 1 85 7 2 19 0 1 79 9 1 76 7 1 76 3 1 69 3 1 69 8
SI 9 0 8 8 8 4 8 2 3 7 8 9 8 2 3 8 3 4 8 5 2 8 4 1 8 5 3 n/ a
n/a: not available
Source: European Commission
A feature of agricultural production in countries such as Bulgaria, Romania and Poland was (and is) semi-subsistence farming which was (and is) oriented to own consumption and limited direct sales8. Given the high cost of implementing EU hygiene and veterinary standards, there is a risk that this type of production could continue on a semi-legal basis without undergoing restructuring in an enlarged EU. Because of the lack of alternative sources of income and social security nets in rural areas in these countries, governments have been reluctant to undermine the buffer provided by this type of agriculture.
During the years 1990s, agricultural productivity in the CEEC was lower than in the EU-15 member states, but has been increasing since the mid-1990s9. Productivity tended, by the year of 2000, to be higher in countries such as Hungary which have been able to attract high levels of FDI in food processing,
8
Pouliquen, A. (2001). Competitiveness and farm incomes in CEEC agri-food sectors: Implications before and after Accession for EU markets and policies, European Commission, Directorate General for Agriculture
9 Swinnen, J.F.M. (2002). Transition and Integration in Europe: Implications for Agricultural and
but lower in countries like Romania, Bulgaria and Poland, where small-scale farmers seemed less able or willing to undertake restructuring and improvements in farming methods. Productivity rose when these countries joined (Bulgaria and Romania will join the EU in January 2007) the EU, due to improved access to capital, technology and know-how.
After 1989 agricultural policies in the CEEC were characterised by an initial phase of liberalisation of prices and trade, and the elimination of subsidies. Consumer prices for food products rose rapidly, while real farm incomes fell, leading to a second phase of ad hoc price and trade intervention during the early 1990s to protect producers and consumers from the adverse effects of early reforms. In a third phase from about 1995 as governments gained experience in intervention in agriculture longer term measures were introduced, and there was a more systematic tendency to adopt CAP – like measures10. Subsequently adjustments to policies were introduced, partly in response to domestic pressures and to meet international obligations, but also to mirror the changes in the CAP, though at times with a certain delay. After 1994 there was a tendency to rely less on price support, and more on direct payments (producer subsidies) to farmers. A difference with EU-15 policies has been in the CEEC use of a wider range of measures, including input subsidies and subsidised credit, but these brought in line with EU regulations with enlargement of the May 2004.
One of the difficulties in comparing the level of agricultural support of different countries is that a wide range of policies are available (directs subsidies, price support, subsidised credit, tax breaks and so on) and the combination of measures adopted varies between countries. The PSE (producer subsidy equivalent)11 provides a means of collapsing all these different policies into a single measure of support. The PSE can be defined as the subsidy necessary to leave the revenue of farmers unchanged if all policies with an impact on the agricultural sector were abolished. Each year the OECD publishes PSE estimates for various countries. These are expressed either in money value (generally in dollars) or as a percentage of the value of agricultural production at the farm gate.
Table 3 provides PSE estimates for the ten CEEC and EU-15. As can be seen from the Table, with the exception of Slovenia, the level of support to agriculture in the CEEC tended to be lower than in the EU-15, but has generally been increasing in recent years.
10
Hartell, J. and Swinnen, J. (2000). European integration and the political economy of Central and Eastern Price and Trade Policy, in Tangermann, S. and Banse eds. (2000) Central and Eastern European Agriculture in an Expanding European Union, New York and Oxford: CABI International
11
Table 3. Percentage of producer subsidy equivalent in the EU-15 and ten CEEC Year
Count ry
8 6
9 0
9 0 9 1 9 2 9 3 9 4 9 5 9 6 9 7 9 8 9 9 0 0
Bu lga r ia n / a n / a - 39 - 45 - 4 - 27 - 25 - 54 - 10 2 6 2
Cz e ch Re pu blic
5 7 5 4 5 2 3 1 28 2 0 1 2 1 3 9 2 1 2 5 1 6
Est on ia 7 5 7 1 5 9 - 97 - 32 - 10 0 7 5 1 9 1 5 1 0
H u n ga r y 3 4 - 1 8 1 1 1 6 20 2 4 1 4 9 7 1 3 2 3 2 0
La t via 8 0 7 6 8 3 - 10 1 - 40 6 5 3 4 1 7 1 8 1 8
Lit h u a n ia 7 7 72 - 26 2 - 12 4 - 37 - 15 1 5 7 2 0 2 1 1 8
Pola n d 1 7 - 1 8 1 1 8 15 1 8 1 8 2 3 2 2 2 3 1 9 7
Rom a n ia 4 5 4 5 1 5 8 16 1 9 1 0 1 2 3 2 5 2 0 1 1
Slov a k ia 5 1 5 1 3 5 2 8 26 2 3 1 8 1 1 1 3 2 6 2 5 2 3
Slove n ia n / a n / a n / a 3 5 28 3 2 3 7 2 9 3 7 4 4 4 8 4 3
EU - 1 5 48 47 48 47 49 49 49 43 38 38 36 33
n/a: not available
Source: OECD and European Commission
4. Agriculture in an enlarged EU
One of the early fears was that when the CEEC joined the EU the application of the CAP would lead to substantial price increases in the new member states, thereby stimulating agricultural production and adding to the problem of EU surpluses. However, more recent studies12 generally suggest that with enlargement agricultural production expands significantly for various reasons:
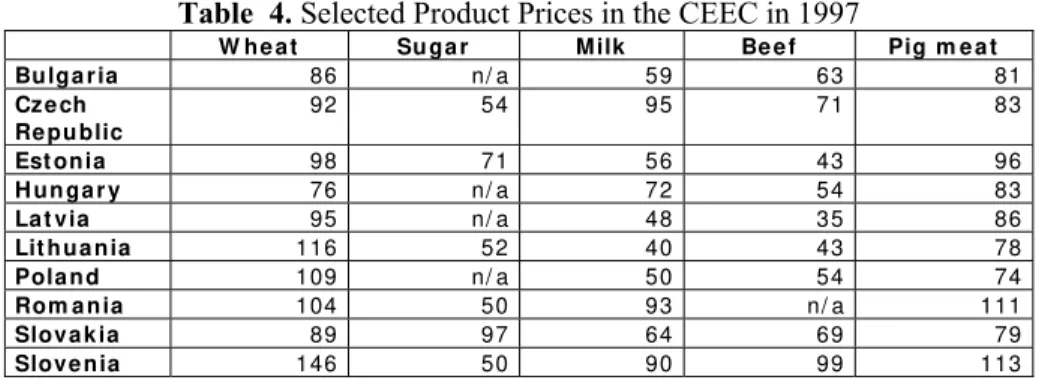
The narrowing of the price gap between the EU-15 and CEEC, with prices for some agricultural products and in certain CEEC exceeding those of the EU-15 (Table 4). This is due to reductions in EU-15 prices following
12
- Tangermann, S. and Banse, M. (2000). Central and Eastern European Agriculture in an Expanding European Union, Wallingford, Oxon, CABI publishing
- van Huylenbroeck,G. and Durand, G. (2003). Multifunctional Agriculture: a new paradigm for European agriculture and rural development, England: Burlington, Aldershot, Hampshire - Cardwell, M. (2004). The European Model of Agriculture, Oxford Univesity Press- Agricultural Policies in OECD Countries: Monitoring and Evaluation 2005
- Aksoy, A. and Beghin, J. (2005). Global Agricultural Trade and Developing Countries, The World Bank
the 1992 and 1999 reforms, increases in CEEC prices, and the real appreciation of exchange rates in the CEEC.
The slow pace of restructuring may limit the production capacity of the CEEC.
Difficulties in meeting the acquis cause many CEEC processing firms to close, and this is likely to have implications upstream for agricultural output.
Table 4. Selected Product Prices in the CEEC in 1997
W h e a t Su ga r M ilk Be e f Pig m e a t
Bu lga r ia 8 6 n / a 5 9 6 3 8 1
Cz e ch Re pu blic
9 2 5 4 9 5 7 1 8 3
Est on ia 9 8 7 1 5 6 4 3 9 6
H u n ga r y 7 6 n / a 7 2 5 4 8 3
La t via 9 5 n / a 4 8 3 5 8 6
Lit h u a n ia 1 16 5 2 4 0 4 3 7 8
Pola n d 1 09 n / a 5 0 5 4 7 4
Rom a n ia 1 04 5 0 9 3 n / a 1 11
Slov a k ia 8 9 9 7 6 4 6 9 7 9
Slove n ia 1 46 5 0 9 0 9 9 1 13
n/a: not available
Source: European Commission, Agra Europe (august 1999)
Accession of these CEEC in the EU brought about significant price increases only for beef, sugar, milk and milk products and coarse grains (barley, maize and rye)13. Also, the enlargement of the EU in 2004 brought price increases for cereals. Production of wheat rose from 2004 in the CEEC, wheat prices are expected to remain competitive on world markets so eventual surpluses could be exported without export subsidies. According to different studies of European Commission, surpluses are likely result for rye. Increased feed requirements are predicted to absorb higher maize production, while developments on the barley market are likely to depend on exchange rate movements. The production of beef has increased from the year of 2004. The impact of the entrance on enlarged market, the CEEC has reflected higher consumption of fresh milk and cheese, and production depends on the allocation of production quotas, and developments in the structure of production in the CEEC. With accession CEEC to EU, consumption of pork has risen. In the CEEC prices was (and are) generally higher, in particular for high quality pork, than in the EU-15. In contrast, poultry production is competitive in the CEEC and is expected to increase slightly to meet expanding demand.
13
5. Old-new member states of EU: Trade
Trade provides an indication of patterns of specialisation in the enlarged EU. If we analyse the period before accession of the CEEC to EU, we can see that there has been a rapid increase in EU-CEEC agricultural trade, but EU-15 exports to the ten CEEC have been growing far faster than EU-15 agricultural imports from these countries (Table 5). As a result, an EU-15 deficit with the CEEC was transformed into a surplus from 1993. Only Hungary had a surplus in agricultural trade with the EU-15 in all years since 1989, though Bulgaria had a smaller surplus over the 1989-92 and 1996-99 periods.
Table 5. The main partners in CEEC agricultural trade (1998)
e x por t s im por t s
EU Ot her
OECD*1
CEEC NI S*2
ot h er EU Ot her
OECD*1
CEEC NI S*2
ot her
Bu lga r ia 2 7 1 2 1 0 3 4 1 7 3 7 1 4 1 0 2 3 7
Cz e ch Re pu blic
3 1 4 3 8 1 7 1 0 5 0 8 2 0 0 2 2
Est on ia 1 6 4 1 9 6 0 1 4 9 2 3 1 0 5 1 3
H u n ga r y 4 4 n/ a 1 3 1 8 n / a 4 2 n / a 8 1 n/ a
La t via 2 0 1 2 2 4 7 2 5 1 8 2 9 4 8
Lit h u a n ia 2 3 1 1 1 7 4 7 2 5 3 1 2 2 5 8 2
Pola n d 4 3 6 1 4 3 2 5 4 8 1 1 9 3 2 9
Rom a n ia 6 1 1 4 7 5 1 3 4 1 1 6 2 3 4 1 6
Slov a k ia 2 0 0 6 1 1 1 8 3 9 3 4 3 0 1 5
Slove n ia 4 0 6 3 3 4 8 5 0 7 1 3 2 2 8
*1excluding the Czech Republic, Hungary and Poland *2New independent states (counties of ex-Soviet Union) n/a: not available
Source: OECD
authors14 found that trade in processed agricultural products was rising considerably faster than that of primary products, in particular in EU-15 exports to the CEEC. The share of EU-15 processed products in agricultural exports to the CEEC rose from 41.2% in 1989 to 62.6% in 2000, while the share in EU imports increased from 21% in 1989 to 34% in 200015. Difficulty in meeting EU standards, poor quality and less experience in marketing help to explain the difficulties experienced by the CEEC in exporting food and agricultural products to the EU, but these countries also accuse the EU of agricultural protectionism16.
6. FDI in the CEEC
Foreign direct investments play a crucial role in providing capital, know-how and technology and in contributing to the restructuring and modernisation of the food industry. The impact of FDI may involve imitation effects by other firms, and spillovers up and down stream in the agricultural sector. FDI in food processing in the CEEC has played a crucial role in providing a shortcut to enable firms to meet international health and hygiene standards.
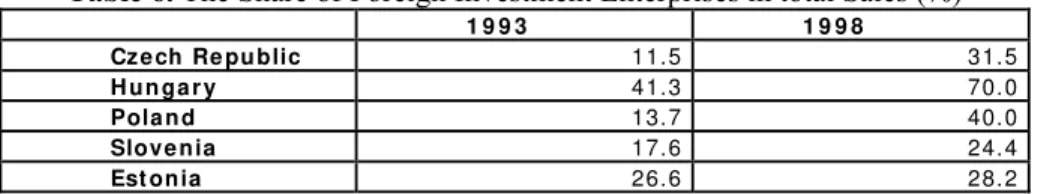
According to the OECD17, slightly less than 12% of total FDI inflows have been invested in the food and beverages sector. In some countries the percentage was much higher, amounting to 28% in Hungary for the 1990-96 period, and 25% for Bulgaria between 1990 and 199718. In Poland foreign investment in the food chain amounted to $3.3 billion between 1992 and 1997 or 25% of total FDI19 (Table 6).
14 van Berkum, S. (1999). Patterns of intra-industry trade and foreign direct investment in
agro-food products: Implications for East-West integration, MOCT-MOST: Economic Policy in Transitional Economies, Springer Netherlands, Volume 9, Number 3 / September, 1999
15 European Commission (2002). Enlargement and Agriculture: Successfully Integrating the New
Member States into the CAP, Issues Paper, Brussels, SEC (2002) 95 Final
16 For more precisely explanations and information see : Tangermann, S. (2000). Widening the EU
to Central and Eastern European Countries: WTO and Perspectives of the New Member Countries, in Burrell A. and Oskam, A eds. Agricultural Policy and Enlargement of the European Union, Wageningen, Wageningen University Press.
17
OECD (1999). Agricultural Policies in Emerging and Transitional Economies, Monitoring and Evaluation, Paris, OECD
18
See : van Berkum, S. (1999). Patterns of intra-industry trade and foreign direct investment in agro-food products: Implications for East-West integration, MOCT-MOST: Economic Policy in Transitional Economies, Springer Netherlands, Volume 9, Number 3 / September, 1999
19
Table 6. The Share of Foreign Investment Enterprises in total Sales (%)
1 9 9 3 1 9 9 8
Cz e ch Re pu blic 1 1. 5 3 1. 5
H u n ga r y 4 1. 3 7 0. 0
Pola n d 1 3. 7 4 0. 0
Slove n ia 1 7. 6 2 4. 4
Est on ia 2 6. 6 2 8. 2
Source: OECD: Agricultural Databases
During transition period of CEEC and before their accessions to the EU on May 2004, FDI tended to be concentrated in the more highly processed sectors of the food industry such as confectionary, tobacco and beverages, rather than in more resource-intensive activities such as milling or meat-production. FDI has been of particular importance in the sugar industry where modern technology implies that processing is on a large scale and a few large multinationals tended to dominate production. In 1999 the share of productive capacity in the sugar industry with foreign investment amounted to 100% in Hungary, Lithuania and Slovenia, 95% in Slovakia, 90% in the Czech Republic, over 75% in Romania and over 50% in Poland.
7. Conclusion
Since the mid-1980s the CAP has changed fundamentally. One of the first indications of this change was the 1985 Green Paper published by the European Commission. This document called for an end to the almost exclusive reliance on price support, and listed among the priorities of the CAP: the reduction of surpluses, the promotion of the quality and variety of agricultural production, rural development, and environmental objectives.
One of the difficulties encountered by the candidate countries (now new members of the EU) in preparing for EU membership is that during the years the CAP has been changing. Major reforms were introduced in 1992 (MacSharry Reform) and 1999 (Berlin Agreement), with a mid-term review in 2002, and further reform is likely to be necessary for the financial perspective after 200620. As a result of these measures from 1992 and 1999, by 2002 market support had shrunk to only 28% of CAP spending, rural development had become the second pillar of the CAP, and the “multifunctionality” of farmers was recognised as a central tenet of EU policy21.
20
In a Eurobarometer survey carried out in May-June 2002 on opinions towards the CAP, 90% were in favour of healthier and safer food products, 89% were in favour of environmental measures, and 77% in favour of adequate incomes for farmers. However, when asked if they thought the CAP performed those tasks well the satisfaction levels were 37%, 41% and 29% respectively.
21
In order to finance emerging EU policy areas, the CAP share of the European Commission budget had to be re-dimensioned, at least in relative terms. A new financial framework will have to be decided for the years after 2006, and this seems likely to provide a catalyst for further CAP reform. The net contributors to the Community budget are reluctant to increase the budget ceiling, and if direct payments continue, they will eventually have to be extended in full to the new member states of EU.
It is unrealistic to expect that a CAP based more on these new priorities will cost less. Health and quality controls involve high administrative costs, in particular, when associated with measures such as effective labelling, animal passports and the traceability of all stages of the production and distribution processes. Budgetary constraints are likely to become even tighter in the enlarged EU. The increased emphasis on rural development and environmental measures implies a shift towards measures which already tend to be partially co-financed by national governments. It certainly was not what CEEC governments initially expected from participation in the CAP, but a partial re-nationalisation of the CAP seems difficult to avoid.
Bibliography
Aksoy, A. and Beghin, J. (2005) Global Agricultural Trade and Developing Countries, The World Bank
Cardwell, M. (2004) The European Model of Agriculture, Oxford Univesity Press Curzon Price, V., Landau A., and Whitman R. (1999). The enlargement of the European
Union: issues and strategies. London, Routledge
European Commission (1997) Agenda 2000, The challenge of enlargement, COM (97) 2000 final, 15 July 1997, Brussels, Commission of the European Communities European Commission (2002) Analysis of the Impact of Agricultural Markets and
Incomes of EU Enlargement to the CEECS, Brussels, European Commission, Directorate General for Agriculture
European Commission (2002) Enlargement and Agriculture: Successfully Integrating the New Member States into the CAP, Issues Paper, Brussels, SEC (2002) 95 Final Gow, H. and Swinnen, J. (1998) Agribusiness restructuring, foreign direct investment
and hold-up problems in agricultural transition, European Review of Agricultural Economics, 25(4), pp.331-350
Hartell, J. and Swinnen, J. (2000) European integration and the political economy of Central and Eastern Price and Trade Policy, in Tangermann, S. and Banse eds. (2000) Central and Eastern European Agriculture in an Expanding European Union, New York and Oxford: CABI International
OECD (1999) Agricultural Policies in Emerging and Transitional Economies, Monitoring and Evaluation, Paris, OECD
OECD (2005) Agricultural Databases: 2005 Edition
OECD (2005) Agricultural Policies in OECD Countries: Monitoring and Evaluation 2005
Economics (GEWISOLA) 30 September – 2 October 2002, Halle, Martin Luther University
Pouliquen, A. (2001) Competitiveness and farm incomes in CEEC agri-food sectors: Implications before and after Accession for EU markets and policies, European Commission, Directorate General for Agriculture
Swinnen, J.F.M. (2002) Transition and Integration in Europe: Implications for Agricultural and Food Markets, Policy and Trade Agreements, The World Economy, pp.481-501
Tangermann, S. (2000) Widening the EU to Central and Eastern European Countries: WTO and Perspectives of the New Member Countries, in Burrell A. and Oskam, A eds. Agricultural Policy and Enlargement of the European Union, Wageningen, Wageningen University Press.
Tangermann, S. and Banse, M. (2000) Central and Eastern European Agriculture in an Expanding European Union, Wallingford, Oxon, CABI publishing
van Berkum, S. (1999) Patterns of intra-industry trade and foreign direct investment in agro-food products: Implications for East-West integration, MOCT-MOST: Economic Policy in Transitional Economies, Springer Netherlands, Volume 9, Number 3 / September, 1999
van Huylenbroeck,G. and Durand, G. (2003) Multifunctional Agriculture: a new paradigm for European agriculture and rural development, England: Burlington, Aldershot, Hampshire
Poljoprivreda zemalja Centralne i Istočne Evrope u Evropskoj uniji
Rezime: Ovaj rad ima za cilj da nam ukratko prezentuje proces tranzicije poljoprivrede u zemljama Centralne i Istočne Evrope na njihovom putu ka Evropskoj Uniji. Deset zemalja (novih članica EU) su u mnogome tokom tranzicionog perioda prilagođavale svoje politike acquis communautaire-u. U ovom članku ćemo se ograničiti samo na poljoprivredu i njen razvoj prilikom usaglašavanja sa osnovnim načelima EU, to jest njenih “starih članica”. Cilj ovog rada je da nam pored napretka zemalja Centralne i Istočne Evrope na njihovom putu ka EU, pokaže i osnovne elemente i činjenice poljoprivredne politike EU. Takodje, upoznaćemo se i sa periodom nakon 1. maja 2004. godine i novonastalim situacijama (i potencijalnim poteškoćama) sa kojima se susreću kako stare članice (15) EU tako i nove (8+2=10) a sve u oblasti poljoprivredne politike Unije.
Ključne reči: Poljoprivreda, Evropska unija, Zemlje Centralne i Istočne Evrope , Tranzicija, Proširenje.