MASTER OF SCIENCE IN
MARKETING
MASTERS DISSERTATION
YOU HATE WHAT YOU DRINK, YOU LOVE WHAT YOU
DON’T
A DISSERTATION SUBMITED IN PARTIAL FULFILMENT OF THE REQUIREMENTS FOR THE DEGREE OF MASTERS OF SCIENCE IN MARKETING BY ISEG, UNIVERSITY OF LISBON
MIGUEL MAURICE NUNES HARRINGTON SENA,
B.A IN
APPLIED COMMUNICATIONS
SUPERVISOR:
PROF.DR. LUIS MOTA DE CASTRO
Acknowledgements
Firstly, I would like to address a special thank you to my supervisor Prof. Luis Mota de Castro, without whose contribution, collaboration and expertise this dissertation would not have been completed.
I also want to extend special thanks to Prof. João Duque who has allowed for the realization of the experience, to Prof. Rui Brites and Prof. Margarida Duarte who contributed in different ways to the conclusion of this research. Without their professional insight and patience in dealing with multiple requests from the first draft to the final assembly of results, this research would not have been possible. I also thank the staff of the technical service of ISEG for helping with the layout of the experiment.
A deep and strong thank you to my parents and my sister, without whose love and academic and intellectual support from my early age, I would not be who I am and could not have accomplished this master’s degree.
This dissertation is also the result of multiple contributions from my friends who have
believed in and supported my ideas and thinking throughout my life. Their suggestions, warnings and advice were determinant in the conclusion of this academic cycle.
Finally, I want to thank all participants in the experience, without whose kind of contribution and willing participation providing me with the data necessary for the analyses and conclusions made herein.
Abstract
Although a considerable amount of research into beer consumer behaviour has been conducted in several countries, no publicly available such study performed in Portugal has been found. The aim of this research is to understand young consumers' perceptions regarding six brands available in Portuguese retailers and to compare the results with other studies. In this research the author developed a conceptual framework and defined hypotheses, permitting an answer to the purpose of this investigation. Different techniques for collecting data such as surveys and experimentations were used and analysed statistically. The findings suggest that the presence of the brand and packaging are determinant in the formation of consumers' sensorial expectations and play a central role in consumers' evaluation, even if those attributes are not recognized as more important in consumers' perspectives. The majority of participants were unable to recognize their favourite brand in the blind-‐ test evaluation, and the two brands that were rated in last positions in the survey climbed to the top when they were not identifiable, even if in consumers' perspectives the taste is the most important attribute when choosing a beer. The main beneficiaries of the research should be breweries and, more precisely, marketing and brand managers because it provides important insights into the attributes young consumers value most and suggests strategies for marketing and advertising campaigns. The research can also provide an academic contribution because it specifies the processes to conduct blind test experimentations and suggests further studies based on the investigation results. It also, once again, makes obvious the importance of brand
awareness.
Index
1.INTRODUCTION ... 7
2. LITERATURE REVIEW ... 8
2.1-‐ CONSUMER BEHAVIOUR ... 8
2.1.1-‐ Beer consumers ... 10
2.1.2-‐ Attitudes ... 11
2.1.3-‐ Purchase intentions ... 12
2.2-‐ INTRINSIC AND EXTRINSIC CUES ... 13
2.3-‐BRAND ... 15
2.3.1-‐ Brand Equity ... 15
2.3.4-‐ Brands Studied ... 16
2.4-‐ CONCEPTUAL FRAMEWORK ... 19
3. METHODOLOGY ... 21
3.1-‐ TYPE OF STUDY USED: ... 22
3.2-‐ EXPERIENCE: ... 22
3.3-‐ SAMPLES CHARACTERIZATION: ... 23
3.3.1-‐ Beers: ... 23
3.3.2-‐ Participants: ... 23
4. RESULTS ANALYSES ... 24
5. CONCLUSIONS AND RECOMMENDATIONS FOR FURTHER STUDIES ... 34
5.1-‐DISCUSSION: ... 36
5.2-‐LIMITATIONS AND RECOMMENDATIONS FOR FURTHER STUDIES: ... 38
REFERENCES ... 39
APPENDIXES ... 43
Index of Figures
Figure 1 Conceptual Framework ... 19
Index of Tables
Table I Attributes importance when choosing a beer ... 24Table II Intrisic attributes value ... 25
Table III Extrinsic attributes value ... 25
Table IV Student Tesy Paired Samples for Intrisic Attributes ... 26
Table V Student test Paired Samples for Intrisic Attributes Correlation ... 26
Table VI T-‐Student test Paired Samples for Intrisic Attributes Paired Differences ... 26
Table VII T-‐Student test Paires Samples for Extrinsic Attributes ... 26
Table VIII T-‐Student test Paired Samples for Extrinsic Attributes ... 27
Table IX T-‐Student test Paired Samples for Extrinsic Attributes ... 27
Table X Mann Whitney Attributes Value ... 28
Table XI Brand Preferences ... 29
Table XII Mann Whitney Brands Preferences ... 29
Table XIII Brands Positions ... 30
Table XIV T-‐Student test Paired Samples for Brands ... 31
Table XV T Student test Paired Samples for Brands Correlations ... 32
Table XVI T Student test Paired Samples for Brands Paired Differences ... 33
1.Introduction
The beverage sector and, in particular, the beer market are important to Portugal’s national economy. The breweries, their suppliers and all the companies involved in the process of delivering the final product to consumers together represent 75000 jobs. According to the 2011 APVC report (Associação Portuguesa dos Produtores de Cerveja, 2011), those companies have produced 8.3 million hectolitres of beer, which represents 478 million euros in market value. However only 49% of this value remains in the brewers' industry and the other 51% of the business volume reverts to suppliers, such as advertising and marketing companies.
Although consumption is decreasing (61 litres per capita in 2007 and 48 litres in 2012; APVC 2012), beer is generally appreciated by Portuguese consumers and particularly
by university students. In fact, alcohol consumption among students has been the subject of several studies and some of them suggest that the university provides a unique environment to enhance the consumption of alcoholic drinks (Carpenter et al., 2007; Glindemann & Geller, 2003; Wechsler & Nelson, 2008).
According to the Kirim Institute, beer consumption is decreasing in all developed countries but in 2011 the European market increased 0,4%, something that had not happened for four years. Because of the importance of the beer market to Portugal’s economy, and considering that no similar study was found to have been performed for this country, the purpose of this dissertation was to conduct a comparative study of six brands available in major national retailers. The study is focused on the two main players in the Portuguese market: Unicer and SCC. This focus is not only explained by the fact that the two companies sell three brands each, but also because the two leading brands (Super Bock and Sagres) have 45% and 44.4% of market share respectively, being direct competitors (Nielsen, November 2012). In terms of share of shelf of all the major retailers, Super Bock has 40.3% and Sagres 38.1% respectively (Marktest, 2012).
This study can make a great contribution to marketing because it clarifies how consumers feel about the selected brands and promotes important insights for brand management. It is suggested that the results can be useful to marketeers and managers for the design and development of marketing strategies. The research question for this study was: “What is the consumers’ perception of 6 beer brands available in Portugal?“
This dissertation follows the rules proposed by ISEG, and the sequence in which the topics are explored conveys the logical structure that was followed, taking into consideration the objectives traced for this investigation.
After a brief introduction, a review of literature was conducted which allowed the
author to identify the nuclear topics on which the conceptual framework is based. The topics reviewed are: consumer behaviour, attitudes and intentions, intrinsic and extrinsic product characteristics and brand relevance. After exploring and explaining
the importance of each topic, a conceptual framework was developed to define which hypotheses should be tested and in which theoretical references these hypotheses were supported.
The third chapter presents and describes the methodology that was followed but also points out special requirements in order to conduct an experience of this type. The fourth chapter presents the statistical tests that were performed and also describes the investigation results. The last chapter presents the major conclusions and findings, explaining which direct and indirect consequences can be derived from those results and also identifies the limitations found during the investigation.
2. Literature Review
2.1-‐ Consumer Behaviour
of consumers, which in the last instance allows managers to segment and target the market. According to Blackwell et al (2008) consumers' behaviour not only includes the act of purchase and consumption of a product, but also includes the processes that occur before and after the decision-‐making. The same authors point out that the intention to purchase a product is merely the result of the predisposition to consume that product.
Mowen and Minor (1998) argue that consumer behaviour is the result of consumers' subjective evaluations related to the purchase, disposition and use of products or services. On the other hand, Solomon (2006) explains that the study of consumer behaviour requires a multi-‐disciplinary approach that brings together different
scientific areas, defining it as: “the study of the processes that are involved when individuals or groups of individuals select, purchase, use and dispose of products, services, ideas or experiences with the intention to satisfy their wants and needs.”
Supported by the “roles” theory, the author argues that the same consumer can have different types of behaviour depending on which “social role” he or she is performing when purchasing a specific product. Studies of consumer behaviour demonstrate that certain criteria are defined for the decision-‐making processes, and those are mainly based on product attributes (Sheth et al, 2001; Blackwell et al, 2008; Mowen e Minor, 2003). Solomon (2006) suggests that the criteria used in product evaluation are related to the social role that the consumer is performing when purchasing the product. It is expected that the same person may present different evaluations of the same product, depending on which social role he or she is assuming.
benefiting from it. Consumers can act as a group, such as in families or organizations, and the decisions involved in the purchase of a product can be made by an individual or a group. Therefore it can be suggested that consumer behaviour is not a static and repetitive process and each individual is always subjected to external influences.
2.1.1-‐ Beer consumers
Europeans have always been the largest beer consumers in the world, however in 2012 Asians overtook them in absolute beer consumption (Kirim Institute). Beer trade and consumption are part of European culture, principally in central European countries but the recent economic crises, taxes and tobacco restrictions have resulted in a change in consumer habits. According to the 2007 Datamonitor report, the on-‐
trade and off-‐trade consumption patterns tend to change drastically. Off-‐trade consumption has substantially increased and this fact has direct consequences on the way brands promote their products, such as stimulating beer consumption during
meals. It is important to note that according to a 2011 Euromonitor International report, Portugal has the fourth largest beer consumption at home in Europe.
It is interesting to note that while consumers frequent more locations where beer is traded such as bars, hotels and restaurants (on-‐trade) they consume less. Surprisingly, according to a 2009 Ernst and Young report, 72% of the industry revenues derived from on-‐trade consumption which, in part, explains the difficulties that the sector is undergoing. At a marketing level, this fact has direct consequences in how a product is promoted but also in brand positioning and pricing strategies.
presence of Portuguese emigrants (Diário Economico, 12 March 2013).
2.1.2-‐ Attitudes
Kotler and Keller (2006) argue that consumers develop attitudes about everything that surrounds them and create positive and negative observations concerning objects, tending to behave according to those observations. Consumers also form attitudes to simplify their decision-‐making processes but various studies have proved that sometimes the attitudes that consumers say they have about a product are not consistent with their purchasing behaviour. Solomon (2006) argues that although attitudes are a comprehensive concept, they are no more than a systematic evaluation that consumers make of themselves, objects, advertising and arguments that are
presented to them.
Schiffman and Kanuk (2002) developed a model that supports the idea that attitudes are composed of three basic components: cognitive, affective and behavioural (also
known as ABC model). The cognitive component refers to consumers ideas and thinking that results from the combination of experiences and information obtained from a product. The perceptions resulting from the product knowledge can make consumers believe that the product has some attributes -‐ those perceptions are called beliefs.
The beliefs can be normative (where moral and principle judgements are involved), evaluative (evaluation of a specific product) and descriptive (making the link from an object to a quality or a result and where moral judgements are present) (Hawkins et al, 2007; Sheth et al, 2001; Bennett e Kassajian, 1975). It can be suggested that the beliefs come from the cognitive learning and processed information because they are the result of the knowledge that consumers have about a product. It is also important to note that beliefs and attitudes that are established towards a product simplify the decision-‐making processes because they require less cognitive effort from the consumers, which results in repetitive purchasing behaviours.
The affective component refers to consumers' feelings about a brand and those are generated by affective experiences with a product or service. Hawkins et al (2007) argue that the affective component is related to emotional evaluations concerning a product. The consumer’s relationship, feelings and emotions related to a product determine the affection the consumer has towards it. It can be suggested that when consumers have more experience with a product (positive or negative), the affective component formed toward the product is higher. If consumers have more affective experiences with a product, they are going to recognise it and possibly purchase it more easily.
Finally, the behavioural component is related to the possibility that the consumer has
to act in one way or another towards a product. The hierarchal link between the three components illustrates the consumer’s involvement with a product. The consumer’s confidence (belief) about a brand will influence the evaluation of that brand (affective
component) and consequently will determine the intention to purchase or not (behavioural component) a product labelled by a brand (Assael, 1998).
2.1.3-‐ Purchase intentions
Consumers’ purchasing intentions are deeply related to the personal motivations of each individual. Solomon (2006) states that motivations are behavioural processes that occur when consumers want to satisfy their needs. By identifying those needs (hedonic or functional) consumers are in a state of tension caused by the difference between their actual and desired state. From a business viewpoint, marketeers create products that deliver the benefits that consumers expect, reducing their tension state. In the case of beer, consumers tend to satisfy not only physiological but also socio-‐ psychological needs (Westfall 1962).
meaning of the word object in this situation refers to a brand, advertising or purchasing situation.
Solomon et al (2012) claim that the consumer’s effort in the purchasing process depends on two aspects: the involvement and the perceived risk. The involvement is defined as the importance the consumer gives to the purchasing decision and the perceived risk as the negative consequences (financial, physical or social) of choosing a product. For products considered of high involvement and risk (ex. cars, homes etc) the creation of attitudes, motivation to buy and purchasing decision are far more complex and lengthy than for a product considered of low involvement and risk. For products such as beer (low involvement and risk) consumers have predefined beliefs
so the purchasing process is automatic and they don´t need to categorize and evaluate each product attribute to buy it. Cerjak et al (2010) argue that alimentary and beverage products are typically considered of low involvement, so consumers choose
them in a routine and as an emotions-‐based decision. It can be suggested that for low involvement products, the brand and other elements that have an affective connection with the consumers are far more important than its functional characteristics because all products of the same category are more or less equivalent. Most beers are equivalent but for one reason or another consumers choose a specific brand. This study intends to demonstrate that there is a relationship between the attitudes that consumers say they have about a brand and their real behaviour when they are not informed about the brand they are tasting. So it intends to demonstrate the brand importance when choosing a product and if the consumers behaviour changes when they are exposed to the product’s extrinsic cues.
2.2-‐ Intrinsic and extrinsic cues
advertising.
Evidence proves that extrinsic cues are more easily recognized, interpreted and assumed than intrinsic cues (Puwar, 1982). Various studies have been conducted concerning alimentary products and beverages that reach different conclusions. Chung
et al (2006) concluded that intrinsic cues are more important but Richardson et al
(1994) found the opposite. Holbrook (1986) and De Chernatony and Knox (1990) suggest that extrinsic cues – principally the brand name and packaging – are more important than intrinsic cues. Those arguments are supported by several studies about beverage products such as sparkling water, beer and sodas (Christopher et al, 1987 e Steenkamp, 1990).
Urdan and Urdan (2001) have conducted a blind taste test for beer and concluded that although consumers consider taste to be the most important attribute, they were unable to recognize their favourite brand based on that intrinsic cue. Therefore, it can
be suggested that the presence of a brand is determinant for consumers' sensorial expectations but also for the selection, purchasing behaviour and acceptance of a product (Deliza; Macfie,1994; Di Monaco et al., 2004; Jaeger, 2006).
2.3-‐Brand
As referred to in the previous topic the brand is considered an extrinsic cue and several studies have proven that this element plays a fundamental role in consumers' preference, selection and choice. According to AMA (American Marketing Association) a brand is the result of a consumer’s experience by grouping pictures and ideas.
A brand is defined as a "Name, term, design, symbol, or any other feature that
identifies one seller's goods or service as distinct from those of other sellers."
Recognition and reactions towards a brand are the result of experiences with a
product or a service. Those experiences are not only related to the use of the product
itself but also to the influence generated by advertising campaigns.
Aaker (1991) agues that a brand is a distinctive name or symbol (logo, trade mark,
packaging) identifying products or services from a seller and distinguishing them from
its competitors. It is important to note that the brand is often more valuable than the
product itself. Nowadays it is common to find examples where brands are more
valuable than products and this is reflected in the intensive concern brand managers
have in controlling and managing this element. As Keller and Lehman (2006) argue, the
brand is a valuable intangible element and companies should manage it carefully.
Recently Sheena and Naresh (2012) pointed out that the goal of a company is not only
to sell their products or services but also to guarantee that their brands stay in the top-‐
of-‐mind recall and assure the loyalty of their customers.
2.3.1-‐ Brand Equity
Brand equity can also be analysed from the consumer’s perspective by understanding in what way the experiences that they have with the brand have contributed so that the brand is learned and memorized. Keller (2008) argues that “a brand has positive customer-‐based brand equity when consumers react more favourably to a product and
the way it is marketed when the brand is identified than when it is not”.
The arguments presented previously suggest that brand equity is invariably defined by the knowledge consumers have of a brand. Keller (2008) highlights two elements that compose the brand knowledge in a consumer perspective: notoriety and brand image. On the one hand, notoriety is related to brand recognition and to the capacity consumers have in identifying a brand in different situations, including brand
recognition and brand recall. On the other hand, brand image is related to consumers’ perceptions about the brand and also the complicity they can have with it: both should be strong, unique and favourable. The same author argues that brand equity is created
when consumers “attribute a high level of notoriety and familiarity with a brand and the associations with it are unique, strong and favourable.”
2.3.4-‐ Brands Studied
It is important to present some characteristics of the brands that were studied whit the objective of identify their communication strategies and their market positioning.
other brands – the flavour. The average price per unit is 0,65€ for a 33 cl bottle and 1,96€ for one litre.
Carlsberg is a Danish brand and it is sold in more than 140 countries, being present in Portuguese market since 1972. In 1991, the Carlsberg group bought a participation in Unicer and since that point, the beer started to be produced and sold by the Portuguese company. Being part of Unicer portfolio, the company argues that Carlsberg is “the principal premium brand in the Portuguese market”. In 2010, Carlsberg had 2% of market share (Nielsen, 2010) but the market share is decreasing year after year and loosing his position to other international brands like Heineken. Recently, with the objective of fighting against the losses, the brand has reviewed all
the communication strategy and had created a new positioning and identity for all foreign markets. The new slogan is “That calls for a Carlsberg”. The average price per unit is 0,65€ for a 25cl bottle and 2,63€ per litre, being positioned has a premium beer.
Cristal is the oldest beer brand in the Portuguese market and it’s sold since 1890. Although the brand is sold in the Portuguese market, it is also found in countries like Switzerland, Angola, France, Germany and U.S.A but strangely is less communicated compared to the others. The previous affirmation is sustained by the fact that is the only brand in Unicer portefolio that does not have a slogan. It is a low-‐cost beer and targeted for consumers who base their purchasing decision in the price. The average price per unit is 0,41€ for a 0,33cl bottle and the price per litre is 1,25€.
SCC produce and commercialize Sagres, Cergal and other brands and has also the exclusive right of commercialize Heineken in Portugal. Sagres is the company’s flagship and the eternal “rival” of Super Bock, having a market share really similar to his direct competitor. The brand is sold since 1940 and was created to represent Portugal in the Exposition of the Portuguese World of that year and whose values are patriotism and Discovery history. It is positioned has a leader and the average price is 0,69€ for a 33cl bottle and 2,09€ for a litre.
commercialized by SCC in Portugal and until 2008 has faced serious problems to impose itself in Portuguese market. By that time, Heineken has bought a participation in SCC and finally could define a marketing strategy for Portugal. The investments were made essentially for promotional actions and sponsorships like summer festivals or what they call Extra Cold parties. The brand argues that it has become “ the premium beer most recognized all over the world”, positioning itself has a premium beer in all markets, apart of the Hollandaise one. A reference that proves the strategy applied by the company is the fact that the sales-‐force is forced to sell the product 1,5 more expensive than other beers. The average price per unit is 0,62€ for a 0,25cl bottle and 2,52€ per litre.
Cergal competes in the Portuguese market sine 1969 but actually is only sold in one retailor (Pingo Doce) but for example in Spain is sold in all the major retailors. The same happens in the Angolan market where it is sold since 2011 and where it has
made several advertisement investments to create a positive brand Image. It is a low-‐ cost beer and one unit (33cl) costs 0,33€ and the litre is sold for 1,00€ being a natural competitor of Cristal.
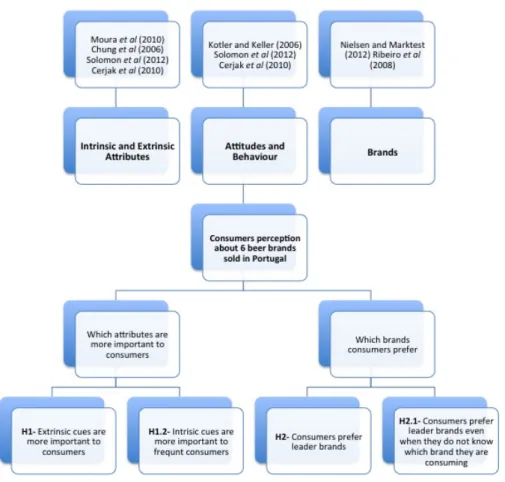
2.4-‐ Conceptual Framework
Figure 1 Conceptual Framework
Beer consumers’ behaviour, their preferences and the relationship they have with brands are topics that were covered in previous studies but those are not conclusive and consistent. It is well known that consumer behaviour and the attitudes toward brands are related to previous experiences and beliefs but also to the level of involvement in the purchase process and also the social role that the consumer is performing when buying a product. It is also known that product attributes can be seen as intrinsic and extrinsic cues and are evaluated in different forms depending on the importance that consumers convey to them.
Most authors argue that extrinsic cues are more important to consumers, principally in products such as beer in which the level of involvement is low. This fact results in
heuristic models and the brand plays a central role in decision-‐making. The brand is not only a symbol that has as a goal a financial return but also has an associated personality that is sometimes felt as a human being and that can be re-‐evaluated continually through time, such as is the case with human relationships.
The research question of the present study is to investigate the consumer’s perceptions about six brands available in major Portuguese retailers. A conceptual framework was developed where hypotheses are defined and sustained by nuclear concepts reviewed in literature. Two specific objectives were defined and together they allow for the tackling of the research question presented previously. For each, hypotheses were created and tested with a survey and taste tests (blind and with the
presence of packaging).
OB1-‐ Determine which product attributes are more important to beer consumers. H1-‐ Extrinsic cues are more important to consumers.
H1.2-‐ Intrinsic cues are more important to frequent consumers.
The previous objective is sustained by the conclusions of Olson (1972) and Olson and Jacoby (1973) that have classified attributes as intrinsic and extrinsic to products. If the first hypothesis is correct it confirms the conclusions of Moura et al (2010) that suggest that extrinsic cues are more important. If the first hypothesis is rejected it confirms the conclusions of Chung et al (2006) that suggest that intrinsic cues are more important. The auxiliary hypothesis is sustained by the work of Solomon et al (2012) and Cerjak et al (2010) that argue that consumers’ choice and selection largely depends on the level of involvement consumers have with the purchasing process. It is suggested that intrinsic cues are more important to frequent consumers because they have more knowledge and interest about the product so the level of involvement is expected to be higher.
OB2-‐ Determine which brand is more appreciated by consumers. H2-‐ Consumers prefer leader brands.
H2.1-‐ Consumers prefer leader brands even when they do not know which brand they are consuming.
Several studies published show that Super Bock and Sagres are leader brands (Marktest; 2012; Nielsen 2012). If those are leaders it is also expectable that consumers prefer them. In respect to the second hypothesis, several authors concluded that the presence of a brand is essential for the formation of consumers sensorial expectations (Deliza; Macfie,1994; Di Monaco et al., 2004; Jaeger, 2006). As such, it is expected that the second hypothesis is rejected and therefore partially
confirms the findings of Ribeiro et al (2008) that concluded that the familiarity with some beer brands has influenced consumer acceptance.
3. Methodology
This research can be defined as conclusive because it involves descriptive and casual
techniques (Malhotra; Birks, 2006). It is descriptive because it involves a technique for collecting data (survey) and it intends to describe a phenomenon, specify concepts and develop a conceptual framework that defines the perspective of the study and links the concepts with their description (Reis, 2010). In addition, it is a pre-‐experimental study and can be classified as a one-‐group pre-‐test-‐post-‐test, where results from the blind test and the taste test are compared (Malhotra; Birks, 2006). According to Malhotra and Birks (2006) this type of study may be symbolized as: O1 X O2.
3.1-‐ Type of study used:
Several studies that involved blind-‐tests of beer allowed the anticipation of some relevant issues concerning studies of this kind. Firstly, the plastic cups used for the beer were disposable. According to Moura et al. (2010), this procedure is important because it guarantees that the perception of the taste is not influenced by any beer
residue, disinfectant or soap. The same authors suggest a procedure that was followed in this investigation: all the beers were cooled and kept in the same refrigerator, guaranteeing that all the samples were at the same temperature. According to the APCV, the type of beer used (pilsner) must be consumed between 4º and 7º Celsius and the plastic cups must be at an ambient temperature. To guarantee that the beer was at an adequate temperature a thermometer was used to confirm the temperature of the samples. (appendix 1)
Each cup (transparent) was filled with 60ml of beer because according to Urdan and Urdan (2001) this is the quantity suggested by breweries to taste beer, which allows for the best perception of the flavour. Cream crackers and mineral water were also made available to tasters to intercalate tasting tests, this is a measure suggested by APCV and other international specialists (appendix 2). It is also important to note that the letters assigned to each cup in the blind-‐test were not the same as in the tasting test, this measure guarantees that there was no influence in the answers in the two parts of the evaluation.
3.2-‐ Experience:
Firstly, participants were invited to answer a survey composed of nine questions to allow the researcher to define the sample size and also to verify postulated hypotheses. The first five questions were related to beer and brand preferences and
the last four to socio-‐demographic aspects (appendix 3). After filling out the survey, participants were invited to taste and evaluate six beers in two different moments. To evaluate the beers, participants had a tasting card corresponding to each cup
possible to determine if the presence of the bottle (packaging / brand) had an influence on the participants’ evaluation. The completion of the survey at the beginning of the experience enabled the determination of which brand was most appreciated and also clarified which attributes were most important to consumers. The experience was conducted over three days and each participant took approximately 30 minutes to conclude it. The conditions of temperature and light of the room were the same for all participants; the setting can be consulted in appendix 5.
3.3-‐ Samples characterization:
This investigation has two types of samples that will be characterized in this section: the beers that were used and the participants in the tests.
3.3.1-‐ Beers:
The beers were selected by convenience and the choice was based not only on the two breweries selling three brands each but also because the three pairs of brands (Super Bock – Sagres; Carlsberg – Heineken; Cristal – Cergal) are natural competitors. Super Bock and Sagres are leaders, Carlsberg and Heineken foreign premiums and Cristal and Cergal have a low-‐price strategy. The choice of the type of beer (pilsner) is justified by taking into account the share of shelf calculation of Portuguese major retailers, where this type of beer represented 69,65% of all beer sales (June to November 2012, Marktest). For this reason it is probable that if most consumers buy pilsner beer, their evaluation will be more reliable.
3.3.2-‐ Participants:
participants were students or part-‐time students (79,4%) and the remaining (17,4%) were free-‐lancers or company workers. Consult the full description of the participant sample in appendix 6.
4. Results analyses
In this section the results of the first hypothesis and auxiliary hypothesis are presented followed by the results of the second hypothesis and auxiliary hypothesis. The scope of this section is to present the statistical procedures that were followed and the results of those tests. The discussion and implications of the results are presented in the next topic.
H1-‐ Extrinsic cues are more important to consumers.
With regard to the first hypothesis, an analysis of the means was conducted with the
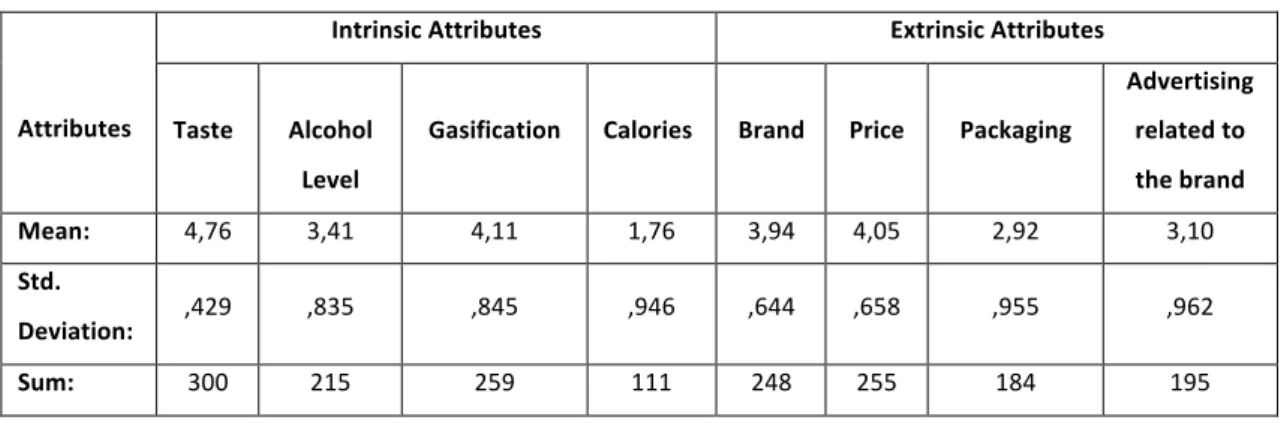
objective of understanding which attributes were more important to consumers. The results indicate that taste is the most important (4,76) and it was the only parameter considered important (23,8%) or very important (76,2%) for consumers (Table 1). The
gasification is the second most important attribute (4,11), followed by the price (4,05), the brand (3,94), alcohol level (3,41) and the advertising related to the brand (3,10). The two attributes given lower importance are the packaging (2,92) and finally the calories (1,76). The detailed analyses of the frequencies of each attribute can be consulted in appendix 7.
Table I Attributes importance when choosing a beer
Attributes
Intrinsic Attributes Extrinsic Attributes
Taste
Alcohol
Level
Gasification
Calories
Brand
Price
Packaging
Advertising
related to
the brand
Mean: 4,76 3,41 4,11 1,76 3,94 4,05 2,92 3,10
Std.
Deviation: ,429 ,835 ,845 ,946 ,644 ,658 ,955 ,962
Sum: 300 215 259 111 248 255 184 195
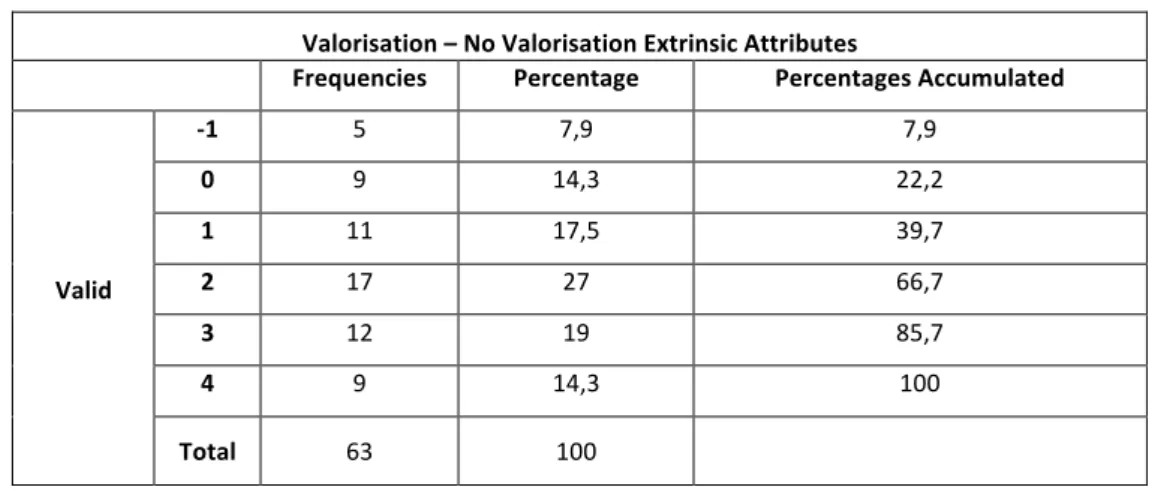
In order to have a variable that defines if consumers give importance or not to attributes, four addictive indexes were created. Two for intrinsic attributes (taste, alcoholic level, level of gasification and calories) and two for extrinsic attributes (brand, price, packaging and advertising related to the brand). Each index encompassed the four attributes of each type. Table II shows that the largest part of consumers (72%) do not give importance to intrinsic cues and approximately ¼ is neutral (27%). By analysing table III it is possible to note that the largest part of consumers give importance to extrinsic attributes (77,8) and only a small part (7,9%) do not give importance to this kind of attributes.
Table II Intrisic attributes value
Valorisation-‐ No Valorisation Intrinsic Attributes
Frequencies Percentage Percentages Accumulated
Valid
-‐2 10 15,9 15,9
-‐1 36 57,1 73
0 17 27 100
Total 63 100
Table III Extrinsic attributes value
Valorisation – No Valorisation Extrinsic Attributes
Frequencies Percentage Percentages Accumulated
Valid
-‐1 5 7,9 7,9
0 9 14,3 22,2
1 11 17,5 39,7
2 17 27 66,7
3 12 19 85,7
4 9 14,3 100
Total 63 100
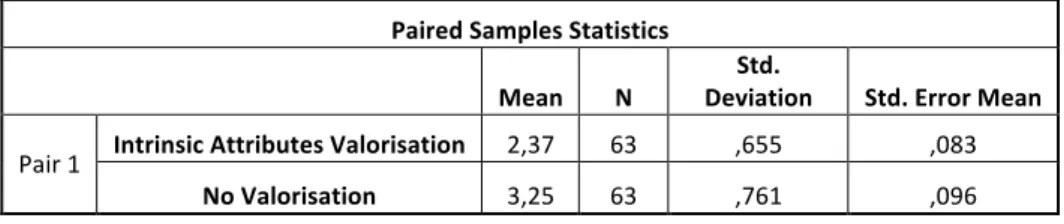
In the next step, the means of each index were compared using the T-‐Student test for
(p= 0,000). There are also statistically significant differences between the means of the two indexes (t (62)= 10,849; p=0,000).
Table IV Student Tesy Paired Samples for Intrisic Attributes
Paired Samples Statistics
Mean N
Std.
Deviation Std. Error Mean
Pair 1 Intrinsic Attributes Valorisation 2,37 63 ,655 ,083 No Valorisation 3,25 63 ,761 ,096
Table V Student test Paired Samples for Intrisic Attributes Correlation
Paired Samples Correlation
Pair 1 Valorisation &
No-‐Valorisation Intrinsic Attributes
N Correlation Sig.
63 ,587 ,000
Table VI T-‐Student test Paired Samples for Intrisic Attributes Paired Differences
Paired Samples Test
Paired Differences
t df Sig. (2-‐ tailed) Mean Std.
Deviation
Std. Error Mean
95% Confidence Interval of Difference
Lower Upper
Intrinsic Attributes Valorisation – No
Valorisation
-‐,839 ,650 ,082 -‐1,053 -‐,725 -‐10,849 62 ,000
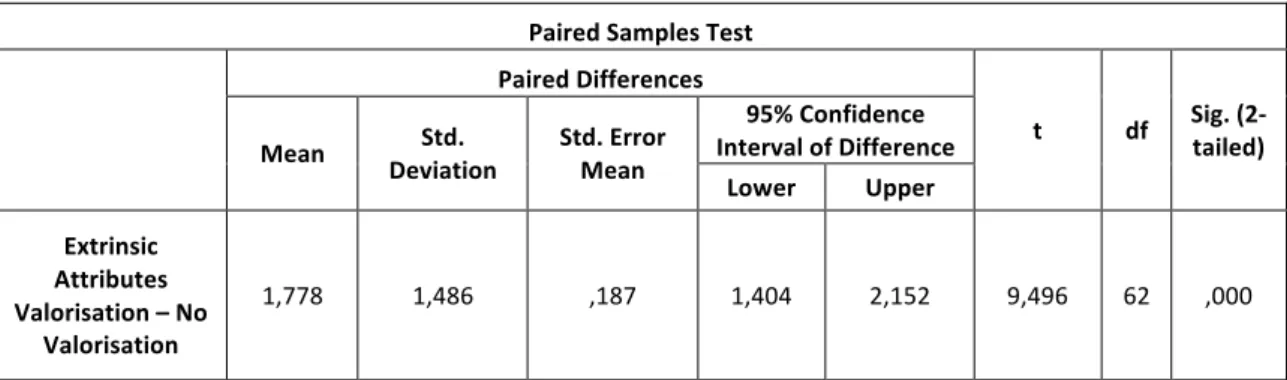
The same test was conducted for extrinsic attributes. Analysing tables VII, VIII and IX it is possible to observe that the mean of “no importance” (0,52) is inferior to the mean of the importance (2,30). The correlation between the two variables is weak (0,335) and statistically significant (p=0,007). There are also statistically significant differences between the means of the two indexes (t (62)= 9,496; p= 0,000).
Table VII T-‐Student test Paires Samples for Extrinsic Attributes
Paired Samples Statistics
Mean N
Std.
Deviation Std. Error Mean
Table VIII T-‐Student test Paired Samples for Extrinsic Attributes
Paired Samples Correlation
Pair 1 Valorisation &
No-‐Valorisation Extrinsic Attributes
N Correlation Sig.
63 ,335 ,007
Table IX T-‐Student test Paired Samples for Extrinsic Attributes
Paired Samples Test
Paired Differences
t df Sig. (2-‐ tailed) Mean Std.
Deviation
Std. Error Mean
95% Confidence Interval of Difference
Lower Upper
Extrinsic Attributes Valorisation – No
Valorisation
1,778 1,486 ,187 1,404 2,152 9,496 62 ,000
H1.2-‐ Intrinsic cues are more important to frequent consumers.
In order to verify the auxiliary hypothesis it was necessary to divide the participants into two groups (occasional consumers and frequent consumers). This division was done taking into consideration the first two answers of the survey. Results suggest that those who answer that they do not or rarely drink beer, consume less than one beer per week. The occasional consumers drink on average 6 (5,71) beers per week and frequent consumers 9 (9,45) beers per week. After analysing those results, a new variable was created dividing consumers into two groups: occasional consumers (until or less than 6 beers per week) and frequent consumers (more than 6 beers per week). This new variable enabled the comparison of the results of both groups. The group of occasional consumers was composed of 26 participants (41,3%) and frequent consumers of 37 participants (58,7%). The tables can be consulted in appendix 8.
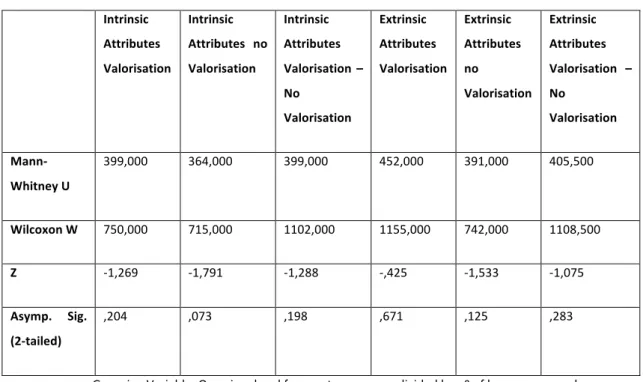
After this division it was pertinent to analyse once again the results of the importance or no importance consumers give to attributes. For these analyses the Maan-‐Whitney
Table X Mann Whitney Attributes Value
Intrinsic
Attributes
Valorisation
Intrinsic
Attributes no
Valorisation
Intrinsic
Attributes
Valorisation –
No
Valorisation
Extrinsic
Attributes
Valorisation
Extrinsic
Attributes
no
Valorisation
Extrinsic
Attributes
Valorisation –
No
Valorisation
Mann-‐
Whitney U
399,000 364,000 399,000 452,000 391,000 405,500
Wilcoxon W 750,000 715,000 1102,000 1155,000 742,000 1108,500
Z -‐1,269 -‐1,791 -‐1,288 -‐,425 -‐1,533 -‐1,075
Asymp. Sig.
(2-‐tailed)
,204 ,073 ,198 ,671 ,125 ,283
a. Grouping Variable: Occasional and frequent consumers divided by nº of beers consumed
The analysis of the results shows that there were no statistically significant differences. However, in the case of “no importance” of intrinsic attributes the difference is accentuated (M-‐W=364; p=0,073). According to the mean rank, occasional consumers (35,15) give more importance to intrinsic attributes than frequent consumers (29,78). The same thing happens with extrinsic attributes where occasional consumers gave more importance (34,90) than frequent consumers (29,96). The results of this procedure can be consulted in annexes (appendix 9).
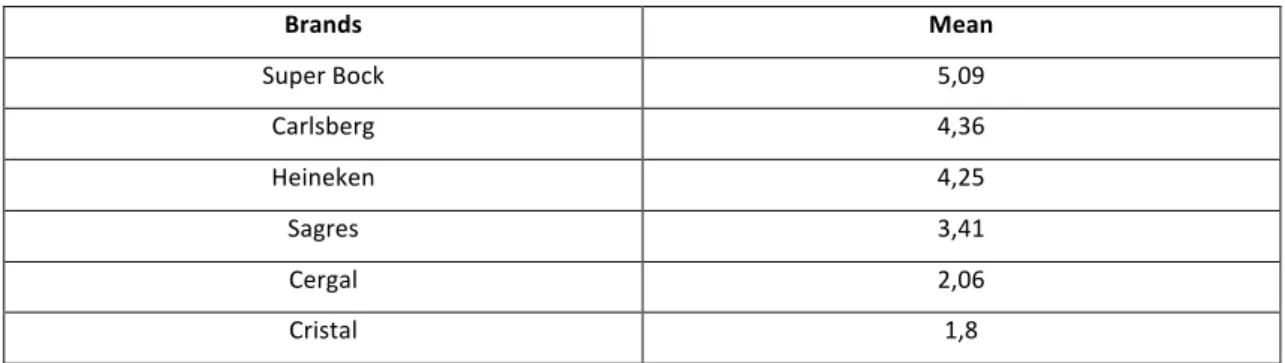
H2-‐ Consumers prefer leader brands.
In order to verify this hypothesis the answer consumers gave in the survey was firstly analysed. The results suggest that Super Bock is the preferred brand (5.09), followed by Carlsberg (4.36), Heineken (4.25), Sagres (3.41), Cergal (2.06) and Cristal (1.8).
Table XI Brand Preferences
Brands Mean
Super Bock 5,09
Carlsberg 4,36
Heineken 4,25
Sagres 3,41
Cergal 2,06
Cristal 1,8
After the previous analysis, a Mann-‐Whitney test was applied with the purpose of detecting and comparing differences between the means of each brand attributed by occasional consumers and frequent consumers. The results are:
Table XII Mann Whitney Brands Preferences
Super Bock Sagres Heineken Carlsberg Cristal Cergal
Mann-‐
Whitney U
383,500 349,500 452,000 445,000 343,500 465,500
Wilcoxon W 734,500 1052,500 1155,000 1148,000 694,500 1168,500
Z -‐1,483 -‐1,931 -‐,421 -‐,517 -‐2,112 -‐,238
Asymp. Sig. (2-‐tailed)
,138 ,053 ,674 ,605 ,035 ,812
a. Grouping Variable: Occasional and frequent consumers divided by nº of beers consumed
much more appreciated by frequent consumers (35,72) than occasional consumers (26,71). Finally in the case of Cergal, occasional consumers attributed a higher rate (32,60) than frequent consumers (31,58). The results of this procedure can be consulted in annexes (appendix 10).
H2.1-‐ Consumers prefer leader brands even when they do not know which brand they are consuming.
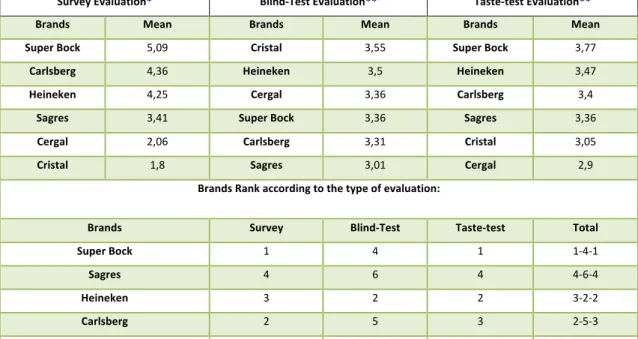
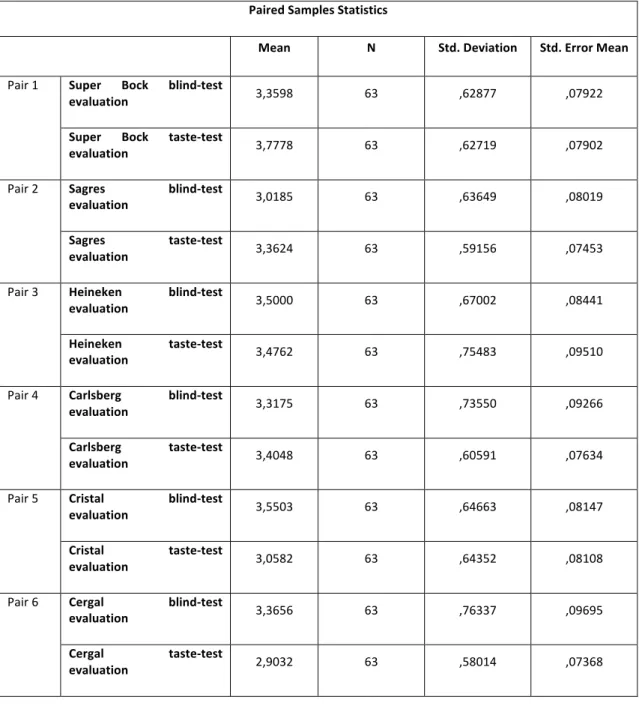
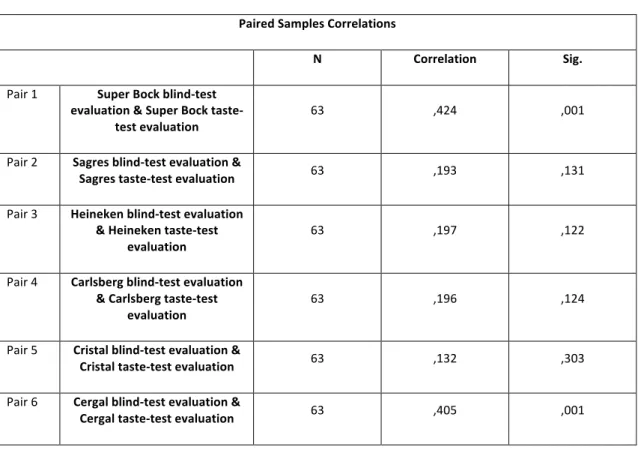
In order to verify the auxiliary hypothesis it was necessary to create two addictive indexes for each brand representing the general evaluation in the blind test and in the taste-‐test. After this procedure it was possible to compare brands evaluation in the two moments of taste testing with the answers gave in the previous hypothesis. Table
XIII shows the means of each brand in the three moments of evaluation (survey, blind-‐ test, taste-‐test):
Table XIII Brands Positions
Survey Evaluation* Blind-‐Test Evaluation** Taste-‐test Evaluation**
Brands Mean Brands Mean Brands Mean
Super Bock 5,09 Cristal 3,55 Super Bock 3,77
Carlsberg 4,36 Heineken 3,5 Heineken 3,47
Heineken 4,25 Cergal 3,36 Carlsberg 3,4
Sagres 3,41 Super Bock 3,36 Sagres 3,36
Cergal 2,06 Carlsberg 3,31 Cristal 3,05
Cristal 1,8 Sagres 3,01 Cergal 2,9
Brands Rank according to the type of evaluation:
Brands Survey Blind-‐Test Taste-‐test Total
Super Bock 1 4 1 1-‐4-‐1
Sagres 4 6 4 4-‐6-‐4
Heineken 3 2 2 3-‐2-‐2
Carlsberg 2 5 3 2-‐5-‐3
Cristal 6 1 5 6-‐1-‐5
Cergal 5 3 6 5-‐3-‐6
* In the survey question, participants were invited to rank brands according to their preferences (1-‐ less preferred / 6-‐ preferred).
** In the blind-‐test and taste-‐test, participants were invited to classify each beer according to five attributes using a 5 points Likert scale. (1-‐didn’t like it at all / 5-‐ like it very much).